SPEECH AND SLIDING TEXT AIDED SIGN RETRIEVAL FROM HEARING IMPAIRED
SIGN NEWS VIDEOS
Oya Aran, Ismail Ari, Lale Akarun
PILAB, Bogazici University, Istanbul, Turkey
{
aranoya
;
ismailar
;
akarun
}
@boun.edu.tr
Erinc Dikici, Siddika Parlak, Murat Saraclar
BUSIM, Bogazici University, Istanbul, Turkey
{
erinc.dikici
;
siddika.parlak
;
murat.saraclar
}
@boun.edu.tr
Pavel Campr, Marek Hruz
University of West Bohemia, Pilsen,
Czech Republic
{
campr
;
mhruz
}
@kky.zcu.cz
ABSTRACT
The objective of this study is to automatically extract annotated sign data from the broadcast news recordings for the hearing impaired. These recordings present an excellent source for au-tomatically generating annotated data: In news for the hearing impaired, the speaker also signs with the hands as she talks. On top of this, there is also corresponding sliding text superimposed on the video. The video of the signer can be segmented via the help of either the speech or both the speech and the text, gener-ating segmented, and annotated sign videos. We call this appli-cation as Signiary, and aim to use it as a sign dictionary where the users enter a word as text and retrieves sign videos of the related sign. This application can also be used to automatically create annotated sign databases that can be used for training rec-ognizers.
KEYWORDS
speech recognition – sliding text recognition – sign language analysis – sequence clustering – hand tracking
1. INTRODUCTION
Sign language is the primary means of communication for deaf and mute people. Like spoken languages, it emerges naturally among the deaf people living in the same region. Thus, there ex-ist a large number of sign languages all over the world. Some of them are well known, like the American Sign Language (ASL), and some of them are known by only a very small group of deaf people who use it. Sign languages make use of hand ges-tures, body movements and facial expressions to convey infor-mation. Each language has its own signs, grammar, and word order, which is not necessarily the same as the spoken language of that region.
Turkish sign language (Turk Isaret Dili, TID) is a natural full-fledged language used in the Turkish deaf community [1]. Its roots go back to the 16th century, to the time of the Ottoman Empire. TID has many regional dialects, and is used throughout Turkey. It has its own vocabulary and grammar, and its own sys-tem of fingerspelling and it is completely different from spoken Turkish in many aspects, especially in terms of word order and grammar [2].
In this work, we aim to exploit videos of the Turkish news for the hearing impaired in order to generate usable data for sign language education. For this purpose, we have recorded news videos from the Turkish Radio-Television (TRT) channel. The
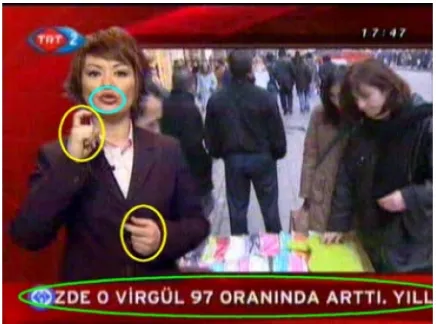
broadcast news is for the hearing impaired and consists of three major information sources: sliding text, speech and sign. Fig.1 shows an example frame from the recordings.
Figure 1:An example frame from the news recordings. The three information sources are the speech, sliding text, signs.
The three sources in the video convey the same information via different modalities. The news presenter signs the words as she talks. However, since it is not necessary to have the same word ordering in a Turkish spoken sentence and in a Turkish sign sentence [2], the signing in these news videos is not con-sidered as TID but can be called as signed Turkish: the sign of each word is from TID but their ordering would have been dif-ferent in a proper TID sentence. Moreover, facial expressions and head/body movements, which are frequently used in TID, are not used in these signings. Since the signer also talks, no fa-cial expression that uses lip movements can be done. In addition to the speech and sign information, a corresponding sliding text is superimposed on the video. Our methodology is to process the video to extract the information content in the sliding text and speech components and to use both the speech and the text to generate segmented and annotated sign videos. The main goal is to use this annotation to form a sign dictionary. Once the an-notation is completed, unsupervised techniques are employed to check consistency among the retrieved signs, using a clustering of the signs.
Figure 2:Modalities and the system flow
the word in the news videos by using the speech. At this step the application returns several intervals from different videos that contain the entered word. If the resolution is high enough to analyze the lip movements, audio-visual analysis can be ap-plied to increase speech recognition accuracy. Then, sliding text information is used to control and correct the result of the re-trieval. This is done by searching for the word in the sliding text modality during each retrieved interval. If the word can also be retrieved by the sliding text modality, the interval is as-sumed to be correct. The sign intervals are extracted by analyz-ing the correlation of the signs with the speech. However, the signs in these intervals are not necessarly the same. First, there can be false alarms of the retrieval corresponding to some unre-lated signs and second, there are homophonic words that have the same phonology but different meanings; thus, possibly dif-ferent signs. Thus we need to cluster the signs that are retrieved by the speech recognizer.
In Sections2,3and4, we explain the analysis techniques and results of the recognition experiments for speech, text and sign modalities, respectively. The overall assesment of the sys-tem is given in Section5. In Section6, we give the details about the Signiary application and its graphical user interface. We conlude and discuss further improvement areas of the system in Section7.
2. SPOKEN TERM DETECTION
Spoken term detection (STD) is a subfield of speech retrieval, which locates occurrences of a query in a spoken archive. In this work, STD is used as a tool to segment and retrieve the signs in the news videos based on speech information. After the location of the query is extracted with STD, the sign video corresponding to that time interval is displayed to the user. The block diagram of the STD system is given in Fig.3.
The three main components of the system are: speech recog-nition, indexation and retrieval. The speech recognizer converts the audio data, extracted from videos, into a symbolic represen-tation (in terms of weighted finite state automata). The index, which is represented as a weighted finite state transducer, is built offline, whereas the retrieval is performed after the query is en-tered. The retrieval module uses the index to return the time, program and relevance information about the occurrences of the query. Now, we will explain each of the components in detail.
Figure 3:Block diagram of the spoken term detection system
2.1. Speech recognition
Prior to recognition, audio data is segmented into utterances based on energy, using the method explained in [3]. The speech signal corresponding to each utterance is converted into a textual representation using an HMM based large vocabulary continu-ous speech recognition (LVCSR) system. The accontinu-oustic models consist of decision tree clustered triphones and the output prob-abilities are given by Gaussian mixture models. As the language model, we use word based n-grams. The recognition networks and the output hypotheses are represented as weighted automata. The details of the ASR system can be found in [4].
The HTK toolkit[5] is used to produce the acoustic feature vectors and AT&T’s FSM and DCD tools[6] are used for recog-nition.
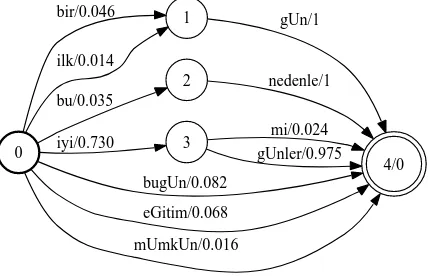
The mechanism of an ASR system requires searching through a network of all possible word sequences. One-best output is ob-tained by finding the most likely hypothesis. Alternative likely hypotheses can be represented using a lattice. To illustrate, lat-tice output of a recognized utterance is shown in Fig. 4. The labels on arcs are words and the weights indicate the probability of arcs [7]. In Fig. 4, the circles represent states, where state ’0’ is the initial state and state ’4’ is the final state. An utterance hypothesis is a path between the initial state and one of the final states. The probability of each path is computed by multiplying the probabilities of the arcs on that path. For example, the prob-ability of pathiyi gUnleris0.73×0.975≃0.71, which is the highest of all hypotheses (one-best).
0
1 bir/0.046
ilk/0.014
2 bu/0.035
3 iyi/0.730
4/0 bugUn/0.082
eGitim/0.068
mUmkUn/0.016
gUn/1
nedenle/1
mi/0.024 gUnler/0.975
2.2. Indexation
Weighted automata indexation is an efficient method in retrieval of uncertain data. Since the output of the ASR (hence, input to the indexer) is a collection of alternative hypotheses repre-sented as weighted automata, it is advantageous to represent the index as a finite state transducer. Therefore, the automata, (out-put of ASR) are turned into transducers such that the in(out-puts are words and the outputs are utterance numbers, which the word appears in. By taking the union of these transducers, a single transducer is obtained, which is further optimized via weighted transducer determinization. The resulting index is optimal in search complexity, the search time is linear in the length of the input string. The weights in the index transducer correspond to expected counts, where the expectation is taken under the prob-ability distribution given by the lattice [8].
2.3. Retrieval
Having built the index, we are now able to transduce input queries into utterance numbers. To accomplish this, the queries are rep-resented as finite state automata and composed with the index transducer (via weighted finite state composition) [8]. The out-put is a list of all utterance numbers which the query appears in, as well as the corresponding expected counts. Next, utterances are ranked based on expected counts, the ones higher than a par-ticular threshold are retrieved. We apply forced alignment on the utterances to identify the starting time and duration of each term [9].
As explained in section2.1, use of lattices introduces more than one hypothesis for the same time interval, with different probabilities. Indexation estimates the expected count using these path probabilities. By setting a threshold on the expected count, different precision-recall points can be obtained which re-sults in a curve. On the other hand, one-best hypothesis can be represented with only one point. Having a curve allows choos-ing an operatchoos-ing point by varychoos-ing the threshold. Use of a higher threshold improves precision but recall falls. Conversely, a lower threshold value causes less probable documents to be retrieved. This increases recall but decreases precision.
The opportunity of choosing the operating point is a great advantage. Depending on the application, it may be desirable to retrieve all of the related documents or only the most probable ones. For our case, it is more convenient to operate at a point where precision is high.
2.4. Experiments and results
2.4.1. Evaluation
Speech recognition performance is evaluated by the word error rate (WER) metric which was measured to be around 20% in our previous experiments.
Retrieval part is evaluated via precision-recall rates and F-measure, which are calculated as follows: GivenQ queries, let the reference transcriptions includeR(q)occurrences of the queryq,A(q)be the total number of retrieved documents and C(q)be the number of correctly retrieved documents. Then:
Precision = 1
Evaluation is done over 15 news videos, each with an ap-proximate duration of 10 minutes. Our query set consists of
all the words seen in manual transcriptions (excluding foreign words and acronyms). Correct transcriptions are obtained man-ually and the time intervals are obtained by forced viterbi align-ment. The acoustic model of the speech recognizer is trained on our broadcast news corpus, which includes approximately 100 hours of speech. The language models are trained on a text cor-pus, consisting of 96M words [4].
We consider the retrieved occurrence as a correct match if the time interval falls within±0.5 seconds of the correct inter-val, if not, we assume a miss or false alarm.
2.4.2. Results
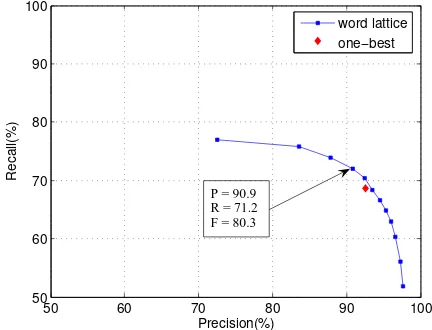
We experimented with both lattice and one-best indexes. As mentioned before, the lattice approach corresponds to a curve in the plot, while one-best approach is represented with a point. The resulting precision-recall graph is depicted as in Fig.5
50 60 70 80 90 100
Figure 5: Precision-Recall for word-lattice and one-best hy-potheses when no limit is set on maximum number of retrieved documents
In the plot, we see that, use of lattices performs better than one-best. The arrow points at the position where the maximum F-measure is achieved for lattice. We also experimented with setting a limit on the number of retrieved occurrences. When only 10 occurrences are selected, precision-recall results were similar on one-best vs lattice performance. However, the max-F measure obtained by this method outperforms the previous by 1%. A comparison of lattice and one-best performances (in F-measure) is given in Table1, for both experiments. Use of lattices introduces 1-1.5 % of improvement in F-measure. Since the broadcast news corpora are fairly noiseless, the achievement may seem minor. However for noisy data, this improvement is much higher [7].
Max-F(%) Max-F@10(%)
Lattice 80.32 81.16
One-best 79.05 80.06
3. SLIDING TEXT RECOGNITION
3.1. Sliding Text Properties
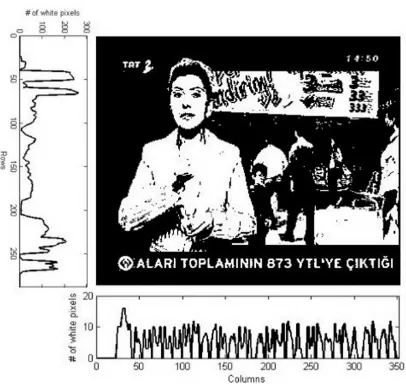
The second modality consists of the overlaid sliding text, which includes simultaneous transcription of the speech. We work with 20DivXrencoded color videos, having two different resolu-tions (288x352 - 288x364), and 25 fps sampling rate. The slid-ing text band at the bottom of the screen contains a solid back-ground and white characters with a constant font. Sliding text speed does not change considerably throughout the whole video sequence (4 pixels/frame). Therefore, each character appears on the screen for at least 2.5 seconds. An example of a frame with sliding text is shown in Fig.6.
Figure 6:Frame snapshot of the broadcast news video
3.2. Baseline Method
Sliding text information extraction consists of three steps: ex-traction of the text line, character recognition and temporal align-ment.
3.2.1. Text Line Extraction
Since the size and position of the sliding text is constant through-out the video, it is deternined at the first frame and used in the rest of the operations. To find the position of the text, first, we convert the RGB image into a binary image, using grayscale quantization and thresholding with the Otsu method [10]. Then we calculate horizontal projection histogram of the binary im-age, i.e., the number of white pixels for each row. The text band appears as a peak on this representation, separated from the rest of the image. We apply a similar technique over the cropped text band, this time on the vertical projection direction, to eliminate the program logo. The sliding text is bounded by the remain-ing box, whose coordinates are defined as the text line position. Fig.7shows an example of binary image with its horizontal and vertical projection histograms.
Since there is redundant information in successive frames, we do not extract text information from every frame. Experi-ments have shown that updating the text transcription once in every 10 frames is optimal for achieving sufficient recognition accuracy. We call these the ”sample frames”. The other frames in between are used for noise removal and smoothing.
Noise in binary images stems mostly from quantization op-erations in color scale conversion. Considering the low reso-lution of our images, noise can cause two characters, or two
Figure 7:Binary image with horizontal and vertical projection histograms
distinct parts of a single character to be combined, which com-plicates the segmentation of text into characters. We apply mor-phological opening with a 2x2 structuring element to remove such effects of noise. To further smooth the appearance of char-acters, we horizontally align binary text images of the frames between two samples, and for each pixel position, decide on a 0 or 1, by voting.
Once the text image is obtained, vertical projection histogram is calculated again to find the start and end positions of every character. Our algorithm assumes that two consecutive char-acters are perfectly separated by at least one black pixel col-umn. Words are segmented by looking for spaces which exceed an adaptive threshold, which takes into account the outliers in character spacing. To achieve proper alignment, only complete words are taken for transcription at each sample frame.
Each character is individually cropped from the text figure and saved, along with its start and end horizontal pixel positions.
3.2.2. Character Recognition
Since the font of the sliding text is constant in all videos, tem-plate matching method is implemented for character recogni-tion. Normalized Hamming distance is used to compare each binary character image to each template. The total number of matching pixels are divided by the size of the character image and used as a normalized similarity score: Letnijbe the total
number of pixel positions, where binary template pixel has value iand character pixel has valuej. Then, the score is formulated as:
sj=
n00+n11
n00+n01+n10+n11
(3)
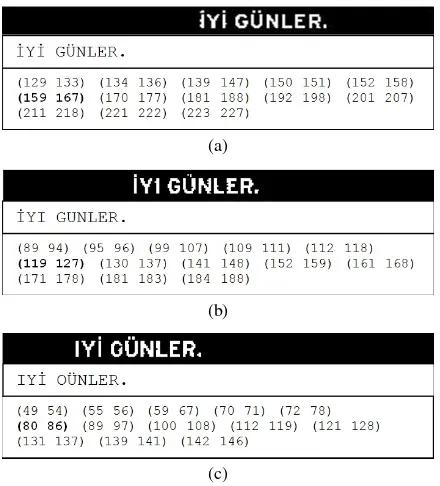
The character whose template gets the best score is assigned to that position. Matched characters are stored as a string. Fig.8 depicts the first three sample text band images, their transcribed text and corresponding pixel positions.
3.2.3. Temporal Alignment
(a)
(b)
(c)
Figure 8:First three sample frames and their transcription re-sults
shift values. For instance in Figure8, the recognized ”G” which appears in positions 159-167 in the first sample (a) and the one in 119-127 of the second (b) refer to the same character, since we investigate each 10th frame with 4 pixels of shift per frame. Small changes in these values (mainly due to noise) are compen-sated using shift-alignment comparison checks. Therefore, we obtain a unique pixel position (start-end) pair for each character seen on the text band.
The characters in successive samples, which have the same unique position pair may not be identical, due to recognition er-rors. Continuing the previous example, we see that the parts of figures which corresponds to the positions in boldface are rec-ognized as ”G”, ”G” and ”O”, respectively. The final decision is made by majority voting; the character that is seen the most is assigned to that position pair. Therefore, in our case, we decide on ”G” for that position pair.
3.2.4. Baseline Performance
We compare the transcribed text with the ground truth data and use character recognition and word recognition rates as perfor-mance criteria. Even if only one character of a word is misrec-ognized, we label this word as erroneous.
Applying the baseline method on the same corpora as speech recognition, we achieved 94% character recognition accuracy, and 70% word recognition accuracy.
3.2.5. Discussions
One of the most important challenges of character recognition was the combined effect of low resolution and noise. We work with frames of considerably low resolution, therefore, each char-acter covers barely an area of 10-14 pixels in height and 2-10 pixels in width. In such a small area, any noise pixel distorts the image considerably, thus making it harder to achieve a reason-able score by template comparison.
Noise cancellation techniques, described in subsection3.2.1, created another disadvantage since they removed distinctive parts
of some Turkish characters, such as erasing dots (˙I, ¨O, ¨U), or pruning hooks (C¸ , S¸). Fig. 9shows examples of such charac-ters, which, after noise cancellation operations, look very much the same. A list of top 10 commonly confused characters, along with their confusion rates, is given in Table2.
Figure 9:Examples to commonly confused characters
Table 2:Top 10 commonly confused characters Character Character Confusion (Original) (Recognized) Rate (%)
8 B 65.00
0 O 47.47
¨
O O 42.03
O 0 40.56
S S¸ 39.79
B 8 35.97
5 S 27.78
G O 22.65
S¸ S 39.79
2 Z 13.48
As it can be seen in Table2, the highest confusion rates occur in the discrimination of similarly-shaped characters and numbers, and Turkish characters with diacritics.
3.3. Improvements over the Baseline
We made two major improvements over the baseline system, to improve recognition accuracy. The first one is to use Jaccard’s coefficient as template match score. Jaccard uses pixel compar-ison with a slightly different formulation. Following the same notation as in3.2.2, we have [11]:
sj=
n11
n11+n10+n01
(4)
A second approach to improve recognition accuracy is cor-recting the transcriptions using Transformation Based Learning [12], [13].
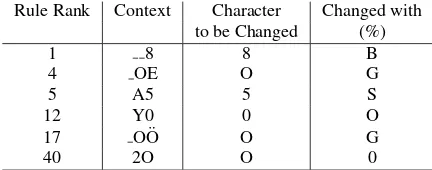
Transformation Based Learning (TBL) is a supervised clas-sification method, commonly used in natural language process-ing. The aim of TBL is to find the most common changes on a training corpus and construct a rule set which leads to the high-est classification accuracy. A corpus of 11M characters, col-lected from a news website, is used as training data for TBL. The labeling problem is defined as choosing the most probable character among a set of alternatives. For the training data the alternatives for each character are randomly created using the confusion rates presented in Table2. Table3presents some of the learned rules and their rankings. For example, in line 2, the letter ”O”, which starts a new word and is succeeded by an ”E” is suggested to be changed to a ”G”.
Table 3:Learned rules by TBL training Rule Rank Context Character Changed with
to be Changed (%)
1 8 8 B
4 OE O G
5 A5 5 S
12 Y0 0 O
17 O ¨O O G
40 2O O 0
3.4. Integration of Sliding Text Recognition and Spoken Term Detection
The speech and sliding text modalities are integrated via a cas-cading strategy. Output of the sliding text recognition is used like a verifier on the spoken term detection.
The cascade is implemented as follows: In the STD part, the utterances whose relevance scores exceed a particular threshold are selected, as in section2.3. In the sliding text part, spoken term detection hypotheses are checked with sliding text recog-nition. Using the starting time information provided by STD, the interval ofstarting time±4seconds is scanned on the slid-ing text output. The word which is closest to the query (in terms of normalized minimum edit distance) is assigned as the corre-sponding text result. The normalized distance is compared to another threshold. Those below the distance threshold are as-sumed to be correct and returned to the user.
70 75 80 85 90 95 100
50 55 60 65 70 75 80
Precision (%)
Recall (%)
only speech sliding text aided
P = 98.5 R = 56.8
P = 97.5 R = 50.8
Figure 10: Precision-Recall curves using only speech informa-tion and using both speech and sliding text informainforma-tion
Evaluation of the sliding text integration is done as explained in section2.4.1. The resulting precision recall curves are shown in Figure10. To obtain the text aided curve, probability old in STD is set to 0.3 (determined empirically) and the thresh-old on the normalized minimum edit distance is varied from 0.1 to 1. Sliding text integration improves the system performance by 1% in maximum precision, which is a considerable improve-ment in the high precision region. Using both text and speech, the maximum attainable precision is 98.5%. This point also has a higher recall than maximum precision of only speech.
4. SIGN ANALYSIS
4.1. Skin color detection
Skin color is widely used to aid segmentation in finding parts of the human body [14]. We learn skin colors from a training set and then create a model of them using a Gaussian Mixture Model (GMM).
Figure 11:Examples from the training data
4.1.1. Training of the GMM
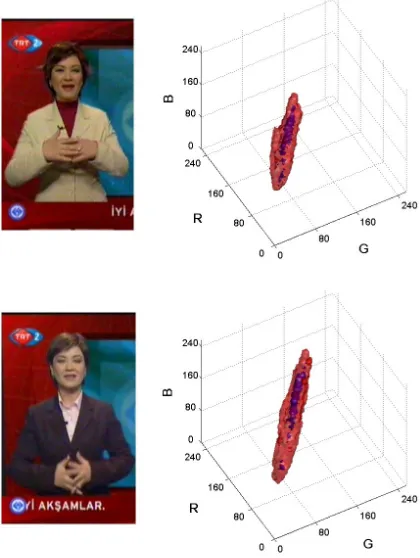
We prepared a set of training data by extracting images from our input video sequences and manually selecting the skin col-ored pixels. In total, we processed six video segments. Some example training images are shown in Fig.11. We use the RGB color space for color representation. In the current videos that we process, there are a total of two speakers/signers. RGB color space gives us an acceptable rate of detection with which we are able to perform an acceptable tracking. However, we should change the color space to HSV when we expect a wider range of signers, from different ethnicities [15].
The collected data are processed by the Expectation Maxi-mization (EM) algorithm to train the GMM. After inspecting the spatial parameters of the data, we decided to use a five Gaussian mixtures model.
Figure 12: Skincolor probability distribution. There are two probability levels visible. The outside layer corresponds to prob-ability of 0.5 and the inner layer correresponds to probprob-ability of 0.86.
of each Gaussian in the mixture. To reduce the time complex-ity of this operation, we have precomputed the probabilities and used table look-up.
The values of the look-up table are computed from the prob-ability density function given by the GMM and we obtain a 256 x 256 x 256 look-up table containing the probabilities of all the colors from RGB color space. The resulting model can be ob-served in Fig.12.
4.1.2. Adaptation of general skin color model for a given video sequence
To handle different illuminations and different speakers accu-rately, we need to adapt the general look-up table, modeled from several speakers, to form an adapted look-up table for each video. Since manual data editing is not possible at this stage, a quick automatic method is needed.
Figure 13: Examples of different lighting conditions resulting in different skin color of the speaker and the corresponding adapted skincolor probability distribution.
We detect the face of the speaker [16] and store it in a sep-arate image. This image is then segmented using the general look up table. We generate a new look-up table by processing all the pixels of the segmented image and store the pixels’ color in the proper positions in the new look-up table. As the infor-mation from one image is not sufficient, there may be big gaps in this look-up table. These gaps are smoothed by applying a convolution with a Gaussian kernel. To save time, each color component is processed separately. At the end of this step, we obtain a specialized look-up table for the current video.
The general look-up table and the new specialized look up table are combined by weighted averaging of the two tables. The speaker is given more weight in the weighted averaging. This way, we eliminate improbable colors from the general look up table thus improving its effectiveness. Some examples of adapted look-up tables can be seen in Fig.13.
4.1.3. Segmentation
The segmentation is straightforward. We compare the color of each pixel with the value in the look-up table and decide whether it belongs to the skin segment or not. For better performance, we blur the resulting probability image. That way, the segments with low probability disappear and the low probability regions near the high probability regions are strengthened. For each frame, we create a mask of skin color segments by threshold-ing the probability image (See Fig. 14) to get a binary image that indicates skin and non-skin pixels.
Figure 14: The process of image segmentation. From left to right: original image, probability of skin color blurred for better performance, binary image as a result of thresholding, original image with applied mask.
4.2. Hand and face tracking
The movement of the face and the hands is an important feature of sign language. The trajectory of the hands gives us a good idea about the performed sign and the position of the head is mainly used for creating a local coordinate system and for nor-malizing the hand position.
From the resulting bounding rectangle of the face detector [16] we fit an ellipse around the face. The center of the ellipse is assumed to be the center of mass of the head. We use this point as the head’s tracked position.
For hand tracking, we aim to retrieve the hands from the skin color image as separate blobs [17]. We define a blob as a connected component of skin color pixels. However, if there are skin color-like parts in the image, the algorithm retrieves some blobs which do not belong to the signer. That means the blob is neither the signer’s head nor the signer’s hand. These blobs should be eliminated for better performance.
4.2.1. Blob filtering
We eliminate some of the blobs with the following rules:
• The hand area should not be very small. Eliminate the blobs with small area.
• Head and the two hands are the three biggest blobs in the image, when there is no occlusion. Use only the three biggest blobs.
• Eliminate blobs whose distances from the previous posi-tions of already identified blobs exceeds a threshold. We use a multiple of the signer’s head width as threshold.
4.2.2. Occlusion prediction
We apply an occlusion prediction algorithm as a first step in occlusion solving. We need to predict whether there will be an occlusion and among which blobs will the occlusion be. For this purpose, we use a simple strategy that predicts the new position, pt+1, of a blob from its velocity and acceleration. The velocity
and acceleration are calculated using:
vt = pt−pt−1 (5)
at = vt−vt−1 (6)
pt+1 = pt+vt+ 0.5∗at (7)
The size of the blob is predicted with the same strategy. With the predicted positions and sizes, we check whether these blobs intersect. If there is an intersection, we identify the inter-secting ones and predict that there will be an occlusion between those blobs.
4.2.3. Occlusion solving
We solve occlusions by first finding out the part of the blob that belongs to one of the occluding objects and divide the blob into two parts (or three in the case that both hands and head are in occlusion). Thus we always obtain three blobs which can then be tracked (unless one of the hands is out of the view). Let us describe the particular cases of occlusion.
Two hands occlude each other. In this case we separate the combined blob into two blobs with a line. We find the bounding ellipse of the blob of the occluded hands. The minor axis of the ellipse is computed and a black line is drawn along this axis, forming two separate blobs (see Fig. 15). This approach only helps us to find approximate positions of the hand blobs in case of occlusion. The hand shape information on the other hand is error-prone since the shape of the occluded hand can not be seen properly.
Figure 15: An example of hand occlusion. From left to right: original image, image with the minor axis drawn, result of track-ing.
One hand occludes the head. Usually the blob of the head is much bigger than the blob of the hand. Therefore the same strategy as in the two-hand-occlusion case would have an un-wanted effect: there would be two blobs with equal sizes. In-stead, we use a template matching method [18] to find the hand template, collected at the previous frame, in the detected blob region. The template is a gray scale image defined by the hand’s bounding box. When occlusion is detected, a region around the previous position of the hand is defined. We calculate the corre-lation
R(x, y) =X
x′
X
y′
(T(x′, y′)−I(x+x′, y+y′))2
(8)
whereT is the template,Iis the image we search in,xandy are the coordinates in the image,x′andy′are the coordinates in the template. We search for the minimum correlation at the
intersection of this region and the combined blob where the oc-clusion is. We use the estimated position of the hand as in Fig. 16. The parameters of the ellipse are taken from the bounding ellipse of the hand. As a last step we collect a new template for the hand.
Figure 16: An example of hand and head occlusion. From left to right: original image, image with the ellipse drawn, result of tracking.
Both hands occlude the head. In this case, we apply the template matching method, as described above, to each of the hands.
4.2.4. Tracking of hands
The tracking starts by assuming that, for the first time a hand is seen, it is assigned as the right hand if it is on the right side of the face and vice versa for the left hand. This assumption is only used when there is no hand in the previous frame.
After the two hands are identified, the tracking continues by considering the previous positions of each hand. We always assume that the biggest blob closest to the previous head posi-tion belongs to the signer’s head. The other two blobs belong to the hands. Since the blobs that are far away from the previous positions of hands are eliminated at the filtering step, we either assign the closest blob to each hand or if there are no blobs, we use the previous position of the corresponding hand. This is ap-plied to compensate the mistakes of the skin color detector. If the hand blob can not be found for a period of time (i.e half a second), we assume that the hand is out of view.
4.3. Feature extraction
Features need to be extracted from processed video sequences [19] for later stages such as sign recognition, or clustering. We choose to use the hand position, motion and simple hand shape features.
The output of the tracking algorithm introduced at the pre-vious section is the position and a bounding ellipse of the hands and the head during the whole video sequence. The position of the ellipse in time forms the trajectory and the shape of the ellipse gives us some information about the hand or head ori-entation. The features extracted from the ellipse are its cen-ter of mass coordinates, x, y, width,w, height,a, and the an-gle between ellipse’s major axis and the x-axis, a. Thus, the tracking algorithm provides five features per object of interest, x, y, w, h, a, for each of the three objects, 15 features in total.
Gaussian smoothing of measured data in time is applied to reduce noise. The width of the Gaussian kernel is five, i.e. we calculate the smoothed value from two previous, present and two following frames.
6350 6400 6450 6500 6550 Left hand features behaviour in time
Figure 17:Smoothed features - example on 10 seconds sequence of four left hand features (x and y position, bounding ellipse width and height)
new origin and scaling. Figure18shows the trajectories of head and the hands in the normalized coordinate system for a video of four seconds.
Head and hands trajectories - 4 seconds
X
Y
left hand right hand head
Figure 18:Trajectories of head and hands in normalized coor-dinate system
The coordinate transformations are calculated for all 15 fea-tures, which can be used for dynamical analysis of movements. We then calculate differences from future and previous frames and include this in our feature vector:
ˆ
In total, 30 features from tracking are provided, 15 smoothed features obtained by the tracking algorithm and 15 differences.
4.4. Alignment and Clustering
The sign news, which contains continuous sign speech, was split into isolated signs by a speech recognizer (see Fig. 19). In the case the pronounced word and the performed sign are shifted, the recognized borders will not fit the sign exactly. We have ex-amined that the spoken word usually precedes the corresponding
sign. The starting border of the sign has to be moved backwards in order to compensate for the delay between speech and sign-ing. A typical delay of starting instant is about 0.2 seconds back-wards. In some cases, the sign was delayed against the speech, so it’s suitable to move the ending instant of the sign forward. To keep our sequence as short as possible, we shifted the end-ing instant about 0.1 second forward. If we increase the shift of the beginning or the ending border, we increase the probability that the whole sign is present in the selected time interval, at the expense of including parts of previous and next signs into the interval.
Figure 19: Timeline with marked borders from the speech rec-ognizer
4.4.1. Distance Calculation
We take two signs from the news whose accompanying speech segments were recognized as the same word. We want to find out whether those two signs are the same or are different, in case of homonyms or mistakes of the speech recognizer. For this purpose we use clustering. We have to consider that we do not know the exact borders of the sign. After we extend the borders of those signs, as described above, the goal is to calculate the similarity of these two signs and to determine if they are two different performances of the same sign or two totally different signs. If the signs are considered to be the same, they should be added to the same cluster.
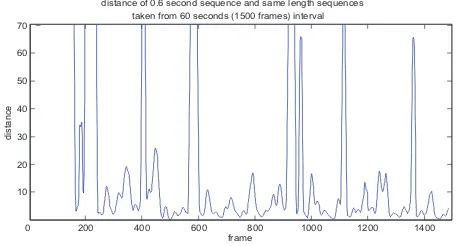
We have evaluated our distance calculation methodology by manually selecting a short query sequence, which contains a single sign and searching for it in a longer interval. We cal-culate the distance between the query sequence and other equal-length sequences which were extracted from the longer inter-val. Fig. 20 shows the distances between a 0.6 second-long query sequence and the equal-length sequences extracted from a 60 seconds-long interval. This way, we have extracted nearly 1500 sequences and calculated their distances to the query se-quence. This experiment has shown that our distance calcula-tion has high distances for different signs and low distances for similar signs.
200 400 600 800 1000 1200 1400
10 distance of 0.6 second sequence and same length sequences
0
Figure 20: Distance calculation between 0.6 seconds query se-quence and equal-length sese-quences taken from 60 seconds in-terval
features (width and height of fitted ellipse) and approximate derivatives of all these features. We calculate the distance of two equal-length sequences as the mean value of squared differ-ences between corresponding feature values in the sequdiffer-ences. If we consider the feature sequence, represented as matrixS, wheres(m, n)is the n-th feature in the m-th frame,S1andS2
represent two compared sequences,Nis number of features and Mis number of frames, then the distance is calculated as:
D(S1, S2) = 1
M N
M
X
m=1
N
X
n=1
(s1(m, n)−s2(m, n))2 (11)
The squared difference in Equation11suppresses the in-crease in the distance for small differences on one hand and em-phasizes greater diferences on the other.
Inspired by the described experiment with searching for short query sequence in longer interval, we extended the distance cal-culation for two different-length sequences. We take the shorter of the two compared signs and go through the longer sign. We find the time position where the distance between the short sign and the corresponding same-length interval from the longer sign is the lowest. The distance from this time position, where the short sign and part of the longer sequence fit best, is considered as the overall distance between the two signs.
We solve the effect of changes of the signing speed in the following way: when the speed of the two same signs is dif-ferent, the algorithm suppresses small variations and empha-sizes larger variations as described before, so that the signs are classified into different clusters. This feature is useful when the desired behaviour is to separate even the same signs which were performed at different speeds. Other techniques can be used, such as multidimensional Dynamic Time Warping (DTW), which can handle multidimensional time warped signals. An-other approach for distance calculation and clustering is to use a supervised method, such as Hidden Markov Models (HMM). Every class (group of same signs) has one model trained from manually selected signs. The unknown sign is classified into a class which has the highest probability for features of the un-known sign. In addition, HMM can recognize sign borders in the time interval and separate it from parts of previous and fol-lowing signs which can be present in the interval. We plan to use a supervised or a semi-supervised approach with labelled ground truth data but currently we leave it as future work.
4.4.2. Clustering
To apply clustering for multiple signs, we use the following method:
1. Calculate pairwise distances between all compared signs; store those distances in an upper triangular matrix
2. Group the two most similar signs together and recalculate the distance matrix. The new distance matrix will have one less row and column and the scores of the new group is calculated as the average of the scores of the two signs in the new group.
3. Repeat step 2. until all signs are in one group
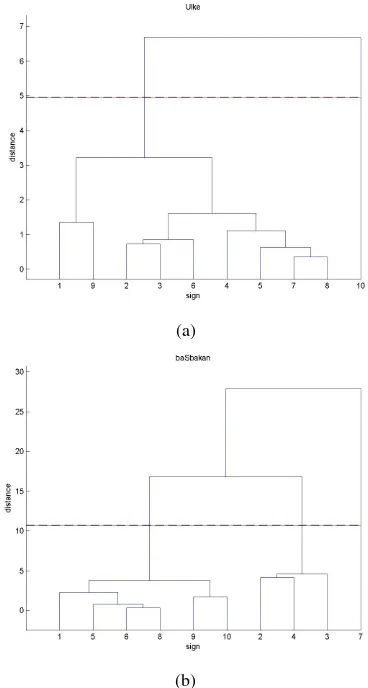
4. Mark the highest difference between two distances, at which two signs were grouped together in previous steps, as the distance up to which the signs are in the same clus-ter (see Fig.21).
We set the maximum number of clusters to three: one clus-ter for the main sign, one clusclus-ter for the pronounciation differ-ences or the homonyms, and one cluster for the unrelated signs, due to mistakes of the speech recognizer, or the tracker.
Figure21 shows the dendograms for two example signs, ‘¨ulke” and ‘bas¸bakan”. For sign ‘¨ulke”, nine of the retrievals are put into the main cluster and one retrieval is put into another cluster. That retrieval is a mistake of the speech recognizer and the sign performed is completely different from the others. The clustering algorithm correctly separates it from the other signs. For sign ‘bas¸bakan”, three clusters are formed. The first cluster is the one with the correct sign. The four retrievals in the second and third clusters are from a single video where the tracking can not be performed accurately as a result of bad skin detection. The two signs are shown in Figure22.
(a)
(b)
Figure 21: Dendogram - grouping signs together at different distances, for two example signs (a) ‘¨ulke”, and (b) ‘bas¸bakan”. Red line shows the cluster separation level.
5. SYSTEM ASSESMENT
The performance of the system is affected by several factors. In this section we indicate each of these factors and present perfor-mance evaluation results based on ground truth data.
We extracted the ground truth data for a subset of 15 words. The words are selected from the most frequent words in the news videos. The speech retrieval system retrieves, at most, the best 10 occurences of the requested word. For each word we anno-tated each retrieval to indicate whether the retrieval is correct, whether the sign is contained in the interval, whether the sign is a homonym or a pronounciation difference, and whether the tracking is correct.
(a)
(b)
Figure 22:Two example signs (a) ‘¨ulke”, and (b) ‘bas¸bakan”.
Table 4:System performance evaluation
% # of
Accuracy Retrievals Yes No
Correct retrieval 91.8 146 134 12
Correct tracking 77.6 134 104 30
Interval contains 51.5 134 69 65
Ext. interval contains 78.4 134 105 29
two of them where we retrieve eight occurences. Among these 146 retrievals, 134 of them are annotated as correct, yielding a 91.8% correct retrieval accuracy for the selected 15 words. The summary of the results can be seen in Table4.
In 51.5% of the correct retrievals, the sign is contained in the interval. However, as explained in Section4.4, prior to sign clustering, we extend the beginning and the end of the retrieved interval, 0.2 seconds and 0.1 seconds respectively, in order to increase the probability of containing the whole sign. Figure23 shows the sign presence in the retrieved intervals. The number of retrievals that contain the sign when the interval is extended in different levels is also shown. If we consider these extended intervals, the accuracy goes up to 78.4%.
The tracking accuracy is 77.6% for all of the retrievals. We consider the tracking is erroreneus even if one frame in the in-terval is missed.
Figure 23: Sign presence in the spoken word intervals. Most of the intervals either contain the sign or the sign preceeds the spoken word by 0.2-0.3 seconds
The clustering accuracy for the selected signs is 73.3%. This is calculated by comparing the clustering result with the ground truth annotation. The signs that are different from the signs in the other retrievals should form a separate cluster. In 7.5% of the correct retrievals, the performed sign is different from the other signs, which can be either a pronounciation difference or a sign homonym. Similarly, if the tracking for that sign is not correct, it can not be analyzed properly and these signs should be in a different cluster. The results show that the clustering per-formance is acceptable. Most of the mistakes occur as a result of the insufficient hand shape information. Our current system uses only the width, the height and the angle of the bounding ellipse of the hand. However this information is not sufficient to discriminate different finger configurations, or orientations. More detailed hand shape features should be incorporated into the system for better performance.
6. APPLICATION AND GUI
The user interface and the core search engine are separately lo-cated and the communication is done via TCP/IP socket con-nections. This design is also expected to be helpful in the future since a web application is planned to be built using this service. This design can be seen in the Fig.24.
Figure 24:System Structure
In Fig. 25, the screenshot of the user interface is shown. There are five sections in it. The first is the ‘Search” section where the user inputs a word or some phrases using the letters in the Turkish alphabet and sends the query. The application communicates with the engine on the server side using a TCP/IP socket connection, retrieves data and processes it to show the results in the ‘Search Results” section. Each query and its results are stored with the date and time in a tree structure for later referral. A ‘recent searches” menu is added to the search box aiming to cache the searches and to decrease the service time. But the user can clear the search history to retrieve the results from the server again for the recent searches. The relevance of the returned results (with respect to the speech) is shown using stars (0 to 10) in the tree structure to inform the user about the reliability of the found results. Moreover, the sign clusters are shown in parentheses, next to each result.
Figure 25:Screenshot of the User Interface
addition to video display, the ‘Properties” section informs the user about the date and time of the news, starting time, duration and the relevance of the result. ‘Player Controls” and ‘Options” enable the user to expand the duration to left/right or adjust the volume/speed of the video to analyze the sign in detail. Apart from using local videos to show in the display, one can uncheck ‘Use local videos to show” and use the videos on the web. But the speed of loading video files from the web is not satisfactory since the video files are very large.
7. CONCLUSIONS
We have developed a Turkish sign dictionary, Signiary, which can be used as tutoring videos for novice signers. The dic-tionary is easy to extend by adding more videos and provides a large vocabulary dictionary with the corpus of the broadcast news videos. The application is accessible as a standalone ap-plication, from our laboratory’s web site [20] and will soon be accessible from the Internet.
Currently, the system processes the speech and the sliding text to search for the given query and clusters the results by pro-cessing the signs that are performed during the retrieved inter-vals. The clustering method uses only hand tracking features and simple hand shape features. For better clustering, we need to extract detailed hand shape features since for most of the signs hand shape is a discriminating feature. Another improvement that we leave as a future work is the sign alignment. The system directly attempts to cluster the signs with a very rough align-ment. Further detailed alignment is needed since the speed of the signs and their synchronization with the speech may differ.
8. ACKNOWLEDGMENTS
This work was developed during the eNTERFACE’07 Summer Workshop on Multimodal Interfaces, Istanbul, Turkey and sup-ported by European6th
FP SIMILAR Network of Excellence, The Scientific and Technological Research Council of Turkey (TUBITAK) project 107E021, Bogazici University project BAP-03S106 and the Grant Agency of Academy of Sciences of the Czech Republic, project No. 1ET101470416.
We thank Pınar Santemiz for her help in extracting ground truth data that we use for system assessment.
9. REFERENCES
[1] U. Zeshan, “Sign language in Turkey: The story of a hid-den language.”,Turkic Languages, vol. 6, no. 2, pp. 229– 274, 2002.1
[2] U. Zeshan, “Aspects of Turk isaret dili (Turkish sign language)”, Sign Language & Linguistics, vol. 6, no. 1, pp. 43–75, 2003.1
[3] L. R. Rabiner and M. Sambur, “An algorithm for deter-mining the endpoints of isolated utterances”,Bell System Technical Journal, vol. 54, no. 2, 1975.2
[4] E. Arisoy, H. Sak, and M. Saraclar, “Language Modeling for Automatic Turkish Broadcast News Transcription”, in Proc. Interspeech, 2007.2,3
[5] “HTK Speech Recognition Toolkit”. http://htk. eng.cam.ac.uk.2
[6] “AT&T fsm & dcd tools”. http://www.research. att.com.2
[7] M. Saraclar and R. Sproat, “Lattice-based search for spo-ken utterance retrieval”, inHLTNAACL, 2004.2,3 [8] C. Allauzen, M. Mohri, and M. Saraclar, “General
indexa-tion of weighted automata- applicaindexa-tion to spoken utterance retrieval”, inHLTNAACL, 2004.3
[9] S. Parlak and M. Saraclar, “Spoken term detection for Turkish broadcast news”, inICASSP, 2008.3
[10] N. Otsu, “A threshold selection method from gray-level histograms”,IEEE Trans. Systems, Man, and Cybernetics, vol. 9, no. 1, pp. 62–66, 1979.4
[11] J. D. Tubbs, “A note on binary template matching”,Pattern Recognition, vol. 22, no. 4, pp. 359–365, 1989.5 [12] E. Brill, “Transformation-based error-driven learning and
natural language processing: a case study in part-of-speech tagging”,Computational Linguistics, vol. 21, no. 4, pp. 543–565, 1995.5
[13] G. Ngai and R. Florian, “Transformation-based learning in the fast lane”, inNAACL 2001, pp. 40–47, 2001.5 [14] V. Vezhnevets, V. Sazonov, and A. Andreeva, “A survey
on pixel-based skin color detection techniques”, in Graph-icon, pp. 85–92, 2003.6
[15] Y. Raja, S. J. McKenna, and S. Gong, “Tracking and segmenting people in varying lighting conditions using colour”, inIEEE International Conference on Face and Gesture Recognition, Nara, Japan, pp. 228–233, 1998.6 [16] “OpenCV, intel Open source Computer Vision Library”.
http://opencvlibrary.sourceforge.net/.7
[17] “OpenCV Blob extraction library”. http: //opencvlibrary.sourceforge.net/
cvBlobsLib.7
[18] N. Tanibata, N. Shimada, and Y. Shirai, “Extraction of hand features for recognition of sign language words”, in In International Conference on Vision Interface, pp. 391– 398, 2002.8
[19] S. Ong and S. Ranganath, “Automatic sign language anal-ysis: A survey and the future beyond lexical meaning”, IEEE Trans. Pattern Analysis and Machine Intelligence, vol. 27, no. 6, pp. 873–891, 2005.8