RELATIONSHIP BETWEEN PARENTS, PEER, LECTURER
ATTACHMENT AND ISLAMIC RESILIENCY AMONG
UNIVERSITY PUTRA MALAYSIA STUDENTS
HANINA HALIMATUSAADIAH HAMSAN Email : [email protected]
Faculty of Human Ecology, University Putra Malaysia
Abstract
The main purpose of this study is to determine the relationship between parents, peer, lecturer attachment and resiliency among UPM students. Three factors which are parents, peer and lecturer attachment have been studied about their relationship with resiliency. A total of 397 undergraduates students in UPM were selected through convenience sampling as respondents in this study. Inventory of Parents and Peer Attachment (Armsden and Greenberg, 1987) was used to measure the level of parents and peer attachment, followed by Inventory of Teacher-Student Relationships (Murray and Zvoch, 2011) to measure the level of lecturer attachment and Adolescent Resilience Scale (Oshio, Kaneko, Nagamine & Nakaya, 2003) to assess the level of students’ resiliency. The results of this study show that most of the respondents perceived moderate level of resiliency (M = 78.18; SD = 7.697), peer attachment (M = 101.27; SD = 13.283) and lecturer attachment (M = 45.46; SD = 9.096), and high level of parents attachment (M = 103.22; SD = 11.495). The findings revealed that there was significant relationship between parents attachment (r = 0.434; p = 0.000), peer attachment (r = 0.455; p = 0.000), lecturer attachment (r = 0.495; p = 0.000) and resiliency. The result from the study shows that the importance of improving the level of resiliency among the students in university is increasing the attachment to students’ parents, peer, and lecturer in order to become the good student in the life.
Key word: Peer, Lecturer Attachment, Islamic Resiliency
BACKGROUND OF STUDY
Students’ lives in college are easy for them to study in campus however they should stay far away from their parents and relatives. Some of students only back home during the university’s holiday and the relationship between students with their parents mostly can only maintain through phone calling, message, and also online services. So there are lots of times of the students were spend in their university’s life.
According to Black & Schutte (2006), more secure parental attachments of the students were more trusting of romantic partners. Except the parents, students have to trust their friends and lecturer in university. Thus, friends and lecturers become the individuals who frequently have most interact active between each other (Bronfenbrenner's 1979).
difficult or painful in their daily life (Takahira, 1998). For example, according Takahira (1998) had found that changes in student environment from high school to university environment, academic stress, the social competence such as the way to communicate and interact with people, problem between friends or romantic partners and so on. Although there are not serious events and problem compare with the victims in Japanese but it also can cause the individuals felt stress if they do not have the resiliency skills. Individuals are not considered to have displayed resilience if there has never been a significant threat to their development. There must be current or past risk factors judged to have the potential to disrupt development (Toland & Carrigan, 2011). So this is vital for the students if they able coping their stress and overcome their problem and negative events, then their resiliency level also will increase.
Resilience is used to overcome the adversity by express more appropriately the relative and dynamic nature of the processes happening over time that are involved (Toland & Carrigan, 2011). Resilience needed of the individuals is important in order to help the individuals to achieve human life satisfaction. Resilience help the individuals become stronger and enable to help overcome the risk factors (Twemlow & Bennett, 2008). Besides, high resilience level also can help the victims who are involved in the war, natural disaster and also trauma (Peres, Moreira-Almeida, Nasello, & Koenig, 2007). Victims in Japanese need a high level of resilience to help them face the problem such as lose their home and their family which
cause by earthquake and tsunami on 2011. Nowadays, many of students have faced more stressful problem that may influence their psychology. According Rutter (1987), the concept of resilience was originally developed by studying the positive adaptation of children under adverse circumstances. Thus, without strength in resiliency, they must felt suffer, stress and anxious, then cause the society inharmonic. How the individuals increase or to have resilience in order to achieve life satisfaction? Social support can be the most important protective factors to help the students to adapt in risk (Ahern, 2006). The term of social support include the students’ family, friends, communities, and so on. They are able to help the students by give support and trust to the students when have the risk factors. Attachment is the base to protect the students in order to feel secure in the environment. According to attachment theory, individuals’ attachment start when child develops and more common to their mother and father (Bowlby, 1951) to felt the secure from their environment. So, the students who attach to their social supporter will help them to increase their resilience level. According Bronfenbrenner's (1979) ecological systems theory, micro system settings include home, peer group, school and community which afforded particular kinds of protective processes and factors. University students’ micro system is their friends, family, lecturer, and community. Thus attachment to their micro system is the main factors to get the protective factor in resilience.
parents, peer, lecturer attachment and resiliency among the UPM students. More literature review will show that have relationship between resilience and attachment. The most important thing to do this study is to help student in university know about the important of resilience to achieve the good life satisfaction by attachment to their micro system such as family, friends, communities and so on.
STATEMENT OF PROBLEM
Resilience is dynamic concept which sees the quality of an individual’s adaptation as resulting from interactive processes between factors operating at the level of individuals, families, school, communities and changing circumstances (Twemlow & Bennett, 2008, Wiliams & Drury, 2009). The university students who start transit their environment which is from secondary school to university may confront with the variety of challenges and problems. So the resiliency level of the student in university is important to overcome challenges and problems, and help to adapt in their university life compared with those are non-resilient students. Resilience helps to overcome the negative effect of the individuals (Ahern, 2006). Through the attachment with parents, peer, and lecturer, the students can increase their resiliency level (Skinner et al., 2009, Chassin, Carle, Nissim-Sabat, & Kumpfer, 2004, Ahern, 2006, Zhan & Le, 2005, Hall 2007). Thus, the students can increase their attachment to the persons who have close relationship with them. However, the students who unable to get the attachment from the parents, peer, and lecturer may easily feel helpless,
stressful and anxious in adapt their university’s life events.
This study aims to determine the relationship between parents, peer, and lecturer attachment with resiliency among students in UPM. Specifically, this study will identify personal characteristic (gender, age, number of sibling, CGPA, credit hours) and parents characteristic (education level, income level) that related to parents, peer and lecturer attachment with resilience. In addition, the relationship between personal characteristic and parents’ characteristic with resilience will determine. In summary, there have five research questions to be addressed in present study:
1. To describe personal characteristic and parents characteristic among the UPM students.
2. To describe the level of resiliency among the UPM students.
3. To describe the level of parents, peer, and lecturer attachment of the UPM students.
4. To determine the relationship between parents attachment and resiliency among the UPM students. 5. To determine the relationship
between peer attachment and resiliency among the UPM students. 6. To determine the relationship
between lecturer attachment and resiliency among the UPM students.
THEORY
among the UPM students. The findings of this study have provided the useful information for the government, university, lecturer, and also students themselves.
The significances of this study are help to understand the importance of students’ parents, peer, lecturer attachment and resiliency. The empirical data and literature review are the importance contribution to the Human Development and Management course and it become the sources for the course about resiliency, the relationship between parents attachment and resiliency, the relationship between peer attachment and resiliency, and the relationship between lecturer attachment and resiliency.
Second of the significance of present study is to increase the awareness to the public about the importance of students’ attachment to their parentss, peer, lecturer and resiliency. Government can know the resiliency level of the students through this research findings then come out some campaigns or activities to deliver the message around the country. Through the campaigns, it can increase the parents’s awareness about the importance of resiliency among their children.
Thirdly, this study help the university know the level of parents, peer, lecturer attachment and resiliency among the UPM students in order to help the students to increase their resiliency level by implement the appropriate program and seminar to the students. Besides, the lecturer of the university may know about the students’ resiliency level and parents, peer, lecturer
attachment level which can help the lecturers use the suitable teaching behavior to their students.
Last but not least, this study is able to help the students know their resiliency level and realize that the important of resiliency when adapt in the new environment. Through this study, the students may understand more about the ability for them to overcome the challenges and negative events during the university life. In addition, parents, peer and lecturer attachment of the students can be examined in order to let the students to know how importance of those variables may influence the students’ resiliency level.
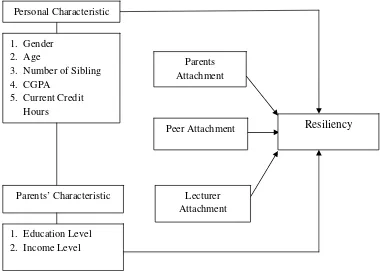
Figure 1: The conceptual framework of the relationship between parents, peer, and lecturer attachment with resiliency among the University Putra Malaysia students
Definition of Terminology
1. Parents Attachment
Conceptual: As a stable connection that provides a feeling of safety and security for the child (Bowlby 1982). Operational: Respondent’s total score
adopt from Inventory of Parents and Peer Attachment by Armsden and Greenberg (1987). 2. Peer Attachment
Conceptual: Peers taking on a dominant influence in a child’s life (Maté & Neufeld, 2004).
Operational: Respondent’s total score adopt from Inventory of Parents and Peer Attachment by Armsden and Greenberg (1987). 3. Lecturer Attachment
Conceptual: Student-teacher relationship such the relationships are linked to behavioural competence and better school (Pianta, Steinberg & Rollins, 1995).
Operational: Respondent’s total score adopt from Inventory of Teacher-Student
Personal Characteristic
Parents Attachment 1. Gender
2. Age
3. Number of Sibling 4. CGPA
5. Current Credit Hours
Peer Attachment Resiliency
Lecturer Attachment Parents’ Characteristic
Relationship (IT-SR) by Murry and Zvoch (2011). 4. Resiliency
Conceptual: The process of, capacity for, or outcome of
successful adaption despite challenging or threatening
circumstances (Masten, Best, & Garmezy 1990). Operational: Respondent’s total score
adopt from Adolescent Resilience Scale by Atsushi Oshio, Hitoshi Kaneko, Shinji Nagamine and Motoyuki
Nakaya(2003).
Resiliency among College Students
The concept of resilience was originally developed by studying the positive adaptation of individual under adverse circumstances (Rutter, 1987). Thus, the nature of individual’s family, peer, school, and employment relationships, the life events we experience, and the nature of their attachments are important formative elements (Williams & Drury, 2009).
Resilience can be viewed both as an outcome, emotional well-being against the odds, and a process, adaptability in the face of adversity. It also can identify into two sets of factors here: the external factors, which can create adversity or alternatively provide support and protection and the intrinsic factors which incline the individual either to vulnerability or resilience. Extrinsic factors are known to include at least one secure attachment relationship which access to wider supports such as extended family and friends, and positive nursery, school or community
experiences. Intrinsic factors include a sense of security where the child feels loved, a healthy self-esteem and a sense of agency or self-efficacy (Miller & Daniel, 2007).
Resilience applies at the individual level and at the systems level—there is simply no dichotomy between individual work and systems work (Toland & Carrigan, 2011). Students adapted themselves in university life by applied their resiliency skills to the challenges and problem that had faced in university. In resiliency, it represents the interaction between risk factors (vulnerability) and protective resources (protection) (Rew & Horner, 2003). The protective factors were different in many cases, those factors acted as a buffering agent to minimize the negative outcomes (Ahern, 2006). For example, students who get the support from their parents and friends can help them continue to face to the challenges. Risk factors are those that render an individual more likely to develop problems in the face of adversity. Protective factors are those that act to protect an individual from developing a problem even in the face of adversity and risk factors. Protective factors and individual resilience suggest that as long as the balance between stressful life events and protective factors is favourable (Twemlow & Bennett, 2008).
or past risk factors judged to have the potential to disrupt development (Toland & Carrigan, 2011). The students in university may increase their resiliency skills when they felt that they unable to adapt themselves in university’s life and system. Many challenges and problem come out lead to students increase their resiliency skills.
Resilience is a dynamic concept which sees the quality of an individual’s adaptation as resulting from interactive processes between factors operating at the level of individuals, families, schools, communities and changing circumstances ( Twemlow & Bennett, 2008, Williams & Drury, 2009). Students in university have to face the changing environment which is from high school change to university because their social environment may different and they had to adapt themselves with university system of study. Students who felt more positive about adult and peer relationships and networks; felt connected to adults, peers, and the school; and were able to act independently or autonomously in those settings had much higher self-rated resilience than students who did not (Twemlow & Bennett, 2008).
Adolescent resilience can be defined as the process of adaptation to risk that incorporates personal characteristics, family and social support, and community resources. Adolescent resilience also can be conceptualized as a composite of attributes, including characteristics of the adolescent, sources of social support, and available resources (Ahern, 2006). The services that offered to young people by psychosocial-oriented community based organizations play an important role in
helping to foster robust resilience in young people who live in adverse circumstances. In the process, an important first connection is made between individual resilience concepts that are rooted in developmental psychology, and the new concept of ‘multi-layered social resilience’ rooted in social science that looks at how resilience operates on different layers and social fields (individuals, families, neighbourhoods, communities, nations, and so on) (Henley, 2010).
A past research findings show that girls were four times more likely to meet the criteria for resilience the boys, primarily because of higher rates of criminal charges among the boys (Skinner, Haggerty, Fleming, & Catalano, 2009). The logistic regression models showed associations between negative self esteem and risky behavior remains statistically significant only among boys. Negative self esteem seems to play an important role regarding smoking and cannabis use among boys. Among girls it leads more often to depression, anxiety and other internalizing symptoms whereas among boys it leads mostly to the problem behavior and other externalizing indications (Veselska, Geckova, Orosova, Gajdosova, Dijk, & Reijneveld, 2009). Besides, previous research also found that females showed higher levels of stress and lower levels of resilience than males did (Ming-Hui, 2008).
stress, higher resilience and higher life satisfaction than failure students. It seems that the result is due to neglect of the school and parents to poor students and lack of appropriate assistance to them (Abolghasemi, & Varaniyab, 2010). Thus, university have to implicate some program to the students in order to increase their resiliency level and achieve life satisfaction when study in university.
Research on children notes the importance of a significant parental or adult role model. However, specific ideologies that help adults cope have also been shown to perpetuate hatred and civil conflict. Successful adaptation is possible even for children who live in high risk conditions (Twemlow & Bennett, 2008). Therefore, programmes need to engage not only the child but also the family and the community (Mcadam-Crisp, 2006). Studies of resilience during childhood examine domains of functioning, which represent stage-salient developmental tasks including emotional regulation, formation of secure attachment relationships, peer relations, and successful school performance (Walsh, Dawson, & Mattingly 2010). The students who have the experience in attachment to their parent and friends during childhood can help them overcome some negative events in their memory, such as had a car accident in childhood cause the students afraid to drive car in future.
Relationship between Parent Attachment and Resiliency
Bronfenbrenner’s (1979, 1989), bio-ecological systems model of development is the appropriate one for
guiding the understanding of the complex structures and interactions that shape human development across time and contexts. In the model, the developing of child with its own biology is located within many inter-related micro-systems such as family, school, peer groups, neighbourhood, and the macro-systems of the wider societal context.
Resilience research indicates that during the early childhood years, it is important for children to have good quality of care and opportunities for learning, adequate nutrition and community support for families, to facilitate positive development of cognitive, social and self-regulation skills (Masten & Gewirtz, 2006). In early childhood, children have the protections afforded by attachment bonds with competent and loving caregivers, the stimulation and nutrition required for healthy brain development, opportunities to learn and experience the pleasure of mastering new skills, and the limit-setting or structure needed to develop self-control (Masten & Gewirtz, 2006).
life satisfaction (Perrone, Webb, & Jackson, 2007).
Adolescents were more secure with mother than with father, and most dismissive and fearful with father (Doyle, Lawford, & Markiewicz, 2009). Parents, peers, and other people in the immediate Microsystems in which children live their daily lives will serve as first responders in the immediate aftermath of disaster. Under perceived threat, humans and other social species in attachment relationships will seek proximity with each other for comfort and protection (Masten & Obradovic, 2008). That is important for the individuals who are in distress because they need protection by attachment to the person which they trust most and then increase their resilience level. Family interactions and a general optimistic attitude are at the heart of weaving a strong and unique tapestry of resilience as families continue to love and support each other through normative and unexpected challenges. Children seem to do better when there is a fit between the temperament, personality, and needs of the children and the style of parenting they receive (Black & Lobo, 2008). A findings suggest that early intervention with families with opiate-dependent parents to prevent and reduce internalizing and externalizing problems in their children holds the most promise of supporting resilient adaptation in early adulthood (Skinner et al., 2009).
A difference in the average level of distress reported or attachment–distress associations between individuals who chose a peer network compared to individuals who chose a family network. Have a findings suggest that individuals
remain with their family because they hold positive views of some family members, in particular mothers, and report that they are trustworthy and available in times of distress. Besides, individuals may shift to peers because they hold negative views of their family, for example high attachment avoidance with mother or father, and report that they are unavailable, distrustful, rejecting, and uncaring in times of distress (Pitman & Scharfe, 2010).
When asked about the impact of parental attachment on parenting satisfaction, the most frequent types of responses indicated a positive effect. According to a research, many participants described how their parents were positive role models for child rearing and how their relationship with their parents helped them forge positive relationships with their own children. However, some individuals stated that they wanted to parent differently than they were parented. Thus, it seems that some parents imparted a model to emulate and others provided a model to oppose (Perrone et al., 2007).
The significance of attachment theory for African American ACOAs is that it stresses the nature of alternative and multiple attachments found in the African American family system. These attachment relationships have been proven to be significant in the development of resilience (Hall, 2007). So this evidence show there has relationship between attachments with resilience. Quality of attachment is instrumental in the four central areas associated with resilience, individual characteristics, supportive family, positive connections with adults or agencies in the environment, and culture (Atwool, 2006).
Bowlby (1973) to describe attachment patterns laid down in infancy and childhood as becoming more resistant to change by adolescence, and as generalizing to other close relationships. Adolescence familiar with their circumstance since they interact with the world in early age and it is difficult for them to change and adapt in new environment when grow up.
There also findings revealed a significant association between lower levels of anxiety and higher-quality relationships with the female caregiver, a greater number of close friendships, and higher self-esteem. Less frequent physically aggressive behaviors were associated with a smaller number of primary caregivers, higher-quality relationships with the female caregiver, a greater number of close friendships, higher self-esteem, greater use of approach coping strategies, and less frequent use of avoidant coping strategies. The results suggest a slightly different pattern of factors associated with internalizing and externalizing
behaviors (Legault, Anawati, & Flynn, 2006).
Relationship between Peer Attachment and Resiliency
Attachment to mother only tends to serve as a prototype for later extra-familial attachments with romantic partners, with father attachment playing a stronger role in peer attachments, and peer attachment a stronger role in romantic relationships (Doyle et al., 2009). Peer show as important part of individuals when they start interact with the person who their family member biologically. Besides romantic relationships only will occur when the individuals feel secure and then attach to their friends. Moreover, girls reported more fearful attachment with romantic partners and tended to report less romantic security than boys. That is, girls endorsed more desire for romantic closeness, but also more difficulty in fully trusting or depending on their partner for fear of being hurt (Doyle et al., 2009). It show there have different between gender with their attachment style toward their friends.
There was also evidence show that close friends and romantic partners were becoming attachment figures: although close friends were most often sought for proximity and safe haven, with increasing age romantic partners were more frequently used as a secure base (Doyle et al., 2009). Romantic partners also can seek as safe and secure base to an individual because romantic partners always come after close friends. So it shows peer attachment always can increase a person feel secure. For young adults not in a long-term romantic relationship, long-term close friends sometimes serve as the primary attachment figure (Fraley & Davis, 1997); for adults in stable couple relationships, however, the romantic partner is assumed to be the preferred attachment figure for all attachment functions (Doyle et al., 2009).
Relationship between Lecturer Attachment and Resiliency
Ecological models of education show the teacher-student relationship as a nested influence on other spheres of a child’s interactions with the world (Bronfenbrenner, 1979, Klem & Connell, 2004). Harmonious teacher-students relationship makes students feel at ease and secure in teacher’s classroom and the trust and cooperation between the teacher and the students makes the students feel comfortable and secure in the classroom (Zhan & Le, 2005). It can be increase the student’s resiliency because the students had receive the protective factors from their teacher then it can help them to overcome the challenges.
Students who are satisfied with school and experience frequent positive emotions will exhibit adaptive coping behaviors, earning those increasing academic and interpersonal resources and rewards, which in turn promote upward spirals of school success. Support for the compensatory model would suggest targeting professional efforts primarily toward improving interpersonal relationships (i.e., parent, peer) for those students with low levels of attachment (Elmore, & Huebner, 2010).
A research suggest that schools should obvious focus for resiliency programs because of course schools has a captive audience where children are present 6 to 8 hours a day in one place. Although modern schools tend to overemphasize academic performance, schools can be a laboratory for resilience programs (Miller & Daniel, 2007).
students is characterized by closeness, mutual trust, harmonious relationship, trust and cooperation, equality, and mutual understanding.
According Rockoff (2003), the empirical evidence suggests that raising teacher quality may be a key instrument in improving student outcomes. The three most commonly mentioned aspects of the ideal role of the professor for social science college students corresponded with teaching ability (good communication skills, explains tasks clearly, organized, fluent), professor-student relationship (respectful manners, comprehensive, open), and social ability (easy to talk to, not authoritarian, fair) (Sanchez, Martinez-Pecino, Rodriguez, & Melero, 2011). This outcome can contribute to solve the students’ problem in university then increase their resiliency level by increase the lecturer teaching quality.
Recent results revealed that, students in private universities seem positively perceive lecturer- student’ relationship more than those in public universities. Firstly, the large classes experienced in public universities had down side effect on the student-lecturer relationship. This is in contrast to small classes where students have opportunities for interaction with their lecturers and peers. In private universities as opposed to public universities, there are small classes averaging fifty students per class. Thus lecturers get the opportunity to interact at one to one basis with students (Chepchieng, Mbugua, & Kariuki, 2006). Interaction between lecturer and students give the opportunity to increase the students performance in
class and help the student easy to share their problem with their lecturer.
On the other hand, if students lack interpersonal interactions with their teachers, they will feel a sense of loss or become frightened. This may have a negative effect in their learning behaviours and outcomes (Zhan & Le, 2005). Next, students in private universities usually evaluate their lecturer by point out the lecturers’ weakness. This practice in a way gives the lecturers an opportunity to improve especially in their classroom interactions with their students. Finally, some lecturers in public institutions do not provide consultation hours to students because they teach self sponsored students in other universities where they get an extra pay because of underpayment. (Chepchieng et al., 2006). This can decrease the relationship between lecturer and students and the student would not attach to their lecturer when the problems occur.
METHOD
The research design is to ensure that the evidence obtained enables answer the statement of problem and match with the objective of this study. A research designneeded to structure the research projects by show all of the major parts which includes the samples and population of study, measures, and method of data collection to make sure all needed evidences are collect and obtain in answer the problem of this study.
with resiliency. Correlational research design is give an indication of how variable may predict another and it can be positive and negative relationship between the variables of the study. The main objective of this study is to determine the relationship between parents, peer, lecturer attachment and resiliency among the UPM students, so it may to indicate the degree of the relationship between parents, peer, lecturer attachment and resiliency by using the correlational research design. Quantitative method would use to describe the relationship between parents, peer, lecturer attachment and resiliency among the UPM students through measurement and objective analysis. From this method, researcher can remove self to avoid bias and the more accurate and reliable of the result through validity and reliability measures. This study was using the structure questionnaires then did the data collection and analysis, after this can see the result when data analyzed. The result from the data collection would help this study in determine the relationship between those variables in statistical report.
Location of the Study
University Putra Malaysia (UPM) is the biggest government university in Malaysia which contains campus size 1108.103 hectares. The estimated population of the undergraduate students who live in college is 5000 students on 2011. For this study, sample had chosen randomly through the UPM’s colleges and then the result show that Serumpun College (Mohamad Rahsid College, Dua Belas College, Empat Belas College, Lima Belas College, and Enam Belas College) had
chosen finally. This study target respondents were the undergraduate students who live in colleges UPM, and 397 questionnaires were distributed to the targeted respondents. This study location was more convenience because the familiar location can lead the process of the research run effectively. For example, it can save the time and energy to do the survey in a familiar location. Besides, respondents can more corporate and follow the instruction of researcher when doing the survey questions because come of the same university then the result become more accurate.
Population and Sample Selection
The population of this study consisted of the undergraduate students who live in colleges UPM. The sampling method of the respondents in this present study used convenient sampling. The sample had chosen from Serumpun College (Mohamad Rahsid College, Dua Belas College, Empat Belas College, Lima Belas College, and Enam Belas College). A sample of 397 students had been chosen from the selected college which is UPM undergraduate students. The respondents were selected had come from different race, gender and faculties. The questionnaires were distribute to the respondents and collected by a representative from each block of the selected college.
Data Collection
close-
ended questions. The questionnaires were distribute in the selected colleges in UPM and then randomly chose the respondents to answer the questionnaires.
There had 397 sets of questionnaires needed to distribute to the 397 respondents and then the respondents required answering the entire survey form. Respondents will give 20-30 minutes to complete the entire survey form. Without confuse the respondents when answer the questionnaires, the explanation about the research had do before they start to answer. English version of questionnaires are provide to the respondents because basically as an undergraduate student must has the basic knowledge about English and the simple vocabulary and grammar had use in questionnaires to make the respondents easier to understand.
When distribute the questionnaires, permission from the respondent was required. The information or answer in the questionnaires that done by respondents must private and confidential. Respondents will be assured that all the information just for this research use only. The pilot study had done through the internet function which are the respondents had to answer the questionnaire from the internet.
Instrumentation
Questionnaire of this study consists of five parts which are respondent’s personal and parents characteristic, respondent’s resiliency, and respondent’s parents, peer and lecturer attachment.
Respondent’s personal and parents characteristics
The respondent’s personal characteristics consist of five items which investigated the background of the respondents. It consists of the following variables such as age, gender, number of siblings, credit hours taking, and current CGPA. Besides, respondent’s parents’ characteristics also consist of two variables, which are parents’ monthly income level and parents’ education level.
Independent Variable: Parents and Peer Attachment
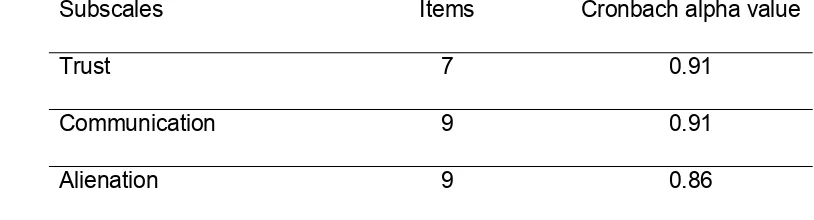
Table 1: Cronbach Alpha Value for Parents Subscales in Inventory of Parents Attachment
Subscales Items Cronbach alpha value
Trust 7 0.91
Communication 9 0.91
Alienation 9 0.86
Subject use the IPPA to assess the respondent’s parents attachment consists of 25 items.
Items for Trust subscale as follow:
1. I feel my parents are successful as parents.
2. I like to get my parents’' point of view on things I'm concerned about.
3. I trust my parents.
4. My parents accept me as I am. 5. My parents expect too much from
me.
6. My parents respect my feelings. 7. My parents trust my judgment. Items for Communication subscale as follow:
1. I can count on my parents when I need to get something off my chest.
2. I tell my parents about my problems and troubles.
3. If my parents know something is bothering me, they ask me about it.
4. My parents encourage me to talk about my difficulties.
5. My parents help me to understand myself better.
6. My parents sense when I'm upset about something.
7. My parents understand me.
8. When I am angry about something, my parents try to be understanding.
9. When we discuss things, my parents consider my point of view. Items for Alienation subscale as follow:
(* = Negative items)
1. *I don't get much attention at home.
2. *I feel angry with my parents. 3. *I feel it's no use letting my
feelings show.
4. *I get upset a lot more than my parents know about.
5. *I get upset easily at home. 6. *I wish I had different parents. 7. *My parents don't understand
what I'm going through these days.
8. *My parents have their own problems, so I don't bother them with mine.
9. *Talking over my problems with my parents makes me feel ashamed or foolish.
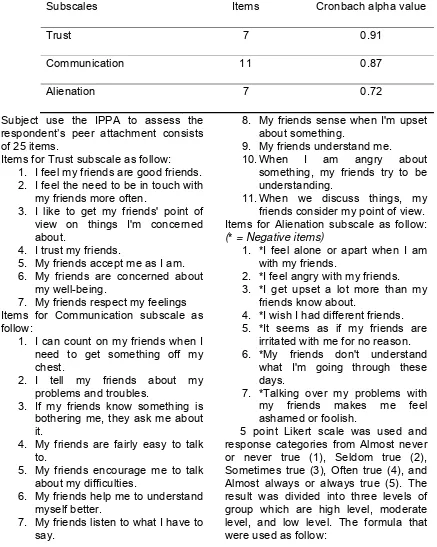
Table 2: Cronbach Alpha Value for Peer Subscales in Inventory of Peer Attachment Subscales Items Cronbach alpha value
Trust 7 0.91
Communication 11 0.87
Alienation 7 0.72
Subject use the IPPA to assess the respondent’s peer attachment consists of 25 items.
Items for Trust subscale as follow: 1. I feel my friends are good friends. 2. I feel the need to be in touch with
my friends more often.
3. I like to get my friends' point of view on things I'm concerned about.
4. I trust my friends.
5. My friends accept me as I am. 6. My friends are concerned about
my well-being.
7. My friends respect my feelings Items for Communication subscale as follow:
1. I can count on my friends when I need to get something off my chest.
2. I tell my friends about my problems and troubles.
3. If my friends know something is bothering me, they ask me about it.
4. My friends are fairly easy to talk to.
5. My friends encourage me to talk about my difficulties.
6. My friends help me to understand myself better.
7. My friends listen to what I have to say.
8. My friends sense when I'm upset about something.
9. My friends understand me.
10. When I am angry about something, my friends try to be understanding.
11. When we discuss things, my friends consider my point of view. Items for Alienation subscale as follow:
(* = Negative items)
1. *I feel alone or apart when I am with my friends.
2. *I feel angry with my friends. 3. *I get upset a lot more than my
friends know about.
4. *I wish I had different friends. 5. *It seems as if my friends are
irritated with me for no reason. 6. *My friends don't understand
what I'm going through these days.
7. *Talking over my problems with my friends makes me feel ashamed or foolish.
Maximum – Minimum = X (interval) 3
X + minimum = low level
X + lowest class limit = moderate level X + medium class limit = high level
Independent Variable: Lecturer Attachment
Inventory of Teacher-Student Relationships (IT-SR) is design by Christopher Murray and Keith Zvoch on 2011. IT-SR is adapting widely used IPPA (Armsden & Greenberg, 1987). According to Murray and Zvoch (2011), IT-SR is a student report measure of teacher-student relationship. There have 17 items were selected from IPPA base on the selected items contained suitable content in the context of teacher and student relationships during late childhood and early adolescence
and the items were selected to parallel the constructs on the original IPPA (i.e., Communication, Trust, and Alienation) (Murray & Zvoch, 2011).
The selected items were then adapted by changing the target relationship to teachers. For example, the original item from parents scale “My parents respect my feelings” was changed to “My teacher respects my feelings”. Items on the Communication and Trust scales were designed to assess student perspectives regarding teacher understanding, responsiveness, acceptance, and sensitivity, whereas Alienation items reflected students’ sense of emotional detachment from teachers (Murray & Zvoch, 2011).
The final three subscales in IT-SR are show as table below:
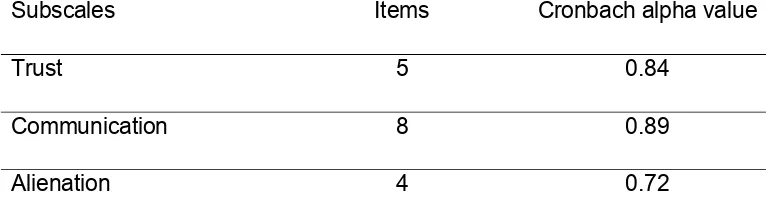
Table 3: Cronbach Alpha Value for Lecturer Subscales in Inventory of Teacher-Student Relationships
Subscales Items Cronbach alpha value
Trust 5 0.84
Communication 8 0.89
Alienation 4 0.72
Subject use the IT-SR to assess the respondent’s lecturer attachment consists of 17 items. Items for Trust subscale as follow:
1. I feel my lecturer is successful as a lecturer.
2. I trust my lecturer.
3. My lecturer accepts me as I am. 4. My lecturer respects my feelings. 5. My lecturer trusts my judgment.
Items for Communication subscale as follow:
1. Count on lecturer when need to get something off chest.
2. I tell my lecturer about my problems and troubles.
3. If lecturer knows something bothering me, they ask me about it.
5. My lecturer encourages me to talk about my difficulties.
6. My lecturer helps me understand myself better.
7. My lecturer understands me. 8. When angry, lecturer tries to be
understanding.
Items for Alienation subscale as follow:
(* = Negative items)
1. *I feel that no one understands me.
2. *I get upset a lot more than my lecturer knows about.
3. *I get upset easily at school. 4. *My lecturer doesn’t understand
what I’m going through.
Responses to items were provided on a 4-point scale, for example, Almost never or never true =1, Sometimes true = 2, Often true = 3, and almost always true or always true = 4 (Murray & Zvoch, 2011). The result was divided into three levels of group which are high level, moderate level, and low level. The formula that were used as follow:
Maximum – Minimum = X (interval) 3
X + minimum = low level
X + lowest class limit = moderate level X + medium class limit = high level
Dependent Variable: Resiliency
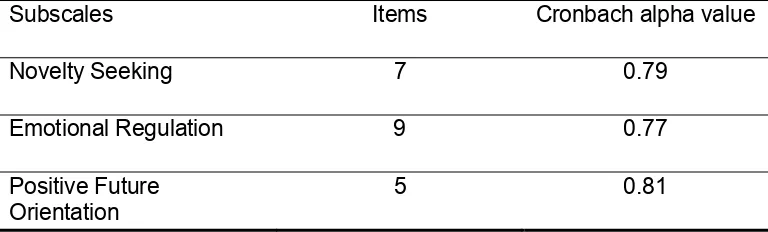
Instrument to measure the resilience level among the UPM students in this study is using Adolescent Resilience Scale which design by Atsushi Oshio, Hitoshi Kaneko, Shinji Nagamine, and Motoyuki Nakaya on 2003. This inventory developed to measure the psychological features of resilient individuals. This scale consists of 21 items and three factors: Novelty Seeking, Emotional Regulation, and Positive Future Orientation.
According to Oshio, et al. (2003), the coefficients alpha for total score (alpha = .85). The final three subscales in Adolescent Resilience Scale are show as table below:
Table 4: Cronbach Alpha Value for Resilience Subscales in Adolescent Resilience Scale
Subscales Items Cronbach alpha value
Novelty Seeking 7 0.79
Emotional Regulation 9 0.77
Positive Future Orientation
5 0.81
Subject use the Adolescent Resilience Scale to assess the respondent’s resiliency consists of 21 items. Items for Novelty Seeking subscale as follow:
1. I don’t like to do unfamiliar things. 2. I find out it bothersome to start
new activities.
3. I like new or intriguing things. 4. I like to find out about things. 5. I seek new challenges.
6. I think difficulties from a part of life’s valuable experiences.
Items for Emotional Regulation subscale as follow: (* = Negative items)
1. I can stay calm in tough circumstances.
2. *I cannot endure adversity. 3. *I find it difficult not to dwell on a
negative experience.
4. *I have difficulty in controlling my anger.
5. *I lose interest quickly.
6. I make an effort to always stay calm.
7. I think I can control my emotions. 8. I think I have perseverance. 9. *My behavior varies with my daily
moods.
Items for Positive Future Orientation subscale as follow:
1. I am striving towards my future goal.
2. I am sure that good things will happen in the future.
3. I feel positive about my future. 4. I have a clear goal for the future. 5. I think I have a bright future. Respondents were ask to choose a rating scale using anchors of 5=Definitely Yes and 1=Definitely No. The result was divided into three levels of group which are high level, moderate level, and low level. The formula that were used as follow:
Maximum – Minimum = X (interval) 3
X + minimum = low level
X + lowest class limit = moderate level X + medium class limit = high level
RESULTS AND DISCUSSION
Personal Characteristics
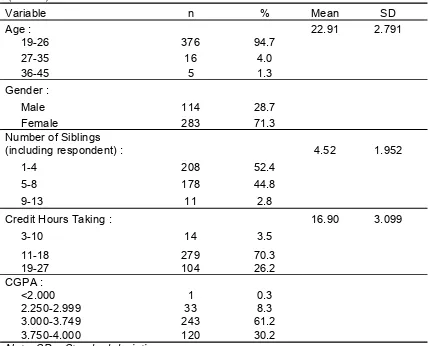
Table 6 provides the clear explanations about respondent’s
personal characteristics which include age, gender, number of siblings (including respondent), credit hours taking, and CGPA. There had 397 respondents of this study which consist of 114 (28.7%) male and 283 (71.3%) female students. The average of respondent’s age was 22.91 years old (SD = 2.791). Majority (94.7%) of respondents was in the range 19-26 years old, and then follows by range 27-35 years old (4.0%). Only 5 (1.3%) respondents were in the range 36-45 years old.
Table 6: Descriptive Statistic for Respondent’s Personal Characteristics (age, gender, number of siblings-including respondent, credit hours taking, and CGPA)
(N=397)
Variable n % Mean SD
Age : 22.91 2.791
19-26 376 94.7
27-35 16 4.0
36-45 5 1.3
Gender :
Male 114 28.7
Female 283 71.3
Number of Siblings
(including respondent) : 4.52 1.952
1-4 208 52.4
5-8 178 44.8
9-13 11 2.8
Credit Hours Taking : 16.90 3.099
3-10 14 3.5
11-18 279 70.3
19-27 104 26.2
CGPA :
<2.000 1 0.3
2.250-2.999 33 8.3
3.000-3.749 243 61.2
3.750-4.000 120 30.2
Note. SD = Standard deviation
Parents Characteristics
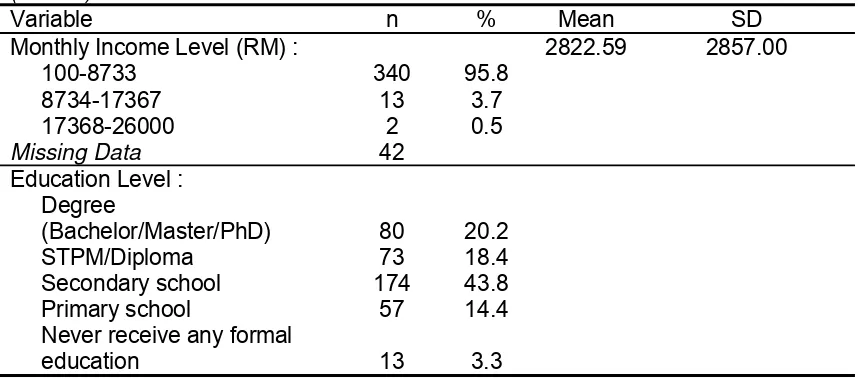
Table 7 showed the parents characteristics which include the status of parents’ monthly income and parents’ education level. The average of the parents’ monthly income level was RM 2822.59 (SD = 2857.00). Majority (95.8%) of parents earn the monthly income in range RM 100 to RM 8733. While only 2 (0.5 %) parents earn monthly income in range RM17333 to RM26000. From the data analyzed
shows there was 42 missing data in parents’ monthly income level.
Table 7: Descriptive Statistics for Respondent’s Parents Characteristics (monthly income level and education level)
(N=397)
Variable n % Mean SD Monthly Income Level (RM) : 2822.59 2857.00
100-8733 340 95.8
8734-17367 13 3.7
17368-26000 2 0.5
Missing Data 42
Education Level : Degree
(Bachelor/Master/PhD) 80 20.2
STPM/Diploma 73 18.4
Secondary school 174 43.8 Primary school 57 14.4 Never receive any formal
education 13 3.3
Note. SD = Standard deviation
4.3 Level of Resiliency among the UPM students
Table 8 summarizes the level of resiliency among the UPM students. Average of resiliency score was 78.18 (SD = 7.679). Most of the respondents (68.5%) reported in moderate resiliency levels with the moderate score ranging from 64 to 82. Only 9 (2.3%) respondents were scored low (45 to 63
scores) which indicates low level of resiliency. There were also 116 (29.2%) respondents reported high resiliency levels with score ranging from 83 to 101. From the data analyzed, the minimum score of respondent’s resiliency was 45 while the maximum score of respondent’s resiliency was 99. Higher score of resiliency indicates the respondents’ higher resiliency level.
Table 8 : Descriptive Statistics for the Level of Respondent’s Resiliency
(N=397)
Variable n % Mean SD Min. Max Resiliency : 78.18 7.679 45 99
Low (45-63) 9 2.3 Moderate (64-82) 272 68.5 High (83-101) 116 29.2
Note. SD = Standard deviation, Min. = Minimum, Max. = Maximum
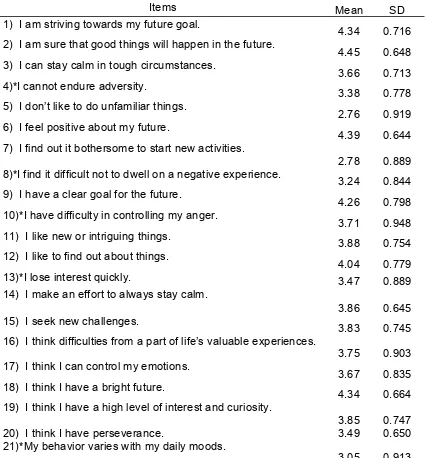
There had 21 items to measure the level of resiliency and it consists of 16 positive items and 5 negative items.
had the highest mean 4.45 (SD = 0.648), then follow by the second highest mean 4.39 (SD = 0.644) goes to positive item “I feel positive about my future”. However, the positive item “I don’t like
to do unfamiliar things” had the lowest mean 2.76 (SD = 0.919). While the second lowest mean 2.78 (SD = 0.889) goes to item “I find out it bothersome to start new activities”.
Table 9: Mean and Standard Deviation of the Respondent’s Resiliency
(N=397)
Items Mean SD
1) I am striving towards my future goal.
4.34 0.716 2) I am sure that good things will happen in the future.
4.45 0.648 3) I can stay calm in tough circumstances.
3.66 0.713 4)*I cannot endure adversity.
3.38 0.778 5) I don’t like to do unfamiliar things.
2.76 0.919 6) I feel positive about my future.
4.39 0.644 7) I find out it bothersome to start new activities.
2.78 0.889 8)*I find it difficult not to dwell on a negative experience.
3.24 0.844 9) I have a clear goal for the future.
4.26 0.798 10)*I have difficulty in controlling my anger.
3.71 0.948 11) I like new or intriguing things.
3.88 0.754 12) I like to find out about things.
4.04 0.779 13)*I lose interest quickly. 3.47 0.889 14) I make an effort to always stay calm.
3.86 0.645 15) I seek new challenges.
3.83 0.745 16) I think difficulties from a part of life’s valuable experiences.
3.75 0.903 17) I think I can control my emotions.
3.67 0.835 18) I think I have a bright future.
4.34 0.664 19) I think I have a high level of interest and curiosity.
3.85 0.747 20) I think I have perseverance. 3.49 0.650 21)*My behavior varies with my daily moods.
3.05 0.913
Level of Parents Attachment among the UPM students
From table 10, the average of parents attachment score was 103.22 (SD = 11.495). More than half (53.9%) of respondents reported the high score ranging from 105 to 123 which indicated high parents attachment level. Besides, there were 148 (37.3%) of respondents reported in moderate parents attachment levels with moderate score
ranging from 86 to 104. Only 35 (8.8%) respondents were perceived low score (45 to 63) which indicate low level of parents attachment. Respondent had perceived at minimum score 67 and maximum score 123 of parents attachment. In overall, higher score of parents attachment indicates higher level of parents attachment among the UPM students.
Table 10: Descriptive Statistics for the Level of Respondent’s Parents Attachment
(N=397)
Variable n % Mean SD Min. Max
Parents attachment score : 103.22 11.495 67 123 Low (67-85) 35 8.8
Moderate (86-104) 148 37.3 High (105-123) 214 53.9
Note. SD = Standard deviation, Min. = Minimum, Max. = Maximum
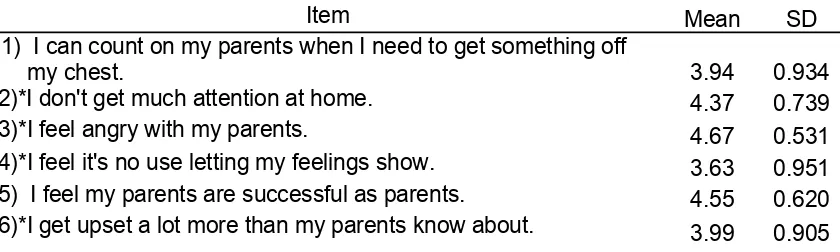
Table 11 presents mean and standard deviation of each item in parents attachment. There had 25 items which consists of 16 positive items and 9 negative items.
The negative item “I wish I had different parents” had the highest mean 4.72 (SD = 0.587), then follow by negative item “I feel angry with my parents” had the second highest mean
4.67 (SD = 0.531). However the item with lowest mean 2.95 (SD = 1.009) goes to positive item “My parents expect too much from me” and this show respondents not get too much expectation from their parents. While the second lowest mean 3.55 (SD = 1.183) goes to negative item “My parents have their own problems, so I don't bother them with mine”.
Table 11: Mean and Standard Deviation of the Respondent’s Parents Attachment
(N=397)
Item Mean SD
1) I can count on my parents when I need to get something off
my chest. 3.94 0.934
7)*I get upset easily at home. 4.31 0.790 8) I like to get my parents' point of view on things I'm concerned
about. 4.33 0.771
9) I tell my parents about my problems and troubles. 4.01 0.987 10) I trust my parents. 4.62 0.594 11)*I wish I had different parents. 4.72 0.587 12) If my parents know something is bothering me, they ask me
about it. 3.99 0.888
13) My parents accept me as I am. 4.58 0.648 14)*My parents don't understand what I'm going through these
days. 3.96 0.890
15) My parents encourage me to talk about my difficulties. 3.75 0.945 16) My parents expect too much from me. 2.95 1.009
17)*My parents have their own problems, so I don't bother them
with mine. 3.55 1.183
18) My parents help me to understand myself better. 4.12 0.906 19) My parents respect my feelings. 4.42 0.712 20) My parents sense when I'm upset about something. 3.98 0.897 21) My parents trust my judgment. 4.28 0.801 22) My parents understand me. 4.26 0.776
23)*Talking over my problems with my parents makes me feel
ashamed or foolish. 4.02 0.880 24) When I am angry about something, my parents try to be
understanding. 4.08 0.858
25) When we discuss things, my parents consider my point of
view. 4.16 0.794
Note. SD = Standard deviation, *= Negative items
Level of Peer Attachment among the UPM students
In overall, the average of peer attachment score among the respondents was 101.27 (SD = 13.283). There were 58 (14.6%) respondents perceived the low level of peer attachment with score ranging from 66 to 85. Besides, half (50.6%) of respondents perceived moderate level
Table 12: Descriptive Statistics for the Level of Respondent’s Peer Attachment
(N=397)
Variable n % Mean SD Min. Max
Peer attachment score : 101.27 13.283 66 125 Low (66-85) 58 14.6
Moderate (86-105) 201 50.6 High (106-125) 138 34.8
Note. SD = Standard deviation, Min. = Minimum, Max. = Maximum
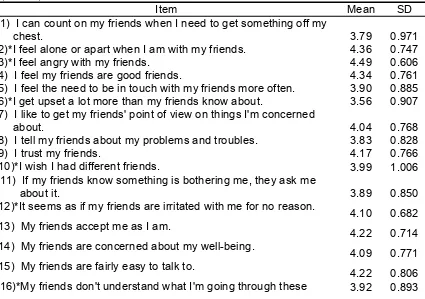
Table 13 presents the mean and standard deviation of each item in peer attachment. There had 25 items which consists of 18 positive items and 7 negative items.
From table 13, the negative item “I feel angry with my friends” had the highest mean 4.49 (SD = 0.606), then follow by the second highest mean 4.36
(SD = 0.747) goes to negative item “I feel alone or apart when I am with my friends”. However, the lowest mean 3.56 (SD = 0.907) goes to negative item “I get upset a lot more than my friends know about”. Then positive item “I can count on my friends when I need to get something off my chest” was second lowest mean 3.79 (SD = 0.971)
Table 13: Mean and Standard Deviation of the Respondent’s Peer Attachment
(N=397)
Item Mean SD
1) I can count on my friends when I need to get something off my
chest. 3.79 0.971
2)*I feel alone or apart when I am with my friends. 4.36 0.747 3)*I feel angry with my friends. 4.49 0.606 4) I feel my friends are good friends. 4.34 0.761 5) I feel the need to be in touch with my friends more often. 3.90 0.885 6)*I get upset a lot more than my friends know about. 3.56 0.907 7) I like to get my friends' point of view on things I'm concerned
about. 4.04 0.768
8) I tell my friends about my problems and troubles. 3.83 0.828 9) I trust my friends. 4.17 0.766 10)*I wish I had different friends. 3.99 1.006
11) If my friends know something is bothering me, they ask me
about it. 3.89 0.850
12)*It seems as if my friends are irritated with me for no reason.
4.10 0.682 13) My friends accept me as I am.
4.22 0.714 14) My friends are concerned about my well-being.
4.09 0.771 15) My friends are fairly easy to talk to.
days.
17) My friends encourage me to talk about my difficulties. 4.01 0.788 18) My friends help me to understand myself better. 4.05 0.818 19) My friends listen to what I have to say. 3.98 0.796 20) My friends respect my feelings. 4.21 0.736 21) My friends sense when I'm upset about something. 3.93 0.834 22) My friends understand me. 3.91 0.848
23)*Talking over my problems with my friends makes me feel
ashamed or foolish. 4.05 0.841 24) When I am angry about something, my friends try to be
understanding. 4.19 0.845
25) When we discuss things, my friends consider my point of
view. 4.03 0.768
Note. SD = Standard deviation, *= Negative items
Level of Lecturer Attachment among the UPM students
From table 14, the average of lecturer attachment score was 45.46 (SD = 9.096). Half (51.1%) of respondents had reported in moderate level of score ranging from 36 to 50. Besides, there were 135 (34.0%) respondents had reported in high lecturer attachment score with score
ranging from 51 to 65. Only 59 (14.9%) respondents were perceived low score (21 to 35 scores) which indicates low level of lecturer attachment. The minimum score was 21 while the maximum score was 65. In overall, higher score of lecturer attachment indicates higher level of lecturer attachment among the UPM students.
Table 14: Descriptive Statistics for the Level of Respondent’s Lecturer Attachment
(N=397)
Variable n % Mean SD Min. Max
Lecturer attachment score : 45.46 9.096 21 65 Low (21-35) 59 14.9
Moderate (36-50) 203 51.1 High (51-65) 135 34.0
Note. SD = Standard deviation, Min. = Minimum, Max. = Maximum
Table 15 presents the mean and standard deviation of each item in lecturer attachment. There had 17 items which consists of 13 positive items and 4 negative items.
The negative item “I feel that no one understands me” had the highest mean
troubles”. While the second lowest mean 2.09 (SD = 0.826) also goes to positive item “If lecturer knows
something bothering me, they ask me about it”.
Table 15: Mean and Standard Deviation of the Respondent’s Lecturer Attachment
(N=397)
Item Mean SD
1) Count on lecturer when need to get something off chest. 2.14 0.789 2) I feel my lecturer is successful as a lecturer. 3.23 0.806 3)*I feel that no one understands me. 3.56 0.545 4)*I get upset a lot more than my lecturer knows about. 2.93 0.885 5)*I get upset easily at school. 3.20 0.787 6) I tell my lecturer about my problems and troubles. 1.76 0.806 7) I trust my lecturer. 3.07 0.785 8) If lecturer knows something bothering me, they ask me about
it. 2.09 0.826
9) My lecturer accepts me as I am. 3.11 0.816 10) My lecturer can tell when something is upsetting me. 2.33 0.990 11)*My lecturer doesn’t understand what I’m going through. 2.90 0.739 12) My lecturer encourages me to talk about my difficulties. 2.39 1.078 13) My lecturer helps me understand myself better. 2.63 0.908 14) My lecturer respects my feelings. 2.89 0.898 15) My lecturer trusts my judgment. 2.67 0.759 16) My lecturer understands me. 2.41 0.942 17) When angry, lecturer tries to be understanding. 2.14 0.857
Note. SD = Standard deviation, *= Negative items
Relationship between Parents Attachment and Resiliency among the UPM students
The Pearson correlation analysis of parents attachment and resiliency was presented in table 16. There was a positive significant relationship between parents attachment and resiliency with r = 0.434 and p = 0.000 (p<0.001). The hypothesis was significant relationship between parents attachment and resiliency among the UPM students.
Table 16: Pearson Correlation Analysis of Parents Attachment and Resiliency
Variable Parents attachment
Correlation (r) Sig.(2 tailed) (p)
Resiliency 0.434 0.000
Note. p is significant of the value <0.05
Relationship between Peer Attachment and Resiliency among the UPM students
From table 17, it showed the positive correlation of peer attachment and resiliency (r = 0.455 and p = 0.000, (p<0.001). The hypothesis was significant relationship between peer attachment and resiliency among the UPM students. Thus, the hypothesis is
true. The positive correlation suggested that UPM students obtained high level of peer attachment with a high level of resiliency. A finding showed that high level of peer support as important extra familial protective factors which can increase the resiliency level of an individual for overcome the negative effect had face (Chassin, Carle, Nissim-Sabat, & Kumpfer, 2004, Ahern, 2006).
Table 17: Pearson Correlation Analysis of Peer Attachment and Resiliency
Variable Peer attachment
Correlation (r) Sig.(2 tailed) (p)
Resiliency 0.455 0.000
Note. p is significant of the value <0.05
Relationship between Lecturer Attachment and Resiliency among the UPM students
The Pearson correlation analysis of lecturer attachment and resiliency was presented in table 18. There was a positive significant relationship between lecturer attachment and resiliency with r = 0.495 and p = 0.000 (p<0.001). The hypothesis was significant relationship between lecturer attachment and resiliency among the UPM students.
Thus, the hypothesis is true. The positive correlation suggested that UPM students obtained high level of lecturer attachment with a high level of resiliency.
Harmonious teacher-students relationship makes students feel at ease
and secure in teacher’s classroom and the trust and cooperation between the teacher and the students makes the students feel comfortable and secure in the classroom (Zhan & Le, 2005).
Table 18: Pearson Correlation Analysis of Lecturer Attachment and Resiliency
Variable Lecturer attachment
Correlation (r) Sig.(2 tailed) (p)
Resiliency 0.495 0.000
Factors Uniquely Predict Resiliency among the UPM students
Multiple regression analysis was conducted to investigate the unique predictors of resiliency score. Table 19 showed the first model of the combination of all seven factors (respondent’s age, gender, number of siblings, credit hours taking, CGPA, parents’ monthly income level and
parents’ education level) to predict resiliency was statistically significant with F=3.813, p=0.001. The beta coefficients are presented in table 19. As a result note that respondent’s age and gender were significantly predicts resiliency when all factors were included. The R square value was 0.071 indicates that 7.1% of the variance in resiliency was explained by the model.
First Model:
Table 19: Multiple Regression Analysis for Personal Characteristic and Parents’ Characteristic vs. Resiliency
Variable β p
Respondent's Age 0.175 0.002
Respondent's Gender -0.185 0.001
Number of Siblings (including respondent) 0.071 0.194 Credit Hours Taking 0.067 0.218 Respondent's CGPA 0.005 0.932 Parentss' Monthly Income Level 0.074 0.209 Parentss' Education Level 0.000 0.992
R2 = 0.071
F = 3.813 p = 0.001
Note. Significant level, p<0.05
Table 20 showed the final model of the combination independent variables (parents, peer, lecturer attachment) of this study, with respondent’s age and gender to predict resiliency was statistically significant with F=38.800, p=0.000. The beta coefficients are presented in table 20. As a result note that except of respondent’s gender was
Final Model:
Table 20: Multiple Regression Analysis for Respondent’s Age, Gender and Independent Variable (Parents, Peer, Lecturer Attachment) vs. Resiliency
Variable β p
Parents Attachment 0.180 0.001
Peer Attachment 0.179 0.001
Lecturer Attachment 0.281 0.000
Respondent's Age 0.129 0.002
Respondent's Gender -0.028 0.541
R2 = 0.332
F = 38.800 p = 0.000
Note. Significant level, p<0.05
Conclusion
There are several implications that could be drawn from the present study. The present study found there was a relationship between parents attachment and resiliency among the UPM students. It means that parents attachments of the respondents were related to the resiliency. University can provide some appropriate programs or seminar in order to increase the students’ resiliency. The programs must able to help the students know what are the strategies can increase their resiliency level in daily life, for example the strategy that always remind the students to share their problem with their parents and friends can help them coping their stress. Government also can come out some campaigns that increase parents’ awareness about the important between parents and their child interaction which will influence their child’s resiliency competence in future. Through the mass media, government can deliver the message about the important of resiliency among the students in order to decrease the percentage of students in depression,
stressful, suicide, and also some of the social problem had faced by the community nowadays.
the respondents’ lecturer attachment were significant influence their resiliency. Lecturer can always concern to their students in order to let the students feel that lecturer know their situation or problem and able to give them some opinion and suggestion to make the good decision. Besides, lecturer also can always praise and encourage to their students, for example praise to the students who had successfully do the great job for their assignment however encourage for those were failed. This can be done during the class and meeting with the academic advisor. Then it can increase students’ confidence and trust to their lecturer and decrease the gap to the lecturer.
BIBLIOGRAPHY
Abolghasemi, A., & Varaniyab, S. T. (2010). Resilience and perceived stress: predictors of life satisfaction in the students of success and failure. Procedia Social and Behavioral Sciences ,
5,
748-752.DOI:10.1016/j.sbspro.2010.0 7.178.
Ahern, N. R. (2006). Adolescent resilience: An evolutionary concept analysis. Journal of Pediatric Nursing , 21 (3), 175-185.
Armsden, G. C., & Greenberg, M. T. (1987). The Inventory of Parent and Peer Attachment: Individual Differences and Their Relationship to Psychological Well-Being in Adolescence.
Journal of Youth and Adolescenc, 16 (5), 427-454.
Atsushi Oshio, H. K. (2003). Construct validity of the Adolescent
Resilience Scale. Psychological Reports, 93 (3), 1217-1222.
Atwool, N. (2006). Attachment and resilience: Implications for children in care. Child Care in Practice , 12 (4), 315-330.DOI: 10.1080/13575270600863226. Black, K., & Lobo, M. (2008). A
conceptual review of family resilience factors. Journal of Family Nursing , 14 (1), 33-55.DOI:
10.1177/1074840707312237. Black, K. A., & Schutte, E. D. (2006). Recollections of being loved:
Implications of
childhood experiences with parents for young adults’ romantic relationships.
Journal of Family Issues, 27,1459–1480.
Bowlby, J. (1973). Attachment and Loss: Vol. 2. Separation. New York: Basic. Bowlby, J. (1982). Attachment and loss: Vol 1. Attachment. New York: Basic Books.
Bronfenbrenner, U. (1989). Ecological systems theory. In R. Vasta (Ed.), Six theories of child development: Revised formulations and current issues (pp. 187–250). Greenwich, CT: JAI Press.
Bronfenbrenner, U. (1979). The ecology of human development: Experiments by nature and design. Cambridge, MA: Harvard University Press.
Families, and Communities: Strengths-based Research and Policy. American Psychological Association, Washington, DC. Chepchieng, M. C., Mbugua, S. N., &
Kariuki, M. W. (2006). University students’ perception of lecturer-student relationships: a comparative study of Public and Private Universities in Kenya.
Educational Research and Reviews, 1 (3), 80-84.
Doyle, A. B., Lawford, H., & Markiewicz, D. (2009). Attachment style with mother, father, best friend, and romantic partner during adolescence. Journal of Research Adolescence , 19 (4), 690-714.
Elmore, G. M., & Huebner, E. S. (2010). Adolescents' satisfaction with
school experiences: Relationships with demographics,
attachment relationships, and school engagement behavior.
Psychology in the Schools , 47
(6), 525-537.
Fraley, R. C., & Davis, K. E. (1997). Attachment formation and transfer in young adults’ close friendships and romantic relationships. Personal Relationships, 4, 131–144.
Hall, J. C. (2007). Kinship ties: Attachment relationships that promote resilience in African American adult children of alcoholics. Advances in Social Work, 8 (1), 130-140.
Hazan, C., & Shaver, P. R. (1994). Attachment as an organizational framework for research on close relationships. Psychological Inquiry, 5, 1-22.
Henley, R. (2010). Resilience enhancing psychosocial programmes for youth in different cultural contexts: Evaluation and research.
Progress in Development Studies , 10 (4), 295-307.DOI: 10.1177/146499340901000403. Kenny, M. E., & Donaldson, G. A.
(1991). Contributions of parental attachment and family structure to the social and psychological functioning of first-year college students. Journal of Counseling Psychology, 38, 479-486.
Klem, A. M., & Connell, J. P. (2004). Relationships matter: Linking teacher support to student engagement and achievement.
Journal of School Health , 74 (7), 262-273.
Legault, L., Anawati, M., & Flynn, R. (2006). Factors favoring psychological resilience among fostered young people. Children and Youth Services Review , 28, 1024-1038.
DOI:10.1016/j.childyouth.2005.10 .006.
Masten, A.S., Best, K.M., & Garmezy, N. (1990) Resilience and development: Contributions from the study of children who overcome
adversity. Development and Psychopathology, 2, 425-444.
Masten, A. S., & Gewirtz, A. H. (2006). Resilience in development: The importance of early childhood.
Encyclopedia on Early Childhood Development , 1-6.