Some previous researchers are still arguing about the factors that determine the selection of a bank. These factors depend on the intensity of marketing activities undertaken by the bank, reputation of the bank, credit availability, friendly staffs, appropriate interest rates, and location. Jakarta was selected for the research location since Jakarta is the biggest city in Indonesia that represents the advancement of the banking industry. Different statistics tools are applied to find the accurate opinion why respondent choose a bank. Based on the results, the research concludes factors that determine in selecting a bank tend to be based on the secondary factors such as recommendation from friends, and advice from family members..
© 2011 IRJBS, All rights reserved. Received: January 13, 2011
Final revision: March 20, 2011
Keywords: Bank marketing.
Corresponding author: [email protected]
Umbas Krisnanto
ABFI Institute Perbanas, Jakarta - Indonesia
A R T I C L E I N F O A B S T R A C T
The Customers’ Determinant Factors
of the Bank Selection
T
he banking industry has been growing rapidly in Indonesia since private banks were allowed to open branches in 1988. The rapid development of banking industry led to the collapse of the economy because banks were not able to absorb funds since the 1990s. The peak of the development of banking industry in Indonesia was affected by the economic crises overseas and the situation was exacerbated by the disappointing election results in 1997, leading to the collapse of the economy.In 1998, the Government began to regain control of the banking industry, and banks participated in the healthy bank condition competition. They
carry out a variety of differentiation and promotion to attract as many customers as possible. The purpose of this study is addressed to the changing market environment, technological advancement, development of habits, attitudes, and decisions of people in using a bank not only as a complementary necessity, but as a primary necessity. This empirical research is used for academic purposes based on the previous researches to provide additional information about the development of people’s motivation for benefiting from banks. This research does not describe in detail what motivate customers to switch banks every time they make a transaction which will affect the switching cost in a bank as it was studied by Burnham et al. (2003).
Laroche et.al (1986) suggests that the quality of customer service is the customers’ primary purpose when using services in a particular bank. Khazeh and Decker (1992) add that one of the reasons a person decides to go to a bank is the competitive rates.
Sheth (1992) and Balabanis and Diamantopoulos (2004) state that the readiness of a society towards the presence of banking industry needs to be addressed using a variety of marketing strategies which are different from one country to another.
METHODS
The criteria for bank selection by the people are based on studies previously conducted by several researchers. The type of research is to conduct exploration by determining factors that influence the selection of a bank. The measurement was carried out using a few questions such as those used by Parasuraman et al. (1988). The stages carried out were similar to those in the research conducted by Hansen (2004), by distributing statements to the respondents and classifying the statements using statistical software called SPSS. The population included as respondents were bank customers in DKI Jakarta province. The sample used was in accordance with the study by Cunningham et al (2006), that is bank customers who actually have an account at a bank.
The research was conducted in June-July 2009. Twenty statements were made based on the previous research. The statements were put in a range using Likert Scale, from 1 (strongly disagree) to 5 (strongly agree). Questionnaires were distributed to 200 respondents, but those returned and in a decent condition were only 140.
The statistical tool used to carry out the most appropriate exploration is R factor analysis, but other multivariable analysis tools such as Structural Equation Model (SEM) and cluster analysis (Q factor analysis) can also be used.
RESULTS AND DISCUSSION Exploration Analysis
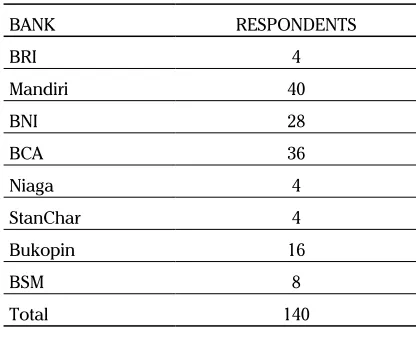
Data on respondents that have an account with the following banks:
The exploration of research data used a factor analysis in stages as proposed by Hair et al (1998). The descriptive statistics obtained are as follows.
Source: Research results
Table 2. Number of respondents who completed the questionnaires
BANK RESPONDENTS
Mean Std. Deviation Analysis N
CNV1 4,11 1,119 140
CNV2 4,03 1,138 140
CNV3 3,83 1,211 140
CNV4 3,54 ,876 140
CNV5 3,40 ,728 140
CNV6 3,91 ,877 140
CNV7 4,00 ,898 140
CMP1 3,63 ,834 140
CMP2 3,97 ,881 140
CMP3 3,69 ,857 140
CMP4 3,63 ,799 140
CMP5 3,71 ,851 140
CMP6 3,69 ,823 140
PER1 2,57 1,504 140
PER2 1,57 ,806 140
PER3 2,60 1,251 140
PER4 1,49 ,877 140
CHG1 3,00 ,635 140
CHG2 1,97 ,848 140
CHG3 2,83 1,059 140
Source: Research results Table 3. Descriptive Statistics
It is necessary to find out what causes the rapid development of banking industry. Decision makers in banking industry also need to immediately find out what motivates people to welcome banks in various strategic places. The attitude toward the presence of banking industry which facilitates financial transactions also needs to be understood by banking management. In addition, it is important to know whether the presence of banking industry is a necessity or just an illusion (Kotler, 2008). In developing countries like Indonesia it is also necessary to know the reason why people use banks for their financial transactions. Studies conducted by Anderson et al (1976) determine five factors in choosing a bank, namely:
1. recommendation from a friend 2. the bank’s reputation
3. availability of loans 4. friendly employees 5. appropriate charges
Meanwhile, according to Dupuy (1976), one factor needs to be added to the selection criteria above: 6. Its strategic location
According to Ta (2000), recommendation from parents needs to be added to the list as a factor.
The bank management will use consumers’ selection of a bank to determine a marketing strategy to attract as many consumers as possible (Aldlaigan, 2005). The research conducted by
Convenience
1 The bank’s location is easy to reach CNV1
2 The bank’s location is close to home / campus CNV2
3 The bank has many branches in different places CNV3
4 The bank employees serve the customers quickly CNV4
5 It’s fun to go to the bank CNV5
6 The bank security is guaranteed CNV6
7 It’s a reputable bank CNV7
Competence
8 The bank employees are very competent in handling customers CMP1
9 The bank employees are very friendly CMP2
10 My financial data are easily monitored CMP3
11 The bank has complete facilities for transactions CMP4
12 The bank handles transactions accurately CMP5
13 The bank employees serve the consumers based on the procedures CMP6
Recommendations from other people
14 I become a customer of the bank because my parents told me to do so PER1
15 I become a customer of the bank upon my friend’s recommendation PER2
16 I become a customer of the bank because the bank is known by my family PER3 17 I am a customer of the bank because I was required to do so my an institution PER4
Appropriate charges
18 The bank fees charged are appropriate with the services CHG1
19 The bank’s interest is not important CHG2
20 The interest earned cumulatively can add the funds CHG3
Table 6. Goodness of Fit Statistics
Calculation results Standard Criteria
Degrees of Freedom = 164
Minimum Fit Function Chi-Square = 185.31 (P = 0.12)
Normal Theory Weighted Least Squares Chi-Square = 181.74 (P = 0.16) P > 0.05
Estimated Non-centrality Parameter (NCP) = 17.74 Small
90 Percent Confidence Interval for NCP = (0.0 ; 54.80) Minimum Fit Function Value = 1.33
Population Discrepancy Function Value (F0) = 0.13 90 Percent Confidence Interval for F0 = (0.0 ; 0.39)
Root Mean Square Error of Approximation (RMSEA) = 0.028 < 0.08
90 Percent Confidence Interval for RMSEA = (0.0 ; 0.049) P-Value for Test of Close Fit (RMSEA < 0.05) = 0.96
Expected Cross-Validation Index (ECVI) = 1.97 Small
90 Percent Confidence Interval for ECVI = (1.84 ; 2.24) Small
ECVI for Saturated Model = 3.02 Big
ECVI for Independence Model = 3.16 Big
Chi-Square for Independence Model with 190 Degrees of Freedom = 398.84 Independence AIC = 438.84
Model AIC = 273.74 Small
Saturated AIC = 420.00 Big
Independence CAIC = 517.68 Big
Model CAIC = 455.05 Small
Saturated CAIC = 1247.74 Big
Root Mean Square Residual (RMR) = 0.14
Standardized RMR = 0.069 <0.05
Goodness of Fit Index (GFI) = 0.88 >0.9
Adjusted Goodness of Fit Index (AGFI) = 0.85 >0.9
Parsimony Goodness of Fit Index (PGFI) = 0.69 >0.9
Normed Fit Index (NFI) = 0.54 >0.9
Non-Normed Fit Index (NNFI) = 0.88 >0.9
Parsimony Normed Fit Index (PNFI) = 0.46 >0.9
Comparative Fit Index (CFI) = 0.90 >0.9
Incremental Fit Index (IFI) = 0.91 >0.9
Relative Fit Index (RFI) = 0.46 >0.9
Critical N (CN) = 157.81 < N
Source: Research results
From the calculation of descriptive statistics, the average of tabulated results and standard deviations are as stated in Table 2 above.
Based on the above calculation, the requirements were met: p <α and MSA > 0.5, which shows that the samples could be analyzed further.
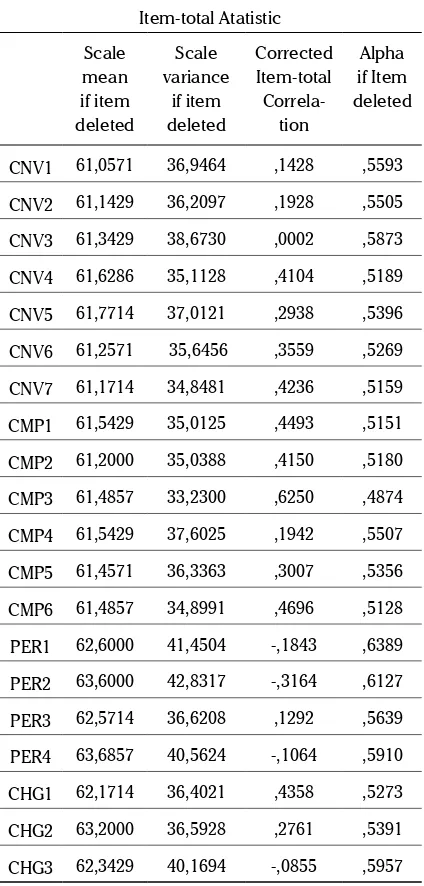
A principal component analysis was used to select factors that could be grouped if the eigenvalue> 1 and the explained cumulative percentage of variance > 50%. The significance must be <0.005. The results of reliability test using Cronbach coefficient α (alpha) in accordance with the requirements as set in Hair et al. (1998) are as Table 5.
Confirmatory Factor Analysis (CFA)
To carry out further analysis, a more complete tool or in this study the Lisrel program was used, with results as shown in the Table 6.
If we look at the results of the calculation using Lisrel, the confirmatory factor analysis produced a fairly weak correlation for several variables, as shown in the Table 7.
In the next stage, SPSS was used to carry out the analysis of factors without any factor restriction, which produced the results with 7 factors below.
Because there was not any clear grouping, reduction of factors was considered necessary to make the grouping clearer. The results of the reduction are as shown in Table 8.
Kaiser-Meyer-Olkin Measure of Sampling Adequacy.
,514
Bartlett’s Test of Sphericity
Table 4. KMO and Bartlett’s Test
Table 5. Reliability Analysis - Scale (Alpha)
Item-total Atatistic
CNV1 61,0571 36,9464 ,1428 ,5593
CNV2 61,1429 36,2097 ,1928 ,5505
CNV3 61,3429 38,6730 ,0002 ,5873
CNV4 61,6286 35,1128 ,4104 ,5189
CNV5 61,7714 37,0121 ,2938 ,5396
CNV6 61,2571 35,6456 ,3559 ,5269
CNV7 61,1714 34,8481 ,4236 ,5159
CMP1 61,5429 35,0125 ,4493 ,5151
CMP2 61,2000 35,0388 ,4150 ,5180
CMP3 61,4857 33,2300 ,6250 ,4874
CMP4 61,5429 37,6025 ,1942 ,5507
CMP5 61,4571 36,3363 ,3007 ,5356
CMP6 61,4857 34,8991 ,4696 ,5128
PER1 62,6000 41,4504 -,1843 ,6389
PER2 63,6000 42,8317 -,3164 ,6127
PER3 62,5714 36,6208 ,1292 ,5639
PER4 63,6857 40,5624 -,1064 ,5910
CHG1 62,1714 36,4021 ,4358 ,5273
CHG2 63,2000 36,5928 ,2761 ,5391
CHG3 62,3429 40,1694 -,0855 ,5957
Reliability Coefficients
Table 8. Component Matrix (a)
Table 9. Component Matrix (a)
Component
1 2 3 4 5 6 7
CNV6 ,768 -,148 ,107 -,083 -,093 -,011 ,117
CMP6 ,727 -,113 ,297 ,051 ,187 ,144 ,057
CHG1 ,724 ,134 -,051 -,003 -,007 ,189 ,142
CMP5 ,512 ,010 ,389 ,281 ,395 -,172 -,202
CNV2 ,070 ,891 -,019 -,084 ,170 ,034 ,049
CNV1 -,110 ,838 ,216 ,157 -,146 -,107 -,106
CHG3 ,121 -,683 ,324 ,214 ,106 -,153 -,099
CNV3 -,104 ,488 -,442 ,228 -,374 ,140 ,382
PER2 -,059 -,043 -,820 ,180 ,102 -,167 -,022
CNV4 ,160 -,161 ,730 ,285 ,051 -,045 ,341
CMP1 ,464 ,043 ,572 ,234 ,227 -,119 -,124
CMP3 ,155 ,434 ,463 ,339 ,170 ,401 ,306
CMP4 -,161 ,114 ,040 ,730 ,187 -,039 ,086
PER4 -,050 ,115 ,152 -,697 ,388 ,298 ,130
CNV7 ,377 -,145 ,279 ,630 -,020 ,213 ,038
PER1 -,010 ,025 -,008 ,002 -,888 -,016 -,022
CMP2 ,458 -,112 -,002 ,414 ,491 ,025 ,314
PER3 ,031 -,032 ,057 ,051 -,187 ,869 -,134
CHG2 ,260 ,126 -,008 -,216 ,323 ,725 ,018
CNV5 ,235 ,061 ,134 ,008 ,054 -,128 ,881
Extraction Method: Principal Component Analysis. Rotation Method: Varimax with Kaiser Normalization. a Rotation converged in 7 iterations
Source: Research results
Source: Research results
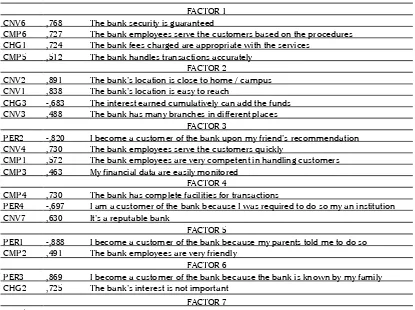
FACTOR 1 CNV6 ,768 The bank security is guaranteed
CMP6 ,727 The bank employees serve the customers based on the procedures CHG1 ,724 The bank fees charged are appropriate with the services
CMP5 ,512 The bank handles transactions accurately FACTOR 2
CNV2 ,891 The bank’s location is close to home / campus CNV1 ,838 The bank’s location is easy to reach
CHG3 -,683 The interest earned cumulatively can add the funds CNV3 ,488 The bank has many branches in different places
FACTOR 3
PER2 -,820 I become a customer of the bank upon my friend’s recommendation CNV4 ,730 The bank employees serve the customers quickly
CMP1 ,572 The bank employees are very competent in handling customers CMP3 ,463 My financial data are easily monitored
FACTOR 4
CMP4 ,730 The bank has complete facilities for transactions
PER4 -,697 I am a customer of the bank because I was required to do so my an institution CNV7 ,630 It’s a reputable bank
FACTOR 5
PER1 -,888 I become a customer of the bank because my parents told me to do so CMP2 ,491 The bank employees are very friendly
FACTOR 6
PER3 ,869 I become a customer of the bank because the bank is known by my family CHG2 ,725 The bank’s interest is not important
FACTOR 7 CNV5 ,881 It’s fun to go to the bank
Table 7. The results of running Lisrel
Put in order by the correlation between variables to see which one is the most powerful variable according to the respondents, the factors can be seen in the Table 10.
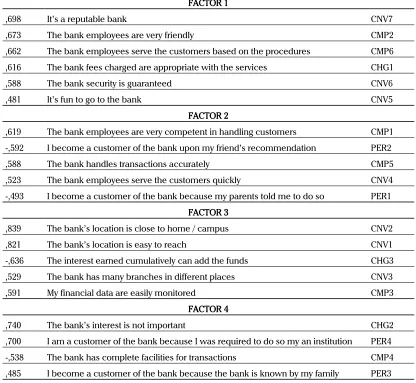
The above results could not classify the variables by factors like what have been done by previous researchers. Therefore, this research limited the grouping into four factors.
Recalculation was carried out so that the appropriate components can be entered to the factors, and the results are as shown in Table 12.
If grouped by the matrix, the dimensions can be made into the factors, can be seen in the Table 13.
The calculation result of those factors above could not classify the variables into factors as the previous studies indicated as well as the researcher preferred at the moment.
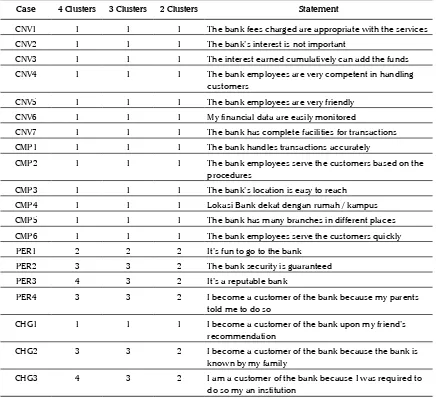
To optimize the theory put forward by previous researchers, the clustering approach was used, and it resulted a grouping which was divided in a range of 2-4 groups.
FACTOR 1
,698 It’s a reputable bank CNV7
,673 The bank employees are very friendly CMP2
,662 The bank employees serve the customers based on the procedures CMP6
,616 The bank fees charged are appropriate with the services CHG1
,588 The bank security is guaranteed CNV6
,481 It’s fun to go to the bank CNV5
FACTOR 2
,619 The bank employees are very competent in handling customers CMP1
-,592 I become a customer of the bank upon my friend’s recommendation PER2
,588 The bank handles transactions accurately CMP5
,523 The bank employees serve the customers quickly CNV4
-,493 I become a customer of the bank because my parents told me to do so PER1 FACTOR 3
,839 The bank’s location is close to home / campus CNV2
,821 The bank’s location is easy to reach CNV1
-,636 The interest earned cumulatively can add the funds CHG3
,529 The bank has many branches in different places CNV3
,591 My financial data are easily monitored CMP3
FACTOR 4
,740 The bank’s interest is not important CHG2
,700 I am a customer of the bank because I was required to do so my an institution PER4
-,538 The bank has complete facilities for transactions CMP4
,485 I become a customer of the bank because the bank is known by my family PER3 Table 13. Grouping of Factors
Source: Calculation results
Component
CMP6 ,757 The bank employees serve the customers based on the procedures CMP1 ,732 The bank employees are very competent in handling customers CMP5 ,716 The bank handles transactions accurately
CNV4 ,690 The bank employees serve the customers quickly CMP2 ,657 The bank employees are very friendly
CNV7 ,640 It’s a reputable bank
CMP3 ,568 My financial data are easily monitored CNV6 ,539 The bank security is guaranteed
CHG1 ,469 The bank fees charged are appropriate with the services
PER2 -,425 I become a customer of the bank upon my friend’s recommendation CHG3 ,409 The interest earned cumulatively can add the funds
CNV5 ,373 It’s fun to go to the bank
CNV3 -,346 The bank has many branches in different places
PER1 -,313 I become a customer of the bank because my parents told me to do so CHG2 ,275 The bank’s interest is not important
CMP4 ,204 The bank has complete facilities for transactions
PER3 ,087 I become a customer of the bank because the bank is known by my family CNV1 -,079 The bank’s location is easy to reach
CNV2 -,029 The bank’s location is close to home / campus
PER4 ,005 I am a customer of the bank because I was required to do so my an institution Extraction Method: Principal Component Analysis. a 1 components extracted.
Table 10. Component Matrix (a)
Source: Research results
Component
1 2 3 4
CNV1 -,079 ,670 ,385 -,358
CNV2 -,029 ,827 ,040 -,233
CNV3 -,346 ,578 ,355 ,454
CNV4 ,690 -,082 ,234 -,199
CNV5 ,373 ,237 ,143 ,219
CNV6 ,539 -,069 -,187 ,363
CNV7 ,640 -,037 ,307 ,248
CMP1 ,732 -,023 ,106 -,266
CMP2 ,657 ,007 ,124 ,223
CMP3 ,568 ,610 ,132 -,094
CMP4 ,204 ,090 ,606 -,036
CMP5 ,716 -,086 ,096 -,225
CMP6 ,757 ,000 -,217 ,170
PER1 -,313 ,004 ,236 ,334
PER2 -,425 -,099 ,176 ,410
PER3 ,087 ,259 -,368 ,304
PER4 ,005 ,254 -,735 -,301
CHG1 ,469 ,262 -,182 ,422
CHG2 ,275 ,404 -,626 ,151
CHG3 ,409 -,692 ,056 -,051
Extraction Method: Principal Component Analysis. a 4 components extracted.
Table 11. Component Matrix (a) Table 12. Rotated Component Matrix (a)
Source: Calculation results
Source: Calculation results
Component
1 2 3 4
CNV1 -,087 ,065 ,821 -,214
CNV2 -,015 ,053 ,839 ,181
CNV3 ,124 -,699 ,529 -,050
CNV4 ,473 ,523 -,002 -,283
CNV5 ,481 -,005 ,178 -,010
CNV6 ,588 ,090 -,240 ,225
CNV7 ,698 ,130 -,055 -,245
CMP1 ,456 ,619 ,034 -,159
CMP2 ,673 ,192 -,057 -,066
CMP3 ,523 ,308 ,591 ,055
CMP4 ,265 ,010 ,241 -,538
CMP5 ,454 ,588 -,036 -,162
CMP6 ,662 ,365 -,146 ,236
PER1 -,026 -,493 -,004 -,148
PER2 -,100 -,592 -,129 -,111
PER3 ,212 -,135 ,057 ,485
PER4 -,251 ,358 ,120 ,700
CHG1 ,616 -,038 ,057 ,339
CHG2 ,256 ,131 ,153 ,740
CHG3 ,202 ,355 -,636 -,285
Banks should reduce the pressure on potential customers or old customers who may feel obligated to use of bank services. Instead, banks need to have a marketing strategy to attract potential customers or clients to use more facilities provided by the banks. It is necessary to educate the public to use banking services for every financial transaction in accordance with the expectation of Indonesian Banking Architecture (API). People should go and use banking facilities not only because of recommendations from friends, but because they are aware of the important benefits of banks.
Contribution to the Theory
Based on the previous studies, questionnaire items can be grouped in accordance with the original plan, that is using two statistical calculation tools (software) to produce the expected results. However, in this study the use of a statistical program LISREL could not give any significance from the grouping result. The use of another statistical program or SPSS by previous researchers
by choosing the R factor analysis did not provide optimal results or the expected results either. The use of cluster analysis approach (Q factor analysis) turned out to produce a grouping close to the desired plan, that is in accordance with the research by Anderson et al. (1976) and Ta (2000) as mentioned in the theory.
CONCLUSION
Limitations to the Research
• This study did not ask if the customer provided an opinion to the statements about the services at one bank. If the customer has accounts with two banks, it is not known to which bank he/ she gave his/her opinion. (Burnham et.al, 2003)
• The study did not focus on the reason whether bank customers go to the bank for simple transactions or large-scale transactions.
• The study did not sort out whether the bank’s customers are priority customers or regular customers.
R E F E R E N C E S
Akinci, S., Aksoy, S., and Atilgan, E. (2004). Adoption of Internet Banking Among Sophisticated Consumer Segments in An Advanced Developing Country, International Journal of Bank Marketing, 22 (3), 212-32.
Aldlaigan, A. and Buttle, F. (2005). Beyond Satisfaction: Customer Attachment to Retail Banks. International Journal of Bank Marketing, 23 (4), 349-59.
Anderson, W.T. Jr, Cox, E.P. III and Fulcher, D.H. (1976). Bank Selection Decisions and Market Segmentation, Journal of Marketing, 40 (1), 40-5.
Babakus, E., Sevgin, E. and Yavas, U. (2004). Modeling Consumers’ Choice Behavior: An Application in Banking. Journal of Services Marketing, 18 (6), 462-70.
Balabanis, G. and Diamantopoulos, A. (2004). Domestic Country Bias, Country-of- Origin Effects, and Consumer Ethnocentrism: A Multidimensional Unfolding Approach. Journal of the Academy of Marketing Science. 32 (1), 80-95.
Brady, M.K. and Cronin, J. J. (2001).Some New Thoughts on Conceptualizing Perceived Service Quality: A Hierarchical Approach. Journal of Marketing, 65 (3), 34-49.
Churchill, G. A. (1979). A Paradigm for Developing Better Measures of Marketing Constructs. Journal of Marketing Research, 16, 64-73.
Cunningham, L. F., Young, C. E., Lee, M. and Ulaga, W. (2006). Customer Perceptions of Service Dimensions: Cross-Cultural Analysis and Perspective, International Marketing Review, 23 (2), 192-210.
Dupuy, G.M. and Kehoe, W. S. (1976). Comments on Bank Selection Decisions and Marketing Segmentation, Journal of Marketing, 40 (4), 89-91.
Engle, J. F., Blackwell, R. D., and Miniard, P. W. (1995). Consumer Behavior, 8th ed., Orlando, FL: The Dryden Press.
Hair, J. F., Anderson, R. E., Tatham, R. T. and Black, W. C. (1998). Multivariate Data Analysis, 5th ed., Upper Saddle River New
Jersey: Prentice-Hall International.
Kotler, P. (2008). Marketing Management, The millennium ed., Upper Saddle River, NJ: Prentice-Hall. Khazeh, K. and Decker, D. H. (1992). How Customers Choose Banks. Journal of Retail Banking, 14 (14), 41-4.
The grouping into 2-3 clusters could not optimize the grouping, but if the grouping was made into 4 clusters, the responses chosen by the respondents would be able to be grouped in accordance with the opinion of the previous researchers.
MANAGERIAL IMPLICATIONS Contribution to Decision Makers
Banking services are common for banks, but to increase the number of customers, banks need to benefit from existing customers to attract new customers. In other words, bank customers are an integral part of banking marketing. The success of old customers to attract new customers should be given appropriate compensation. The bank needs to utilize more references coming from friends who always tell the bank’s good services, and it should also benefit from the family factor since family members may go to the same bank their parents go to, so children will be accustomed to using banks as a means of learning.
Case 4 Clusters 3 Clusters 2 Clusters Statement
CNV1 1 1 1 The bank fees charged are appropriate with the services
CNV2 1 1 1 The bank’s interest is not important
CNV3 1 1 1 The interest earned cumulatively can add the funds
CNV4 1 1 1 The bank employees are very competent in handling
customers
CNV5 1 1 1 The bank employees are very friendly
CNV6 1 1 1 My financial data are easily monitored
CNV7 1 1 1 The bank has complete facilities for transactions
CMP1 1 1 1 The bank handles transactions accurately
CMP2 1 1 1 The bank employees serve the customers based on the
procedures
CMP3 1 1 1 The bank’s location is easy to reach
CMP4 1 1 1 Lokasi Bank dekat dengan rumah / kampus
CMP5 1 1 1 The bank has many branches in different places
CMP6 1 1 1 The bank employees serve the customers quickly
PER1 2 2 2 It’s fun to go to the bank
PER2 3 3 2 The bank security is guaranteed
PER3 4 3 2 It’s a reputable bank
PER4 3 3 2 I become a customer of the bank because my parents
told me to do so
CHG1 1 1 1 I become a customer of the bank upon my friend’s
recommendation
CHG2 3 3 2 I become a customer of the bank because the bank is
known by my family
CHG3 4 3 2 I am a customer of the bank because I was required to
do so my an institution Table 14. Membership Cluster
Source: Calculation results
Table 15. Grouping of Bank
Source: Calculation results
Cluster Go to a bank because... 1 Recommendation from a friend 2 My own wish
Lee, K. H., Qian, G. M., Yu, J. H. and Ho, Y. (2005). Trading Favors for Marketing Advantage: Evidence from Hong Kong, China, and The United States, Journal of International Marketing, 13 (1), 1-35.
Owusu-Frimpong, N. (1999). Patronage Behavior of Ghanaian Bank Customers, The International Journal of Bank Marketing, 17 (7), 335-42.
Parasuraman, A., Zeithaml, V. A. and Berry, L. L. (1988). SERVQUAL: A Multiple-Item Scale for Measuring Consumer Perceptions of Service Quality, Journal of Retailing, 64 (1), 12-40.
Sheth, J. (1992). Emerging Marketing Strategies in A Changing Macroeconomic Environment: A Commentary, International Marketing Review, 9 (1), 57-63.