3d Sar (Synthetic Aperture Radar) Imaging Simulation Using Java [Erfansyah Ali]
3D SAR (SYNTHETIC APERTURE RADAR) IMAGING
SIMULATION USING JAVA
Erfansyah Ali1, Andriyan B. Suksmono2
1School of Electrical Engineering, Telkom University
2School of Electrical Engineering and Informatics (STEI), Institut Teknologi Bandung 1[email protected], 2[email protected]
Abstract
One of methods in remote sensing is Synthetic Aperture Radar (SAR). When combined with Range Doppler Algorithm (RDA) can produce smaller radar resolution only by using normal sized antenna placed at platform. RDA is able to generate much wider aperture “synthetic” antenna, resulting very narrow beam-width when reach earth's ground. By using already established 2D SAR methods in accuracy and processing speed this 3D SAR simulation was developed. Simulated on 15 x 15 pixels grayscale targets at different heights, 3D SAR developed on this research can detect object's height accurately. This simulation was developed using JAVA as steppingstone in implementing SAR image processing in small system like embedded system or micro computing which normally using C programming language.
Keywords: Synthetic Aperture Radar, Range Doppler Algorithm, remote sensing, 3D, Java
1. Introduction
Synthetic Aperture Radar (SAR) offers much significant enhancement at radar image resolution without further advanced and complex processing by using antenna movement. By respecting the diffraction, a smaller antenna placed at platform will produce much wider beam when reach earth's ground or very far target.
The wider beam when reach target, the more difficult to determine from which part of target was a reflection coming from and to detect target position itself. To enhance resolution without further processing, a much wider antenna must be used to produce narrower beams when reach target so it's easier to determine target's part.
This is counter-intuitive, but due to diffraction, the rate of beam pattern is disproportional to the width of aperture. If antenna on platform move with respect to target, many beams can be sent from and received at antenna and when these reflections analysed together by coherent combination using
Range Doppler Algorithm (RDA), then it can generate an image as same as result from much wider aperture “synthetic” antenna. RDA basically use matched-filtering to generate an image of radar illuminated target by correlating received noisy raw SAR signals with ideal radar scatters as reference [1] [2].
This simulation was developed using JAVA as stepping-stone in implementing SAR image processing in small systems. As we knew SAR system normally works with a platform, UAV or satellite was moving while collecting data. After that all processing to extract SAR image from raw data were done in ground station.
2. LiteratureReview
This research started with one dimension radar range finding implementation by Lynn Kendrick [1] at 2005 as her Cal Poly Senior project. Her one dimension simulation consist only range without moving platform. This can't be referred as SAR as antenna movement can't be utilized to obtain larger “synthetic” antenna and there would be no range cell migration correction, azimuth processing phase, but matched-filter as basic filtering mechanism of RDA coded and simulated to determine range of point targets in single range direction.
A fully 2D SAR simulation and range-Doppler algorithm developed in Master Thesis of Brian Zaharris [2]. Zaharris's simulation also made use of Kalman filtering of raw SAR signal portion of the code to allow accurate imaging of limited movement of point targets at their final positions.
Paul Mason [3] used Zaharris's two dimensional RDA and adapted it for two dimensional objects like geometrical shapes and letters consist of arrays point of targets with azimuth and range of each point defined in target profile. Mason's simulation took a longer time at simulation process than Zaharris and not well documented nor user friendly. Mason also tried to implement 3D SAR imaging simulation using Zaharris two dimensional simulation as a starting point but decided to focus on two dimensional simulation regarded of time limitations.
Range
Ref Signal FFT
SAR
Raw Data Range FFT Range IFFT
Range Compressed Signal Azimuth
FFT Range
Doppler Signal RCMC
FFT Ref SignalAzimuth
Azimuth
IFFT Final ProcessedSAR Image
256 echoes and reduce raw SAR signal space to a single two dimensional double array. Then he rewrote echoes generating code to optimize the processing efficiency. Before this it would take 10 minutes to generate SAR echoes from 11 points target using Zaharris's code, therefore processing time for 16 x 16 pixels target would take more than 4 hours. With Schlutz's modification 16 x 16 pixels image would take 10 minutes to processed SAR image. Schlutz also added new feature, reflectivity for each point target based on location and intensity of imported target image [5].
At 2010, Cindy Romero [5] made improvement to 2D SAR simulation by porting code for antenna pattern and echoes generation from MATLAB to C++. Romero also tried 3D simulation using Blender, but generated SAR images resulted bad imagery and several certain points target disappeared from detection during platform motion.
3. 3DSARSIMULATION
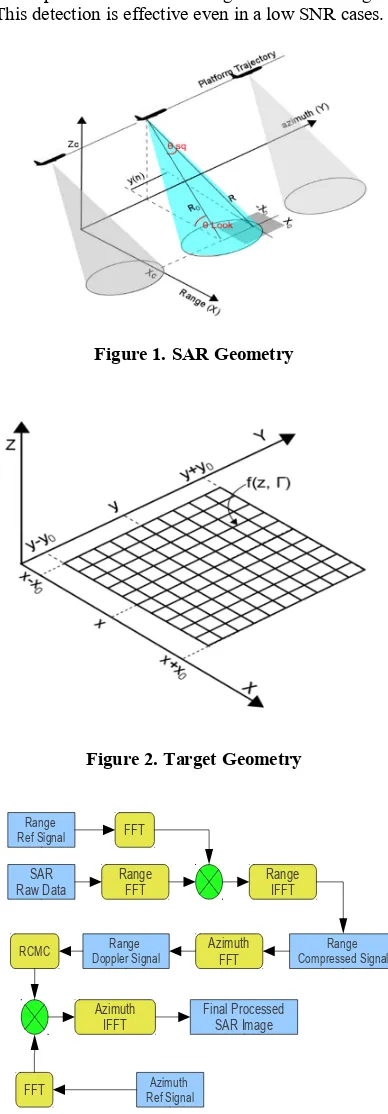
In this simulation, platform is assumed moved through orbital line along azimuth line as shown at Figure 1. Platform's range to target defined as closest range to target (R0). As in this simulation a plane used as a platform then curvature of earth is negligible and orbital velocity is approximately equal to platform velocity.
When platform moving along azimuth line, radar's beam sweeps along the ground. The part of beam touching the ground, shown as circle at Figure 1, called as beam footprint. Target in beam footprint reflect back radar signals and which are then received by antenna. These obtained radar reflections then will be processed by RDA to obtain SAR images [6] [4].
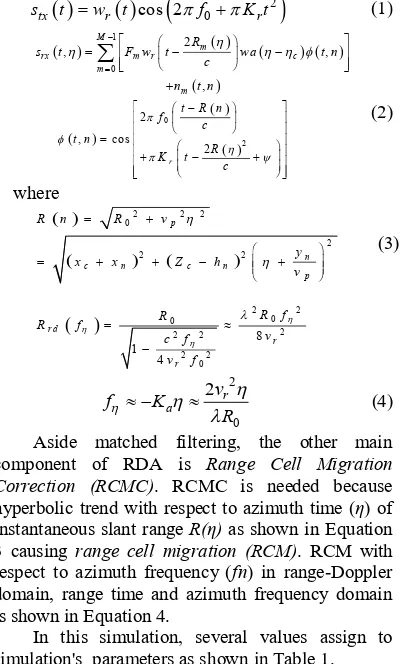
Target in this simulation is a three dimensional matrix as shown in Figure 2 where first and second dimension is point target position using Cartesian coordinates. The third dimension is an array with element length is two, where each consist information about height (z) and reflection coefficient (Г).
Target in this simulation is a three dimensional matrix as shown in Figure 2 where first and second dimension is point target position using Cartesian coordinates. The third dimension is an array with element length is two, where each consist information about height (z) and reflection coefficient (Г).
The transmitted radar signal stx(t), in simulation
assumed to be of form in Equation 1 and after reflected by target become received radar signal srx(t)
like Equation 2.
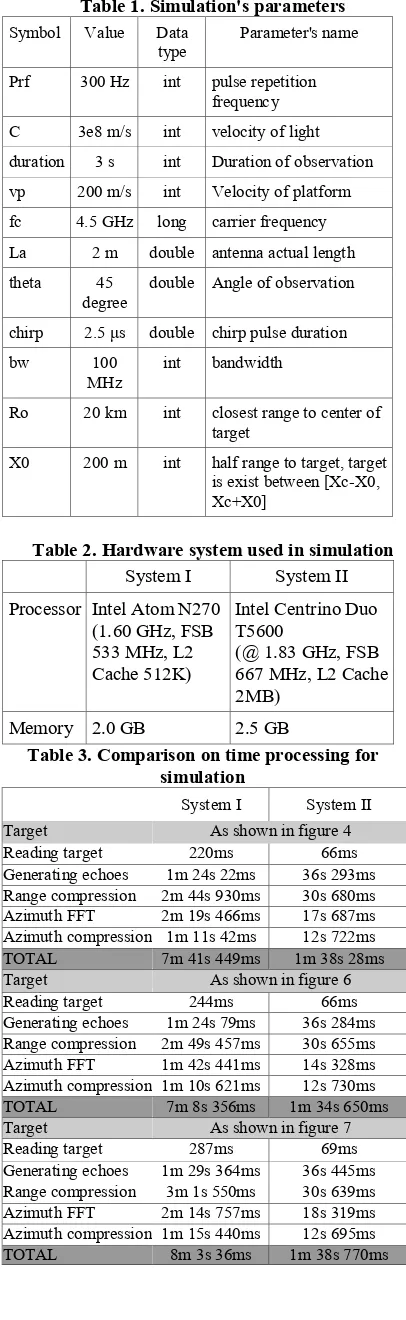
The received and demodulated radar signals of Equation 2 is referred as SAR signal space because it is still in raw form and if this two dimensional array complex plotted to two dimensional magnitude or imaginary image would not allow recognition of target. After RDA processing as shown at Figure 3 it
referred as SAR image space which this image will be used for Automatic Target Recognition (ATR) [7] [1].
Main technique of RDA is matched filtering
which a detection technique by correlation unknown received signal with a known reference signal to detect presence of reference signal in received signal. This detection is effective even in a low SNR cases.
Figure 1. SAR Geometry
Figure 2. Target Geometry
3d Sar (Synthetic Aperture Radar) Imaging Simulation Using Java hyperbolic trend with respect to azimuth time (η) of instantaneous slant range R(η) as shown in Equation 3 causing range cell migration (RCM). RCM with respect to azimuth frequency (fn) in range-Doppler domain, range time and azimuth frequency domain is shown in Equation 4.
In this simulation, several values assign to simulation's parameters as shown in Table 1.
4. SimulationAnalysis
In this simulation several targets created for detection with dimension 15 x 15 pixels and assigned different height value for each pixel. Target simulated with height 255 meters (white), 128 meters (light grey), 64 meters (dark grey) and 0 meter (black). Detail image of target is shown at Figure 4(a). Target in simulation is a grayscale image with PNG format.
If we observe furthermore, result of detection was not exactly match target but had segmented by it's height as shown in Figure 4(b) and more detail in Figure 5.
Then simulation tested to two different target, Target A and Target B, which each target have created for different purpose. Target A as shown in Figure 6(a) was a grayscale image target with dimension 15x15 pixels which consist of four 5x5 pixels dimension squares with different height for each colour representation.
Meanwhile Target B as shown in Figure 7(a) was a grayscale image target with dimension 15x15 pixels which consist of four objects with different shape and height for each colour representation.
Main purpose of test on target A and target B image was to observe whether for each object inside target image correctly detected and didn't have rotation or mirroring effect in detection.
Figure 4. Comparison between target and detection result
Figure 5. Detail of detection result
Figure 6. Simulation for Target A detection.
Figure 7. Simulation for Target B detection From detection result shown that for each detected object exactly match the target and didn't have rotation or mirroring, and for each pixel in target image correctly detected as one grid in SAR image space.
By using two hardware system as shown in Table 2, the obtained time processing for simulation as shown in Table 3.
Table 1. Simulation's parameters
Symbol Value Data
type Parameter's name
Prf 300 Hz int pulse repetition
frequency
C 3e8 m/s int velocity of light
duration 3 s int Duration of observation
vp 200 m/s int Velocity of platform
fc 4.5 GHz long carrier frequency
La 2 m double antenna actual length
theta 45
degree double Angle of observation
chirp 2.5 μs double chirp pulse duration
is exist between [Xc-X0, Xc+X0]
Table 2. Hardware system used in simulation System I System II Processor Intel Atom N270
(1.60 GHz, FSB
Table 3. Comparison on time processing for simulation
System I System II
Target As shown in figure 4
Reading target 220ms 66ms
Generating echoes 1m 24s 22ms 36s 293ms
Range compression 2m 44s 930ms 30s 680ms
Azimuth FFT 2m 19s 466ms 17s 687ms
Azimuth compression 1m 11s 42ms 12s 722ms
TOTAL 7m 41s 449ms 1m 38s 28ms
Target As shown in figure 6
Reading target 244ms 66ms
Generating echoes 1m 24s 79ms 36s 284ms
Range compression 2m 49s 457ms 30s 655ms
Azimuth FFT 1m 42s 441ms 14s 328ms
Azimuth compression 1m 10s 621ms 12s 730ms
TOTAL 7m 8s 356ms 1m 34s 650ms
Target As shown in figure 7
Reading target 287ms 69ms
Generating echoes 1m 29s 364ms 36s 445ms
Range compression 3m 1s 550ms 30s 639ms
Azimuth FFT 2m 14s 757ms 18s 319ms
Azimuth compression 1m 15s 440ms 12s 695ms
TOTAL 8m 3s 36ms 1m 38s 770ms
complex numbers calculation for FFT and the same for IFFT required about 3 minutes for System I and 30 seconds for System II. For Azimuth FFT stage with 1034x900 complex numbers calculation required abmore than 2 minutes for System I and 17 seconds for System II. The last, for azimuth compression stage with 1034x900 IFFT complex numbers calculation required about 75 seconds for System I and 13 seconds for System II.
If compared, with simulation running on MATLAB using System I, where radar echoes generation stage required 25 minutes from 27 minutes for whole process.
Then range compression, azimuth FFT and
azimuth compression stage should only require several seconds. This significant difference because MATLAB already implement FFTW which very efficient, meanwhile for this simulation only used optimized DFT Java code.
5. Conclusions
Based on simulation running for several target, then it can be concluded that height detection obtained using 3D SAR is quite accurate whew every target pixel exactly detected as one grid in SAR image space. However this simulation still have several drawbacks, which is on its detection in image space still segmented by height. The other drawback is for time processing especially for RDA stage still only implement DFT not FFT.
For next development on this 3D SAR research, need to implement additional image processing to transform detected grids on image space to be one pixel and its need to combine segmented by height layers so the images space would look exactly like target image.
Meanwhile it's also need to develop one Java class for FFT instead of DFT so time processing for RDA can be significantly faster. Or it's can be this Java class only porting FFTW code so it can be used within Java since FFTW which already known as the fastest FFT algorithm is written in C++.
References
[1] L. Kendrick, Synthetic Aperture Radar Simulation for Point Target Using MATLAB, California Polytechnic State University, 2006. [2] B. Zaharris, Two-Dimensional Synthetic
Aperture Radar Imaging and MovingTarget Tracking Using the Range Doppler Algorithm Simulated in MATLAB, California Polytechnic State University, 2006.
3d Sar (Synthetic Aperture Radar) Imaging Simulation Using Java [Erfansyah Ali] [4] M. Soumekh, Synthetic Aperture Radar Signal
Processing with MATLAB Algorithms, Wiley & Sons, Inc, 1999.
[5] M. Schlutz, Synthetic Aperture Radar Imaging Simulated in MATLAB, California Polytechnic State University, 2009.
[6] C. Romero, High Resolution Simulation of Synthetic Aperture Radar Imaging, California Polytechnic State University., 2010.