PAPER • OPEN ACCESS
Analysis of forecasting malaria case with climatic
factors as predictor in Mandailing Natal Regency:
a time series study
To cite this article: D Aulia et al 2018 IOP Conf. Ser.: Mater. Sci. Eng.300 012035
View the article online for updates and enhancements.
Related content
The prediction of the impact of climatic factors on short-term electric power load based on the big data of smart city
Yunfei Qiu, Xizhong Li, Wei Zheng et al.
-Optimal control for Malaria disease through vaccination
Said Munzir, Muhammad Nasir and Marwan Ramli
-Spatio-temporal dynamics of NDVI and its response to climate factors in the Heihe River Basin, China
C X Cheng, Z H Wang, P Q Xiao et al.
Analysis of forecasting malaria case with climatic factors as
predictor in Mandailing Natal Regency: a time series study
D Aulia1, S F Ayu2, and A Matondang3
1,3Faculty of Public Health, University of Sumatera Utara 2Faculty of Agribusiness, University of Sumatera Utara
Email : [email protected], [email protected],
Abstract.
Malaria is the most contagious global concern. As a public health problem with outbreaks, affect the quality of life and economy, also could lead to death. Therefore, this research is to forecast malaria cases with climatic factors as predictors in Mandailing Natal Regency. The total number of positive malaria cases on January 2008 to December 2016 were taken from health department of Mandailing Natal Regency. Climates data such as rainfall, humidity, and temperature were taken from Center of Statistic Department of Mandailing Natal Regency. E-views ver. 9 is used to analyze this study. Autoregressive integrated average, ARIMA (0,1,1) (1,0,0)12 is the best model to explain the 67,2% variability data in time series study. Rainfall (P value = 0.0005), temperature (P value = 0,0029) and humidity (P value = 0.0001) are significant predictors for malaria transmission. Seasonal adjusted factor (SAF) in November and March shows peak for malaria cases.1.
IntroductionMalaria cases have decreased to 18% in 2015, from 262 million cases in 2000 to 214 million cases in 2015. Most cases in 2015 occurred in Africa (88%), Southeast Asia (10%), and the Eastern Mediterranean (2%). It was estimated that there has decreased to 37% cases in 2000-2015. Malaria transmission decreased from 106 countries in 2000 to 57 countries in 2015, resulting in transmission of malaria more than 75%. Furthermore, 18 countries ere able to reduce the case of malaria to 50-75% [1].
North Sumatra Province was not categorized as the highest and lowest of Annual Paracitic Incidence (API). The province was decreased in API and has reached the target of health ministry plan’s for malaria morbidity (API) less than 1 per 1,000 risk population in 2015. Nevertheless, there are 3 regencies / cities in North Sumatera Province that have not reached national targets and have high API number. The highest prevalence of malaria with API are Mandailing Natal with 6.88%, GunungSitoli is 3.38%, and Batu Bara Regency is 1.40% [2].
2
Studies of malaria epidemics shows the relationship among climatic conditions: rainfall, temperature, and humidity. The transmission is seasonal, with the peak happens in raining season when the temperature is between 200C and 300C and the mean relative humidity is at least to 60% because of the increasing breeding sites [4].
2. Methods
The study was conducted in Health Departement of Mandailing Natal. This regency occupied in 662,070 km2 area, which is divided into 23 districts and 407 villages (definitive sub-district). According to Departement of Centre Statistic Mandailing Natal Regency, the total population of Mandailing Natal was 211.506 in 2015. The altitude area 2.145 metres and influenced by monsoon, dry and rainy season temperature, and precipitation [5]. Rainy season in Mandailing Natal starts in December to March, but dry season starts in June to September. This situation changed each year after the transition period in April to May and in October to November [6].
Data of positives malaria cases occur in January 2008 to December 2016 takes from Health Departement of Mandailing Natal. It represented the malaria cases in this research. The data for rainfall, humidity, and temperature data were taken from Departement of Centre Statistic of Mandailing Natal. E-views ver. 9 software was used for analysed this data. Stationarity data was used with auto correlation function (ACF) and partial autocorrelation function (PACF). Seasonal adjusted factor (SAF) was determined the peak of seasonal variation. The Ljung-Box was used to determining if the model was good to acted the confounding factors, forecasting of the incidence malaria cases 3. Result and discussion
3.1 Result
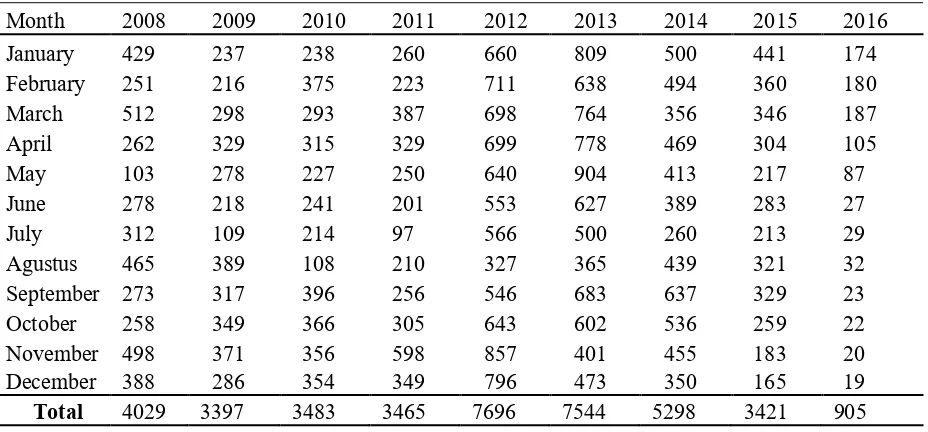
The total number of laboratory confirmed about malaria case in 2008 to 2016 is showed in (Table 1). It was increased in 2012 and 2013 as shown in Table 1. The exploration of malaria infections : rainfall, temperature, and humidity in 2008 to 2016 shown that no trend and suggestion in seasonal dependency. The autocorrelation function (ACF) was significant in peak with a lag of 12 months (autocorrelation=0.137; Box-Ljung statistics (P = 0.027), partial autocorrelation function (PACF) was significant in peak with a lag of 12.
Table 1. Malaria cases in Mandailing Natal during the research period (n=108)
(a)
(b)
4
(d)
Figure 1. Rainfall, relative humidity, and mean maximum temperature of malaria cases with in January 2008 to December 2016 (a-d)
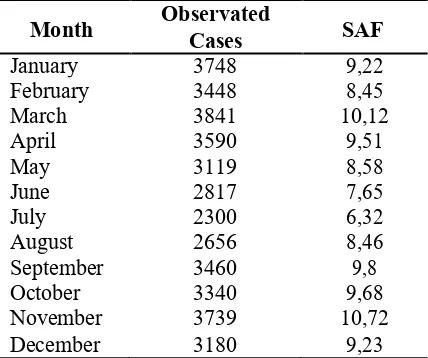
Observations have component with not seasonal variation. Table 2 shown that in November and March, the seasonal adjustment factor (SAF) was greater than other month. This period coincides with the rainy season in Mandailing Natal Regency. In November had the highest with 10,72 SAF, followed in March which is 10,12 SAF. So that the peak of malaria transmission which risk is 10,72 times and 10,12 more than typical month.
Table 2. Seasonal Adjustment Factor (SAF) for Malaria Cases
Month Observated Cases SAF
Eviews ver. 9 was the best model for forecasted malaria cases with rainfall, temperature, and humidity as predictor. ARIMA (0,1,1) (1,0,0)12 model was the best statistical for this time series study. There were three climatic factors, mean rainfall (P value = 0.005), temperature (P value = 0.0029) and relative humidity (P value = 0.001), the lagged was significant.
1,000
800
600
400
200
0
2008 2009 2010 2011 2012 2013 2014 2015 2016
obs erved fit
Figure 2. The actual and predicted of malaria
(ARIMA) model was using in this research for identificated, estimate, and forecastied. ARIMA model for seasonal was ( , , )( , , ), where and - are the autoregressive andseasonal autoregressive, respectively, and - are the nonseasonal differences and seasonal differencing, respectively, and - are the moving average parameters and seasonal moving average parameters, respectively, and represents thelength of the seasonal period
ARIMA (0,1,1) (1,0,0)12 model used for forecasting the monthly malaria for next period which in January 2017 to December 2018 that have significant predictors in rainfall, temperature, and humidity which were lagged for one month. Model of forcasted shows 701 cases in 2017 and 1890 cases in 2018 with significant peaks during rainy season (Figure 3).
Figure 3. Fluctuation of malaria cases in Mandailing Natal Regency
Table 3. Stationary of malaria case monthly
Model of malaria parameter Stationary R2 P value Model type
6
ARIMA model was the best of a time series in epidemiological surveillance for this research. ARIMA (0,1,1) (1,0,0)12 was a useful software for estimated the total malaria case for monthly in future with using the climatic factors like rainfall, temperatur, and relative humidity as predictors. These climatic was contributed because anopheles vector took two weeks to completing their life cycle and two more weeks for the generation of parasites to be a new host. Wangdi et al. Research shown that ARIMA (2,1,1) (0,1,1)12 was the best model for predicted malaria in Bhutan [9]. ARIMA model was also used for forecasting malaria cases in Sri Lanka [10] and Ethiopia [11]. Kumar et al research also taken ARIMA (0,1,1) (0,1,0) for predicted malaria in New Delhi [7].
Malaria transmission was found between in November and March. Rainy season in Mandailing Natal in December to last March. From this we can take that there is a strong correlation malaria with rainfall in Mandailing Natal with peak was occuring in March.
It was related with Widiastuti research, that rainfall have be increasing the malaria incidence in near beach of Kalianda with 48 cases every month, with highest proportion is 89% after rainfall in 7 months regularly. In Kotabumi, the malaria incidance 45 cases with rainfall 1 per month and highest proportion of 93 % after rainfall 3 months regularly. The two district with limit rainfall was 25 mm, it was explain the malaria incidence [12].
Temperature also acts significant role in malaria transmission. Temperature is expected to increase transmission and prevalence of malaria with shortening the incubation period of the parasite in the mosquitoes. Sporogonic cycles take about in 9 to 10 days at temperatures of 28∘C but higher than 30∘C and below 16∘C have negative impact on parasite development [13]. Malaria transmission also depends on relative humidity since mosquitoes have a limited range of tolerable relative humidity. The high surface area to ratio volume of mosquitoes makes them especially sensitive to desiccation in low humidity levels [14].
Transmission of malaria will happen in the relative humidity is at least 60% as one of predictor. The research of Mofu showed that there was relationship between Anopheles density and humidity, where the correlation results p = 0.002 with average humidity at the time of the study was 82.6%. The highest density of Anopheles (4.1 head / person / hour) in humidity was 85.3% and the lowest was 1.0 / person / hr at 78.5% and 76.0% air moisture with average humidity when the study was 82.6% [15].
There were many factors such as the type of parasite, movement, immunity for malaria, resistance of insecticide that can contributed for malaria case.
4. Conclusion and recommendation
4.1 Conclusion
Based on the research, rainfall, temperature and relative humidity are predictors and have strong correlations with malaria cases in Mandailing Natal. ARIMA in time series study is the best model for this research to predict malaria case monthly, annually and will happen in next year.
4.2 Recommendation
References
[1] WHO 2015 World Malaria Report 2015 (Prancis : World Health Organization)
[2] Health Office of North Sumatera 2016 Prevention of Malaria Diseases Report 2015 (Medan Health Office of North Sumatera)
[3] Gomez E, Otero, Van H, and Aguirre J 2007 Malaria Journal 6 (1) 129 [4] Gillies T 1988 Principles and Practice of Malariology 453–485 (Scotland)
[5] Prevention Center office of Mandailing Natal Regency 2016 Malaria Profile of Mandailing NatalRegency 2015
[6] Goverment of Mandailing Natal Regency 2014 Medium Term Development Plan of Mandailing Natal Regency 2011-2016
[7] Kumar, Mangal A, and Singh S 2014 Malaria Research and Treatment in Delhi 482851 (6) [8] Helfenstein U 1991 International Journal of Epidemiology 20 (3) 808
[9] Wangdi, Singhasivanon P, and Kaewkungwal J 2010 Malaria Journal 9 251 [10] Vounatsou P, Galappaththy G, and Amerasinghe P, 2008 Malaria Journal 7 (76)
[11] Abeku A, De Vlas S, and G. Borsboom 2002 The American Journal of Tropical Medicine and Hygiene, 7, (10) 851
[12] Widiatusti 2009. IPB Journal Institution of Agricultur Bogor. [13] Craig M, Snow R, and Sueur D 1999 Parasitology Today, 15 (3) 105 [14] Yamana T and Eltahir E 2013 Parasites & Vectors 9 235