Optimizing application rate of nitrogen, phosphorus and
cattle manure in wheat production: An approach to determine
optimum scenario using response-surface methodology
Mohsen Jahan
1*, Mohammad Behzad Amiri
21Associate Prof. of Agroecology, Ferdowsi University of Mashhad, Faculty of Agriculture, P.O. Box 91775-1163, Mashhad, Iran. 2Assistant Prof. of Agroecology, Dep. Plant Production Engineering, Gonabad University, Khorasan Razavi, Iran. *Corresponding author: [email protected]
Abstract
Optimal application rates of inorganic nitrogen (N), phosphorus (P) and cattle manure were estimated using Response Surface Methodology (RSM). A Central Composite Design (CCD) was conducted at ield level dur -ing 2012-13 and 2013-14 grow-ing seasons. The applied levels of N were 0, 150 and 300 kg N ha-1 in form of
urea. The levels used for P fertilizer were 0, 100 and 200 kg ha-1 (P
2O5) and for cattle manure were 0, 15 and 30 t ha-1. Both seed yield (SY), biological yield (BY) were measured at harvest time. N loss (NL) and Agronomic
N Use Eficiency (ANUE) were calculated based on other measurements. Increasing N and P rates up to 200 kg ha-1 increased SY. Optimization of N, P and manure application amount was based on economic, environmental
and eco-environmental scenarios. Under economic scenario, using 145.4 kg ha-1 N, 200 kg ha-1 P and 18.4 t
ha-1 manure resulted in 6500 kg ha-1 SY with ANUE of 10.49. For environmental scenario, by N application of
21.2 kg ha-1, no application of P and applying 16.3 t ha-1 manure, SY and ANUE of 3160 kg ha-1 and 9.08 were
obtained, respectively. Using eco-environmental scenario, by applying 144.7 N and 34.3 kg ha-1 P, plus 30 t ha-1
manure, about 4031 kg ha-1 SY and a considerable high ANUE of 16.5 were recorded. The results of this study
showed that the privilege of eco-environmental scenario compared to the other scenarios was mainly due to higher ANUE.
1. Introduction
Higher required production of wheat has intensiied consumption of agrochemicals that in turn have re -sulted in negative impacts on environment. Sustain -able and suficient food production is a necessity that simultaneously should consider social, economic and environmental aspects. The irst step to achieve this goal is optimization and improvement of resources use eficiencies (Gliessman, 1998). It is reported that up to 50 percent of applied nitrogen would drift from agricultural systems as gaseous compounds and other types of activated nitrogen (Jarvis et al., 2011; We-ligama et al., 2010). At the high level application of P (more than 200 kg ha-1), up to 90% of phosphorous
fertilizers would be ixed in soil together with metallic elements as insoluble forms which inally lead to fur -ther phosphorus pollution (Adesemoye et al., 2009). In many crops, low absorption eficiency of fertil -izers, is the main reason of leaching, volatilization and diffusion of soluble chemical fertilizers easily released to soil and air (Akiyama et al., 2000). It has been reported that between 18-41 percent of applied nitrogen retain in soil after crop harvesting (Fageria, 2014). Nitrogen losses occur in various ways as am -monium volatilization in lime soils (10-70%), denitri -ication (9-22%) and leaching (14-40%) (Doberman & Cassman, 2004).
Wheat crop shows a strong positive correlation be -tween productivity and NPK fertilizers (Hawkesford & Barraclough, 2011; Osborne, 2007). On the other hand, applying organic fertilizers in integration with chemical ones could be an eficient management practice to reduce application rate of chemical fertil-izers and subsequently reduce their negative impacts on environment. Moreover, improved nutrient bal -ance in soil and plant, enh-ance crop productivity and yield stability in intensiied cultivation. Synchrony between application time and crop nutrient demand,
is an important factor, which reduce nitrogen losses (Gastal & Lemaire, 2002). Thus integrated use of slow release organic fertilizers such as manure could reduce N losses during crops cultivation (Emilsson et al., 2007). In arid and semi-arid regions, N deiciency
occurs faster than other nutrients and usually is due to low level of soil organic matter. It seems necessary to design cropping systems with high nutrient uptake and utilization eficiencies (Fageria, 2014; Cassidy et al., 2013) considering global high demand for ce-real in coming future. It is suggested to increase the mean eficiency of N utilization by 0.1-0.4 % annu -ally (Doberman & Cassman, 2005). Improving N use eficiency, increases economic return and reduces the potential of environmental pollution (Fageria, 2014). To reach such goals, research priorities might be shift-ed from maximizing yield to developing methods for optimization of nutrients application.
Response Surface Methodology (RSM) was irst intro -duced as optimization method for industrial use (My-ers and Montgomery, 1995) however; this methodol -ogy could also be used in fertilizer optimization. Central Composite Design (CCD), which is the most popular RSM design, was implemented to design a series of tests with least number of experiments. This approach tries to investigate the effect of parameters involved (i.e. contact time, dosage, pH, initial concentration) on responses in a cost- and time-effective way. The CCD makes it feasible to observe the possible interaction of the parameters and their inluences used RSM methodology to optimize N, water and plant density in canola cultivation. reported that the application of 93.48 kg N ha-1 based on eco-envi
This study was aimed to optimize the chemical and organic fertilizer use in winter wheat production and determine the best applicable scenario in Kashaf-rood watershed in northeast of Iran. It has also been stud-ied the application trend of different N, P and cattle manure levels and their effects on wheat production. Furthermore, the effectiveness of manure compared to chemical fertilizer was studied based on NUE and wheat yield improvement.
2. Material and Methods
2.1. Site description
Field studies conducted during 2012-13 and 2013-14 growing seasons at the Research Station of Agricul-ture Faculty, Ferdowsi University of Mashhad, Iran (latitude: 36° 15¢ N; longitude: 59° 28¢ E; elevation: 985 m above sea level). Experiment station was lo -cated in Kashaf-rood watershed in northeast of the country in a semi-arid region with mean annual pre-cipitation of 252 mm and temperature of 15 °C.
Soil depth (cm)
Soil properties 0-15 15-30
Total N (%) 0.078 0.065
Available P (ppm) 19 15
Available K (ppm) 380 372
C/N 12.8 12.3
pH (saturation extract) 7.7 7.5
EC (dS m-1) 1.3 1.3
Water storage capacity (%) 22.3 20 Bulk density (g cm-3) 1.34 1.41 Texture grade Loamy-silt Loamy-silt
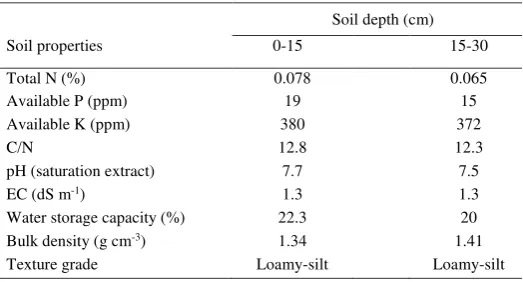
Soil samples were taken from 0-15 and 15-30 cm depths and analyzed for some physiochemical prop-erties before beginning the experiment (Table 1). To determine soil nitrogen content, soil sampling was repeated at the end of growing season.
2.2. Experimental design
CCD (sometimes called Box-Behnken design) with two replicates was used for itting response surface to experimental data (Tawik et al., 2017). Two years data where subjected to combined analysis after en-suring uniformity of the error mean squares. The re-sults of combined analysis indicated that year × treat-ment interaction was not signiicant (P >0.05), there -fore the two years data were joined be-fore exposing to response surface analysis.
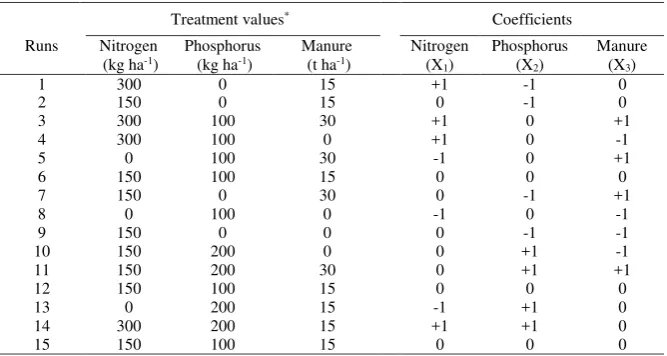
The experimental factors were the combination of different amounts of nitrogen, phosphorus and cattle manure. The total number of experimental runs for a 3-factor CCD is 15 including 12 factorial points and 3 replications for center points.
By conducting CCD, it is possible to obtain all in-formation from the least operational practices due to distribution of experimental points through treatments conined. The design points were deined based on the low and high levels of N (0, 300 kg ha-1), P (0, 200
kg ha-1) and manure (0, 30 t ha-1) (Table 2). The N, P
and K content of manure were determined as 1.18%, 0.29% and 1.04%, respectively. The high and low levels of manure were determined based on nutrient content and local recommendations.
Coefficients
Table 2. Actual and coded values of expeimental factors for CCD.
* +1, -1, and 0 indicates up, down and medium level of each factor
A normality test was already performed and transfor-mation was also performed for numerical data where needed. To ensure uniformity of treatment variances, the Bartlett's test was used. Since there was no statis-tical difference between both years of data, the mean value of each trait was reported. Data analysis and graph plotting were performed using Minitab® Statis-tical Software Ver. 16.1.1, and Microsoft Excel Ver. 14
2.3. Crop management
Plots of 3 × 4 m with a distance of 1 meter be-tween, to avoid nutrients mixing due to irrigation, were prepared. Each plot consists of 6 rows that
2.4. Measurements
Each plot was partitioned into two sections, one for seed yield and its components and the second sec-tion used for destructive time series sampling during the crop growth season. Before the inal harvest, 5 plants from each plot were randomly selected and the number of fertile tillers was recorded. Seed yield was determined from 4 m2 of each plot which was
kept untouched, considering marginal effect. The air dried plants were weighed and biological yield (dry matter yield), seed yield and harvest index were also measured.
The N contents in plant tissue were measured using AOAC Oficial Method by a Kajehldal Semi Auto -mated Distillation Unit (Horwitz & Latimer, 2005). The total N was determined for each soil plot (AOAC oficial method 968.06 (4.2.04)). Nitrogen loss was calculated using Equation 1 (Jarvis et al., 2011):
) soil + N plant (N – tilizer fer + N initial = N loss
N Eq.1
Where, Nloss: nitrogen loss (kg m-2), N
initial: soil avail
-able nitrogen content at the early season (kg m-2)
which was calculated by: NTotal End ×0.03
0.03= availability coeficient of total N in soil (as mineral for crop use) (Fageria, 2014).
Nfertilizer: applied nitrogen (kg m-2), N
plant: plant nitrogen
content at the end of season, and Nsoil: the available ni -trogen content in soil after inal harvest (kg m-2) which
was calculated as: NTotal End ×0.03.
Agronomical nitrogen use eficiency (ANUE, kg Grain/kg Nfertilizer) was calculated using Equation 2
(Rathke et al., 2006):
YGrain: seed yield (kg m-2)
To determine relative water content (RWC) of leaves, the samples were prepared between 9:00 to 10:00 AM at lowering stage. The samples were submerged in distilled water for 6 hours and then turgor weight was measured and their dry weight were also recorded in after drying samples in 75 oC in oven. Finally RWC
was calculated using Equation 3 (Kramer, 1988): Eq.2
( )
( )
FW DW
RW C
TW DW
− =
− Eq.3
2.5. Statistical analysis
Response of measured variables (y) to experimental factors (X) was estimated using second order polyno-mials including the interaction (Equation 4):
2 0
1 1
m m m
i i i j i j ii i
i i j i
y β βX β X X β X
= < =
= +
∑
+∑
+∑
Eq.4Where b0 is constant and bi, bij and bii are coeficients for linear, interaction and quadratic terms, respec-tively.
The result was a second order polynomial which de-scribes the estimated of response (yield) as a func-tion of inputs variables. Finally, after optimizing the resulted function and eliminating the low effect terms using statistical tests and criteria such as, F test, lack of it test, coeficient of determination (R2),
a inal function was calculated to predict yield and other expected variables as below (Equation 5):
Grain
initial fertilizer
Y
A NUE
N
N
=
2 2 2
0 1 1 2 2 3 3 4 1 5 2 6 3 7 1 2 8 1 3 9 2 3
Y
=
a
+
a X
+
a X
+
a X
+
a X
+
a X
+
a X
+
a X X
+
a X X
+
a X X
Eq.5In this function, Y is dependent variable, X1 is N
fer-tilizer, X2 is P fertilizer, X3 is manure, and a0 to a9 are coeficients. The equation is only functional in the de -ined range of input variables and would not predict the values out of the range.
The optimized rates of N, P and manure determined three scenarios including: economic, environmental and eco-environmental, in which seed yield, N loss, NUE and N loss were the main determining factors, respectively.
Response-surface methodology was used to obtain the optimized levels. Finally, the itted values compared to observed ones and validity of regression models were evaluated by Root Mean Square Error (RMSE) (Equation 6) and 1:1 regression line.
2
The RMSE percentage states the different be-tween predicted versus observed values. When RMSE<10%, prediction power of the used model is excellent, if RMSE<20%, prediction power of model is good, if RMSE<30%, it is considered as a poor prediction (Myers & Montgomery, 1995).
3. Results
The results for analysis of variance of the full qua -dratic regression for dependent variables have been presented in Table 3. The dependent variables were: seed yield, biological yield, fertile tiller numbers, RWCL, N loss and NUE. The seed yield linear effects for N and P were signiicant at 5%, and 1% probabil -ity level, respectively (data not shown).
Response Variables Fertile Tiller
numbers
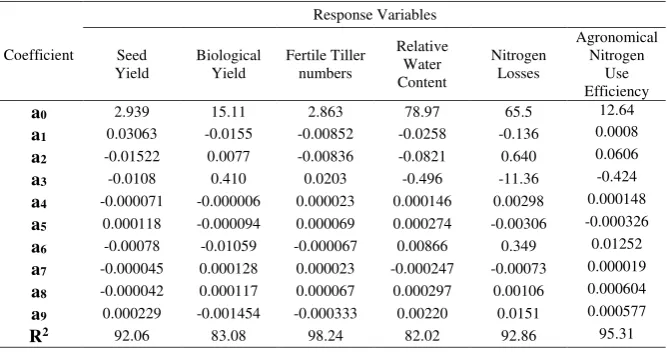
Table 3. Regression coeficients of the itted model.
X1 , X2 and X3 indicates independent variables: nitrogen fertilizer, phosphorus fertilizer and manure, respectively.
2 2 2
0 1 1 2 2 3 3 4 1 5 2 6 3 7 1 2 8 1 3 9 2 3
The second order effect was also signiicant for N × N and P × P on seed yield (P ≤0.01), fertile tiller numbers (P ≤0.01) and NUE (P ≤0.05). However, the interaction of N×P×manure was signiicant only for the number of fertile tiller (P ≤0.01). The lack of it of the regression model was not signiicant for the all studied traits .The regression coeficients of the itted models for the studied traits have been presented in Table 3. The high coeficient of determination is in -dicated that the variances of the dependent variables were properly described by the full quadratic model used for response surface analysis (Table 3).
3.1. Seed Yield
The low RMSE indicated a good prediction ability of the model. Moreover, there was no signiicant differ
100
2 00
3 00 3
0 4
0 0 1
0
200 5
6
d (t/ha) l e i y d e e S
s l e v e l
P (kg/ha) )
a h / g k ( N le ve ls
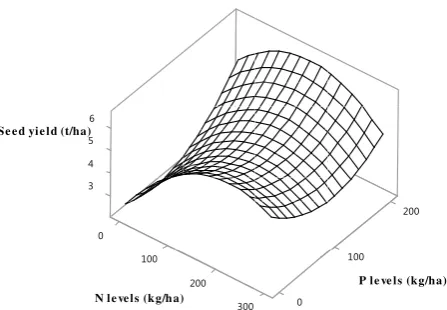
Figure 1. Response surface of wheat seed yield in different nitrogen and phosphorus fertilization at the constant level of 15 t ha-1 of manure.
ence between slope and intercept of regression line compared to the 1:1 line (RMSE= 7.34; R2= 0.92).
The lowest SY (2350 kg ha-1) obtained from the
ap-plication of 0 kg ha-1 N, 100 kg ha-1 P and 30 t ha-1
manure.
There was no signiicant N × P interaction effect on the SY. At any level of P fertilizer, SY response to N showed a quadratic trend with maximum yield achieved at 150 kg N ha-1. However, the highest re
-sponse of seed yield to P fertilizer was obtained at the highest level (200 kg P ha-1) and as a result the
maximum SY was observed by application of 150 and 200 kg ha-1 N and P, respectively, while applied
manure was 15 t ha-1 (Figure 1). At any level of N,
seed yield response was highest at high level of P (200 kg ha-1). At high level application of N (300 kg
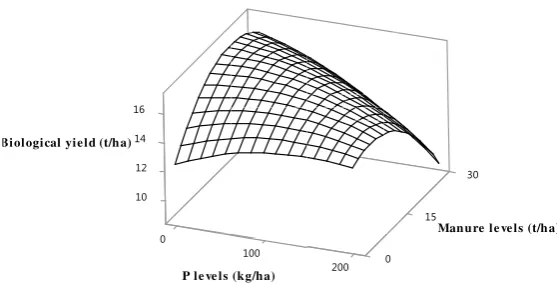
3.2. Biological Yield
Interaction effect of P ×M was signiicant (P≤0.05) for BY (data not shown). At the high level of P fertiliza -tion (200 kg ha-1), BY response to manure followed a
diminishing return and decreased when applied ma-nure levels were above 15 t ha-1. At no application of
P, the highest BY was obtained when the maximum manure level (30 t ha-1) was applied (Figure 2).
0
1 00 10
12 4 1
0
0 0 0 2
5 1
30 6
1
e ld (t/ha) i y l a c i g o l o i B
v e l e r u n a
M els(t/ha)
) a h / g k le v P e ls (
Figure 2. Response surface for biological yield in different phosphorus and manure fertilization at the constant level of 150 kg ha-1 of nitrogen.
3.3. Fertile tiller numbers
Increasing the application of both N and P, resulted in increased fertile tiller number per plant (not shown). The positive effect of N on plant growth only hap -pens when adequate amounts of the other nutrients is available.
3.4. Relative Water Content (RWC)
RWC of leaves was positively related to the manure level, however, RWC negatively responded to the P application rate (not shown). RWC was dropped be-low 60% at the P rates higher than 200 kg ha-1 but
this response was moderated by increasing manure application. Apparently, with increasing P application a higher leaf expansion was taken place which was in turn led to the lower RWC. However, positive effects of manure on soil water retention is provided enough amount of water for sustaining leaf growth while keeping RWC at optimized level.
3.5. Nitrogen loss
0
0 5 1 0
0 4
-2 - 00
0
00
0 300
5 1
30 0
0 2
e s (kg/ha) s s o l N
v e l e r u n a
M els(t/ha)
) a h / g k le
N ve ls (
Figure 3. Response surface for nitrogen losses of different nitrogen and manure fertilization levels at constant level of 100 kg ha-1 of phosphorus.
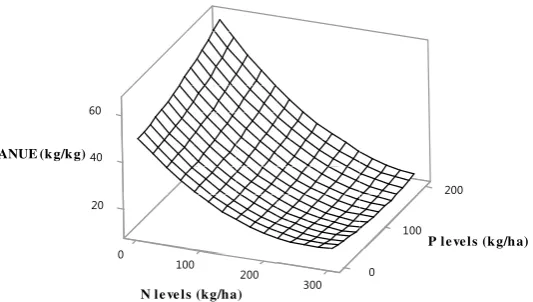
3.6. Agronomical Nitrogen Use Eficiency (ANUE)
ANUE decreased as a result of increasing in nitrogen and phosphorus application levels, although this in -creasing slope was higher at the mid level of P than of the low and the high levels (Figure 4).
The low RMSE (8.51; R2= 0.92) for regression line of
the itted versus observed values for NUE indicated the goodness of it of the model. Moreover, no signii -cant difference was observed between regression line
slope and intercept compared to the slope and in-tercept of 1:1 line (not shown).
RMSE values for response variables (6.35, 8.98 for BY and NL, respectively) showed goodness of fit of the related models (data not shown), moreover, coefficients of determination in respected models (0.92; 0.81; 0.92 and 0.92 for SY; BY; NL and ANUE, respectively) were confirmed the goodness of fit of the models.
0
100 200 20
40
0
0 300
100 0 0 2 60
ANUE (kg/k )g
) a h / g k ( s l e v e l P
) a h / g k ( s l l N e ve
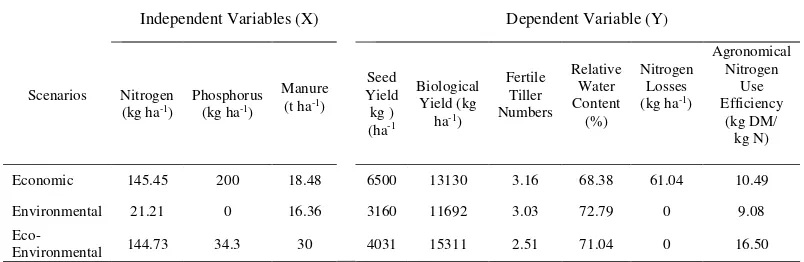
3.7. Resource Optimization
Optimization of nitrogen, phosphorus and manure fertilization were conducted according to the three scenarios of economic, environmental and eco-en -vironmental. Under economic scenario, wheat seed
yield was considered as the main determining factor for resource optimization. The result showed that ap-plication of 145.4 kg ha-1 N, 200 kg ha-1 P and 18.4
t ha-1 manure, could achieve a seed yield of about
6500 kg ha-1 and a biological yield around 13130 kg
ha-1 (Table 4).
Dependent Variable (Y)
Independent Variables (X)
Agronomical
Table 4. Optimized values of nitrogen, phosphorus fertilizers and manure application for reaching the dependent variables based on evaluated scenarios.
Under eco-environmental scenario, the determining factor for optimizing resource was considered as NL. The main objective of this scenario was reduction of environmental hazards resulted from high rates appli -cation of N, P and possibly manure, so, the economic yield had less importance. According to this scenario, N application by 21.2 kg ha-1 with no application of
P, plus 16.4 t ha-1 of manure, minimized the NL (0 kg
ha-1). Considering the optimized amount of resource
use in this scenario, seed yield, biological yield and ANUE were estimated about 3160 kg ha-1, 11692 kg
ha-1 and 9.3 kg DM/kg N, respectively (Table 4).
Under environmental scenario, the main determining factors for optimizing resource, were ANUE, NL and seed yield. Application of 144.7 and 34.3 kg ha-1 of
N and P, and 30 t ha-1 of manure resulted in the seed
yield about 4031 and the biological yield of 15311 kg ha-1, which showed 36% increase of ANUE compared
to the economic scenario (16.50 vs. 10.49).
4. Discussion
Increased seed yield by higher levels application of fer -tilizers in the present study is in agreement with other studies. Osborne (2007) reported a positive and strong correlation between available N in soil and spring wheat seed yield. Seguel et al. (2016) reported the plant growth in acidic soil is limited by low levels of avail -able P and the high presence of phytotoxic aluminum (Al3+), which causes deleterious effect on plant
by wheat genotype/growth stages interaction and ar -buscular mycorrhiza spores and P-ase activity were affected by wheat cultivar. Moraghebi et al. (2011) reported that increasing of N levels from 0 to 100 kg ha-1 resulted in higher seed yield, protein
percent-age and biomass of wheat crop. Hatield and Prueger (2004) reported that N fertilizer increased the yield of wheat seed through increasing seed numbers in spike and 1000 seeds weight. Mahmood et al. (2017) found a signiicant and positive correlation (R2= 0.52, 0.91
and 0.55) among maize grain yield and available N, P and K content, in soil.
Higher levels of manure in soil usually lead to low pH (Mahmood et al., 2017). On the other hand, P avail -ability is highly dependent on soil pH (Mengel and Kirkby, 2001). It is widely accepted that the maxi -mum P availability in the soil come through in pH range of 6.5-7.5 which meets the optimal needs of many plants. The soil temperature, CEC, and pH de-termine the availability of nutrients in the soil. Since pH levels control many bio-chemical processes that take place in the soil- speciically, plant nutrient avail -ability- it is vital to maintain proper levels for plants to reach their full yield potential.
It could be explained that at high application rate of manure (30 t ha-1), BY decreased at highest P
fertil-izer level due to pH limitation on P availability. Shah et al. (2016) reported increased dry matter of maize by application of manure. Organic matters, including cattle manure improve physiochemical properties of the soil mainly through buffering the pH. Hussain et al. (2016) reported the P application had signiicant effect on dry matter and other yield components of wheat. Sandana and Pinochet (2016) reported that there were differences between wheat, pea and lu-pin regarding their sensitivity to P deiciency and the strategies that these species developed to acquire P from soil. They also suggested considering these
dif-ferences could help improve fertilizer management strategies and optimize soil P use.
avoid N-losses, the rate of nitrogen application should be recommended according to the applied manure. It is well known that ANUE decreases with the incre -ment of N availability, (Dordas, 2011). Marino et al. (2004) reported that wheat NUE decreased by 60% (44.2 to 17.6 kg DM/kg N) when nitrogen applica -tion increased from 50 to 250 kg ha-1. Moraghebi et
al. (2011) reported that by increasing N application (0 to 160 kg ha-1 of pure N), seed yield was increased
but NUE and physiological nitrogen eficiency were signiicantly reduced.
As the law of diminishing returns states that in a pro-duction process, as one input variable is increased, there will be a point at which the marginal per unit output will start to decrease, holding all other factors constant, the NUE was not necessarily improved as a result of increased N application.
5. Conclusion
The results of this study showed that, N and P fer-tilizers which were used for wheat production have not relected the actual needs of wheat. In this experi -ment, application of 30 t ha-1 of manure under
eco-environmental scenario caused high availability of N, P nutrients for plant, and improved crop productivity. Moreover, trapped and retained nutrients in manure matrix that is considered as an ecofriendly and low cost input that improved the effectiveness of chemical fertilizer.
Manure applying along with application of N and P fertilizers, open new perspectives to develop opportu -nities for organic fertilizers that could retain crop pro-ductivity at same level when chemical fertilizers are applied. Moreover, the use of manure is ecofriendly, low costs and enrich soil fertility. Considering the re-sults, it seems that for the winter wheat production, the eco-environmental scenario had more advantages than other scenarios. Conducting this scenario in long
term can be promoting environment health, moreover promises sustainable production of wheat.
Acknowledgements
Financial support from Ferdowsi University of Mash -had (Grant no. 19800) is gratefully acknowledged. We thank Prof. G. Shahande and Dr. M. Mamarabadi for editing corrections.
References
Adesemoye, A.O., Torbert, H.A., Klopper, J.W. 2009. Plant growth promoting rhizobacteria allow re-duced application rates of chemical fertilizers. Microbial Ecology. 58, 921-929.
Akiyama, H., Tsuruta, H., Watanabe, T. 2000. N2O
and NO emission from soils after the application of different chemical fertilizers. Chemosphere - Global Change Science. 2, 313-320.
Cassidy, E.S., West, P.C., Gerber, J.S., Foley, J.A. 2013. Redeining agricultural yields: from tones to people nourished per hectare. Environ. Res. Lett. 8, 1-8.
Davis, J.G., Westfall, D.G., Mortvedt, J.J., Shanahan, J.F. 2002. Fertilizing winter wheat. Agronomy Journal. 84, 1198-1203.
Doberman, A., Cassman, K.G. 2004. Environmental dimensions of fertilizer N: What can be done to increase nitrogen use eficiency and ensure global food security? p. 261-278. In: A.R. Mosier et al. (ed.) Agriculture and the nitrogen cycle: assessing the impacts of fertilizer use on food production and the environment. SCOPE 65. Island Press, Washington, D.C.
Dordas, C.A. 2011. Nitrogen nutrition index and its relationship to N use eficiency in linseed. Europ. J. Agronomy. 34, 124-132.
Emilsson, T., Brendtsson, J.C., Mattsson, J.E., Rolf, K. 2007. Effect of using conventional and con -trolled release fertilizer on nutrient runoff from various vegetated roof systems. Ecological Engi -neering. 29, 260-271.
Fageria, N.K. 2014. Nitrogen Management in Crop Production. New York: CRC Press.
FAO Country Proiles for IRAN. 2014.
FAO Statistical Yearbook: World Food and Agricul -ture. 2013.
FAO. 2012. The State of Food and Agriculture 2012 - Investing in Agriculture for a Better Future, FAO, Rome, Italy.
Gastal, F., Lemaire, G. 2002. N uptake and distribu -tion in crops: an agronomical and ecophysiologi-cal perspective. Journal of Experimental Botany. 53, 789-799.
Gliessman, S.R. 1998. Agroecology: Ecological Pro -cesses in Sustainable Agriculture. CRC Press. Hatield, J.L., Prueger, J.H. 2004. Nitrogen over-use,
under-use, and eficiency. Crop Science. 26, 156-168.
Hawkesford, M.J., Barraclough, P. 2011. The Basis of Nutrient Use Eficiency in Crops. WILEY-BLACKWELL, USA. ISBN: 978-0-8138-1992-1. Horwitz, W., Latimer, G.W. 2005. Oficial Methods
of Analysis. Association of Oficial Analytical Chemists (AOAC), 18th Edition. Maryland, USA.
Hussain, Z., Khattak, R.A., Irshad, M., Mahmood, Q., An, P. 2016. Effect of saline irrigation water on the leachability of salts, growth and chemical composition of wheat (Triticum aestivum L.) in saline-sodic soil supplemented with phosphorus and potassium. Journal of Soil Science and Plant
Jarvis, S., Hutchings, N. Brentrup, F. Olesen, J.E., Van Der Hock, K.W. 2011. Nitrogen lows in farming systems across Europe. In: Sutton, M.A., Howard, C.M. Erisman, J.W. Billen, G. Bleeker, G. Gren -nfelt, A. Grinsven, H.V. and Grizzetti, B. (Eds.) The European Nitrogen Assessment: source, ef-fects and policy perspectives 2011. Cambridge University Press. Part III, Chapter 10.
Kramer, P. 1988. Measurement of plant water status: Historical perspectives and current concerns. Ir -rigation Science. 9, 275-287.
Mahmood, F., Khan, I., Ashraf, U., Shahzad, T., Hus -sain, S., Shahid, M., Abid, M., Ullah, S. 2017. Ef -fects of organic and inorganic manures on maize and their residual impact on soil physico-chemi-cal properties. Journal of Soil Science and Plant Nutrition. 17, 22-32.
Marino, M.A., Mazzanti, A., Assuero, S.G., Gastal, F., Echeverria, H.E., Andrade, F. 2004. Nitrogen dilution curves and nitrogen use eficiency during winter-spring growth of annual ryegrass. Agrono-my Journal. 96, 601-607.
Martinez-Lagos, J., Salazar, F., Alfaro, M., Rosas, M., Macias, F. 2015. Nitrogen mineralization in a silandic andosol fertilized with dairy slurry and urea. Journal of Soil Science and Plant Nutrition. 15, 60-75.
Mengel, K., Kirkby, E.H. 2001. Principles of plant nutri -tion. Kluwer Academic Publishers, Boston. 849pp. Moraghebi, F., Akbari, M., Hooshmanfar, A. 2011.
The effects of amount and time of nitrogen ap-plication on seed protein content and nitrogen use eficiency of wheat under Saveh conditions. Quar -terly of Plant and Ecosystem. 7, 65-76.
Osborne, S.L. 2007. Utilization of existing technol -ogy to evaluate spring wheat growth and nitrogen nutrition in South Dakota. Communication in Soil Science and Plant Analysis. 38, 949-958. Rathke, G.W., Behrens, T., Diepenbrock, W. 2006.
Integrated nitrogen management strategies to improve seed yield, oil content and nitrogen efi -ciency of winter oilseed rape (Brassica napus L.): A review. Agriculture, Ecosystems and Environ -ment. 117, 80–108.
Sandaña, P., Pinochet, D. 2016. Phosphorus acquisi-tion of wheat, pea and narrow-leafed lupin under different P supplies. Journal of Soil Science and Plant Nutrition. 16, 537-549.
Schlemmer, M.R., Francis, D.D., Shanahan, J.F., Schepers, J.S. 2005. Remotely measuring chloro -phyll content in corn leaves with differing nitro -gen levels and relative water content. Agronomy Journal. 97, 106-112.
Seguel, A., Castillo, C.G., Morales, A., Campos, P., Corenjo, P., Borie, F. 2016. Arbuscular Mycorrhi-zal symbiosis in four Al-tolerant wheat genotypes grown in an acidic Andisol. Journal of Soil Sci-ence and Plant Nutrition. 16, 164-173.
Shah, G.M., Shah, G.A., Groot, J.C.J., Raza, M.A.S., Shahid, N., Lantinga, E.A. 2016. Maize nitrogen recovery and dry matter production as affected by application of solid cattle manure subjected to various storage conditions. Journal of Soil Sci -ence and Plant Nutrition. 16, 591-603.
Sparling, G.P., Wheeler, D., Vesely, E.T., Schipper, L.A. 2006. What is soil organic matter worth? Journal of Environmental Quality. 35, 548-557. Saleh, T.A., Sari, A., Tuzen, M. 2017. Optimization of
parameters with experimental design for the ad -sorption of mercury using polyethylenimine mod-iied-activated carbon. Journal of Environmental Chemical Engineering. 5, 1079–1088.