INTEGRATION OF SURFACE WATER MANAGEMENT IN URBAN
AND REGIONAL SPATIAL PLANNING
*Putranto DA Dinar1, Sarino2, Yuono AL3, Juliana Ch Imroatul4, and Hamim SA5 1Post Graduate Program; 2,3,4Faculty of Engineering, University of Sriwijaya, Indonesia
*Corresponding Author, Received: 15 Oct. 2017, Revised: 16 Dec. 2017, Accepted: 20 Jan. 2017 ABSTRACT: It is necessary to analyze the conditions of the watershed hydrometry, the type of land use, the duration and the time of rain, the tidal height, which is modeled spatially, in order to support in decision making for spatial management and water management. Palembang Metropolitan City is one of the major cities on the island of Sumatra, which is regionally included in the Musi Watershed area. Hydrologically Palembang City is located at the mouth of the Musi river, with an altitude of fewer than 20 m above the mean sea level. When the maximum rainfall occurs in the watershed Area, Palembang City will be affected by tidal water, and runoff on the sub-watershed in Palembang city cannot be flowed through the main channel within Palembang City, due to the tide of Musi river water. This study aims to show the relationship between watershed hydrometry, land use change management, rain intensity, and tidal influences on the watershed area, with various scenarios that will affect the runoff discharge and distribution of inundation that occurs in the watershed area. Taking a case study of the Lambidaro basin, in the Palembang City area, all sub-basin parameters that have been tested were modeled by a user flow to calculate the extent of runoff and flood flow tracking in the river. The inundation distribution occurring in the subwatershed was obtained by combining the results of hydrodynamic analysis and spatial analysis. Based on the results obtained it is concluded that there is a strong spatial relationship between land use and sub-basin morphometry and its effect on the extent of surface runoff.
Keywords: Land Use Change, flooding and puddles, Run-off, spatial management
1. INTRODUCTION
Land use changes in some areas of the city in Indonesia is so fast, due to rapid urbanization and industrial development. These changes are almost entirely done by the reclamation of swamps, the utilization of river banks, and conversion of forest land and agricultural land. The impact of changes in land use has changed the patterns of water drainage in sub-basin areas that exist in urban areas. The main effects of changes in drainage patterns are flooding and puddles as a result of excessive runoff [1].
Human activities have caused a very significant impact on water quantity, water quality and aquatic ecology. As the result, the dangers of flooding, household and industrial waste, which, after accumulating for a long time, are unlikely to return to normal or require enormous costs for recovery.
Run-off problems with peak flood and inundation characteristics are influenced by several factors, such as urbanization, unsuitable landfill, tidal effects, as well as sedimentation and river-flow pollutants from upstream areas and other small rivers that form the sub-watersheds in the area [2].
Flow management capability, run-off mitigation, infiltration and water quality all have relevance to land use conditions. Furthermore, the connection between the water management system
and spatial planning is one of the important keys that must be done if they want to play a role in reducing the danger of flooding. However, in reality in every spatial arrangement, the two systems, namely spatial planning and water management have never been integrated. On this basis, an analysis of hydro topographic conditions, type of land cover, duration and time of rain, tidal height,are modeled using spatial analysis, in order to support decision making for spatial management and water management [3].
2. CITY DEVELOPMENT AND FLOOD
PROBLEM IN SOUTH SUMATERA AREA
Similar to the development of several regions in Indonesia, the province of South Sumatra has the development of cities that is very significant. It can be seen from the population growth which averagely reached 1.44% with the population of 7,481,200 in 2010 [4] of which, 1,468,000 are in Palembang (19.62%). If the average population growth in South Sumatera remains at 1.88%, then it is estimated that in 2030, the population in South Sumatera province will reach 10,166,760 people and 18.97% will be in Palembang City.
various urban activities. The expansion that will change the various functions of the water reservoir land, is transformed into a developed one and will neglect the watershed ecosystem.
Based on data from BMKG (2010), the highest rainfall in South Sumatera Province is 18 - <34.87 mm/day and the peak rainfall in November, and the lowest rainfall <18 mm/day, occurs every in May-August. Surface water is difficult to predict in relation to space and time distribution. While the AWLR which is used to record water level in several locations along the river has not worked properly. This has caused many constraints to predict the occurrence of peak flood and areas that will occur. In October (2016), the city of Lubuk Linggau, and several sub-districts in Musi Rawas district have experienced floods, the city of Sekayu and several sub-districts in Musi Banyuasin regency in September (2016), Inderalaya city and several sub-districts in Ogan Ilir Regency (October, 2016), Kayu Agung city and several sub-districts in Ogan Komering Ilir regency, Pangkalan Balai City and several sub-districts in Banyuasin regency, and Palembang City itself always experiences flood in every rainy season with high intensity.
Efforts to control floods have been undertaken by several cities that often experience floods every year. In Jakarta City floodway canal and bio pore have been made and in Semarang City, a polder system has been also built. But all of them have not yet shown that the problem of annual floods can be overcome. All flood control systems must depart from existing watershed ecosystem conditions. From these conditions, It requires new analysis by simulation to determine the flood discharge with each return period, which finally can be used to determine the appropriate drainage system in the area [5]. Thus a specific approach through more useful and accurate techniques is necessary. Transforming data into a Geographic Information System using Multicriteria Spatial Analysis in decision making [6] can be used as a policy and technical combination solution and technical, and also as a model in presenting the watershed environmental conditions for better data quality and analysis [7].
2.1 Case Study
As an example of frequent inundation in the Lambidaro sub-basin especially in the downstream area and around the floodplain, during the rainy season and high tides is Lambidaro sub-basin with an area of 65.25 km2 is a subwatershed which has different morphometric characteristics from other sub-watersheds. Based on the drainage pattern it is divided into two sub-watersheds namely part of left Lambidaro (Lambidaro-1) Sub-watershed and
part of right Lambidaro (Lambidaro-2) sub-watershed which leads to the Musi river.
Fig.1 Lambidaro sub-basin at Musi downstream sub-basin area
3. METHODOLOGY
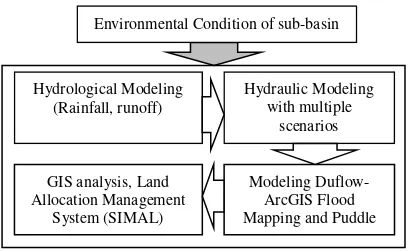
To anticipate the amount of runoff water, due to inappropriate land allocation, a multicriteria analysis is needed in every decision of land allocation. Land Allocation Management System (SIMAL) is a watershed analysis system developed using GIS or Geographic Information System (GIS) using land use change parameters, morphometry, and hydrometry of DAS [8].
3.1 Research Site
The study material is to explain the effect of surface runoff on land use change, the location of the study is the Lambidaro sub-basin (Figure 1), which is one of 16 sub-basins that form the drainage system of Palembang which discharges into the Musi River, through the city of Palembang. With an area of 65.42 Km2.
3.2 Research Data
The data used in this research are river hydrometry data, longitudinal section (l) and river cross-section (b), river bed invert (ls), watershed area (A) and density (r). While spot height data and land use are needed to analyze the infiltration coefficient (c) and time concentration (Tc). And the ever-changing dynamic data is the rainfall data (R) needed to calculate the rain intensity (I) in each sub-watershed.
3.3 Research Methods
would also be used to track flood flow in rivers [11].
The hydrodynamic analysis was performed on selected river sub-systems that have been obtained from the results of cluster analysis. This analysis utilizes the 1D (Duflow) non-steady flow model with the maximum rainfall intensity conditions of the 25th anniversary period of the previous hydrological analysis results as well as the results of tidal observation forecasting at the sub-systems of selected river sub-systems. The first stage in the hydrodynamic analysis was by establishing a scheme of the hydrodynamic network in sub-watershed adapted to the results through terrain morphology and terrain processing analysis on ArcGIS-ARC Hydro and field conditions, then incorporating the dimensions of water structure, cross section, boundary conditions (tidal, rain results of hydrological analysis) and flow discharge. After calculation of each segment/cross section will be obtained some hydraulic parameters such as flood water level, water flow rate, channel flow and water level in the river and channel were obtained.
The inundation distribution occurring in the sub-river system was obtained by combining the results of hydrodynamic analysis and spatial analysis. The influence of the tides in the main river entering the subchannel of the river system is measured in height and the area of distribution so as to obtain the distribution of water level in the river subsystem. Then the distribution of water level is compiled with the topographic condition of the sub-system of the relevant river based on 0.5-meter contour interval so as to obtain the distribution of the classified high pools that occur in each selected river sub-system with the 25th anniversary of rainfall intensity.
With several scenarios of land use change, it can be seen how much the changes in inundation height due to land use change in the selected sub-system. This scenario was used as a way to see the condition of the sub-system of a river which in turn will influence the pattern of river environmental control that will be done. The first scenario is to change the type of land use so that the value of C tends to decrease which became an indicator of the condition of the river subsystem becomes better. The second scenario was changing the type of land use so that the value of C tends to increase, this condition could explain that river subsystem had a condition that was considered to be disturbed.
The disruption of the sub-system condition of the river is caused by the increase of water runoff caused by the decrease of surface soil absorption capacity to water, thus increasing the volume of surface water flow if the surface condition of the soil is almost largely a wake-up area
Fig. 2 Flow Chart of research methods 4. RESULTS AND DISCUSSION
4.1 Correlation Between Surface Run-off with Morphometric Characteristic Variable
This correlation was analyzed to address the problem of spatial relationships between land use and sub-basin morphometry and its effect on the extent of surface runoff. The strong correlation between independent variables (characteristic of sub-basin morphometry) and the dependent variable of runoff (Q), is seen through Pearson correlation value. Correlation values range from -1,000 to -1,000. The value of -1.000 shows a very strong but negative correlation, while the value of 1,000 indicates a very strong correlation/very closely directed positively.
The results of the analysis (at 99% confidence level) obtained the correlation value between variables very high runoff (Q) ranges from 0.849 to 0.999 with variable length of river order (x1),
river length (x2), watershed (x3), roving watershed
(x4) , average Rb(x5), Flow density (x6), texture
ratio (x8), Roughness number Rn (x10).
This means that there is a strongly significant relationship between runoff and long river order, river length, basin area, perimeter watershed, average Rb, flow density, texture ratio, roughness number Rn. While the value of strong correlation is seen between runoff with Tc concentration time of 0.629. This means at a significance level of 5% or a 95% confidence level, there is a strong relationship between runoff and concentration time (Tc). The correlation value is strong enough at flow frequency (x7), relief (x9) and green area (forest,
tree, shrub, yard, rice field, field, garden) (x14). The
low correlation value between runoff and variable flow coefficient C (x12) of 0.319 with significant
level and negative correlation of 0.234 for variable circularity ratio Rc (x13).
4.2 Characteristic of Lambidaro sub-Basin
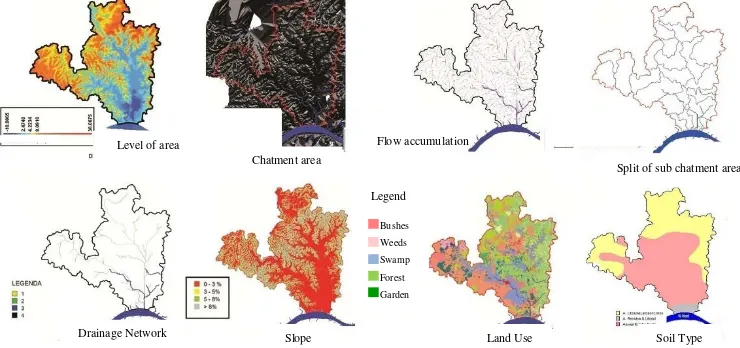
The morphometric characteristics of the Lambidaro watershed are shown in Fig. 3. Land
Hydrological Modeling
utilization in the Lambidaro sub-basin is dominated by shrubs, trees, fields, and forests ranging from 72%, settlements ranging from 4.74% to potentially changing land use, such as for settlement development. Settlement construction mainly occurs in right Lambidaro (Lambidaro-2) sub-watershed close to the main road / outer shaft of Palembang City (Musidua bridge). As part of left Lambidaro (Lambidaro-1) sub-basin is dominated by bushes and swamps. The sub-watershed of Lambidaro river has varying altitude less than 10 m msl in estuary area up to 36 m in upstream area. The percentage of the slope is
dominated by 0-3% and more than 8% with a maximum height of 36 msl in the upstream area. River conditions are still natural, especially in part of left Lambidaro, while some rivers in part of right Lambidaro sub-basin have been normalized by cliff reinforcement.
With the condition of land use, slope, flow density and soil type, the range of runoff coefficient in Lambidaro sub-basin show the runoff coefficient value of 0.66. This means that 34% of the total rainfall falls on the Lambidaro river sub-basin can still be infiltrated (see Figure 3).
Fig. 3 Characteristic of morphometry Lambidaro sub-basin 4.3 Hydrodynamic model of Lambidaro
watershed
The simulation of the Duflow-ArcGIS model was conducted on the Lambidaro watershed. Schematic of the water system based on DEM extraction with flow patterns that resulted in sub-basin and drainage line boundaries to illustrate runoff on the floodwaters was constructed first (Figure 4). The Lambidaro sub-basin network scheme was built by entering the cross-profile data as well as extending the channels per segment based on the measurement results in the field. Channel width ranges from 11 - 18 m. The boundary conditions for the Duflow model consist of upper boundary conditions such as runoff from upstream Lambidaro watershed and downstream boundary conditions, such as water levels at the mouth of the Lambidaro river. The rainfall hydrology parameter was taken from the analysis of the distribution of maximum daily rainfall by Gumbell method for a 25-year period of 163 mm/day. The weighted C values of each Lambidaro sub-basin were calculated from the results of spatial analysis of land use, slope, soil type and flow density per sub-watershed as shown in Fig.4b. The water level in certain segments of
drainage network of Lambidaro watershed is shown in Figure 4c. The results of the hydrodynamic modeling, the existing conditions of the Lambidaro sub-watershed were approached with a 25-year return period scenario.
The water level on each segment was then transformed into the DEM sub of the Lambidaro sub-basin, and interpolated by the ArcGIS procedure to obtain the inundation distribution that will occur for the 25-year anniversary scenario. The results of the analysis of the distribution of inundation of Lambidaro sub-basin were classified into six classifications, namely: (1) unlogged areas; (2) flooded with altitude less than 0.25 m; (3) altitude 0.25 - 0.5 m; (4) Altitude of 0.5-0.75 m; (5) altitude of 0.75-1 m and (6) heights of more than 1 m. The result of hydrodynamic modeling using Duflow model was followed by analysis of inundation distribution that will occur with 25 year period return scenario seen as in Figure 4d. The flooded areas of the Lambidaro sub-basin are the areas of flow accumulation and from the field, observations are low areas with a slope of 0-3% with the type of land use in swamp dominance. The calibration of this model is shown by the high suitability of inundation that occurs in the field with R2= 0.869.
Level of area
Chatment area
Flow accumulation
Split of sub chatment area
Drainage Network Slope Land Use Soil Type
Fig. 4 Drainage network flood simulation of Lambidaro sub-basin: (a) Catchment extraction and flow direction of Lambidaro sub-basin (b) Schematic and drainage network; (c) distribution of inundation due to land use change; (d) the puddle area is assembled with flow accumulation
Fig. 5 Distribution of inundation is arranged with Lambidaro sub-waters upstream, middle and downstream The influence of inundation can be seen in
Figure 5, the upper Lambidaro watershed is 756.81 ha, 2821.6 ha, and downstream 513.23 ha. As for the part of left Lambidaro sub-watershed, the upstream area of 1,854.5 ha, middle 380.5 ha and
downstream 131.1 ha.
4.4 Land use change scenarios
Zoning scenario to see the effect of land use change on the inundation distribution that will (a) Catchment extraction and flow direction of Lambidaro sub-basin (b) Scematic of Duflow model for Lambidaro river network
(c)
(d)
Land use
The effect of tides on the distribution of
inundation
Legend Effect of Tide 0,1-0,3 m msl 0,3-0,5 m msl > 0,5m msl
Legend
Not Inundated
Flow accumulation and inundated
distribution Flow accumulation
and inundated distribution
Legend
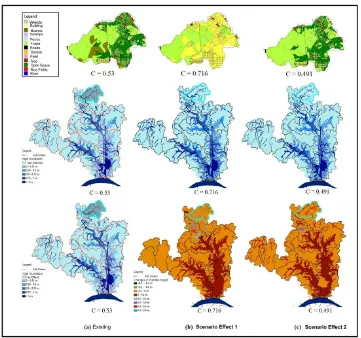
occur in Lambidaro sub-basin. Land use change scenario is made as many as 5 scenarios, namely:
Fig. 6 Effects of land use change of Lambidaro upstream basin (1) The first scenario is changing the type of land
use area that is still possible to be converted into a green area (urban forest, park) so it can decrease the value of C.
(2) The second scenario is changing the type of land utilization of Lambidaro-2 sub-basin of the right section that may still be converted into a settlement (see the current city development) resulting in an increase in the value of C. (3) The third scenario is similar to the first
scenario is only done on the part of Lambidaro-1 sub-basin.
(4) The fourth scenario is the same as the second scenario and is only done on the part of Lambidaro-1 sub-basin.
(5) The fifth scenario is changing land use with different C values ranging from 0.2 to 0.9 Some of the effects of land use change scenarios on upstream, mid and downstream sub-watersheds are minimizing and increasing the value of the runoff coefficient C per sub-watershed were done to reduce and increase the inundation shown in Fig.6.
5. CONCLUSION
1. There is a strongly significant relationship between runoff and river length, watershed area, perimeter watershed, average Rb, flow density, texture ratio, roughness number Rn. 2. There is a strong relationship between runoff
and concentration time (Tc).
3. The correlation is strong enough on the Frequency of flow and Relief with the forest area
4. The effect of land-use change with several scenarios made in the Lambidaro sub-basin proves that if land use change is not well controlled, the extent of the inundation will extend from downstream, middle to upstream 6. ACKNOWLEDGMENTS
7. REFERENCE
[1] B.J.M. Goes, S.E., Howarth, R.B, Wardlaw, I.R, Hancock and U.N. Parajuli, Integrated water resources management in an insecure river basin: a case study of Helmand River Basin, Afghanistan., International Journal of water resources Development, Vol. 32, Issue 1,2014.
[2] Rosmalinda Permatasari, Dantje Kardana Natakusumah, Arwin Sabar, Determining Peak Discharge Factor Using Synthetic Unit Hydrograph Modelling (Case Study: Upper Komering South Sumatera, Indonesia), International Journal of Geomate, Vol. 13, Issue 36, 2017, pp.1-5.
[3] Seemanta S. Bhagabati, Akiyuki Kawasaki, Consideration of the rainfall-run-off-inundation (RRI) Model for flood mapping in a deltaic area of Myanmar, Hydrological Research Letter, 2017.
[4] Province of South Sumatera, Revised Regional Spatial Plan of South Sumatera Province Year 2016-2036, 2016, pp. 1-6. [5] Dinar DA Putranto, Sarino, Yuono, AL.,
Flood modeling for mitigation and management of drainage system of Palembang city”, Research report, LPPM-UNSRI, 2008, 1-6.
[6] Bana E, Costa CA, Da Silva PA, Nunes Correia F,. Multicriteria Evaluation of Flood Control Measures: The Case of Ribeirado Livramento. Water Resource Manag, 2004,18
(21): 263–283.
[7] Majid Mirzael, Application of a rainfall-runoff model for regional-scale flood inundation mapping for the Langat River Basin, International Journal of GEOMATE, 2017.
[8] Hamim SA, F Sjarkowi, Dinar DA Putranto,
Totok G, Model control of river sub-system
environment in the management of drainage system of Palembang City, Dissertation, Doctor of Environmental science, post graduate program University of Sriwijaya, 2013, p 4-16.
[9] Government Regulation no. 26, The National Spatial Plan, The Secretariat of the Republic of Indonesia, 2008.
[10] Puspics-UGM “Preparation of Integrated Musi River Basin Management Plan", Musi River Basin Management Area, Research Report,2013, 77-80.
[11] Dinar DA Putranto, Sarino, and Yuono AL, “Digital field model for rainfall-runoff modeling of sedimentation analysis regionally in the Musi basin”, Research report, University of Sriwijaya, 2015.
[12] Province of South Sumatera, Revised Regional Spatial Plan of South Sumatera Province Year 2016-2036, Report Planning, 2016, pIII 1-6.