CHAPTER III RESEARCH METHODS
3.1 Setting and Research Subject
This classroom action research conducted in fourth grade students of SD Negeri Salatiga 06 located in Salatiga. Exactly located on Jalan Bima 01 , Sidomukti, Salatiga. The implementation of this research was done in the second semester of academic year 2016/2017.
The subject of this research is the fourth graders of SD Negeri Dukuh 01 Salatiga. The number of students in the class is 37 students who are made up of 17 male students and 20 female students. The fourth grade homeroom teacher at the moment is Ibu Ria Kurniasari, and School Principal is Bapak Joko Winarno, S.Pd.
3.2 Research Type
This research type is collaboration classroom action research, According to Suharsimi Arikunto (2006) classroom action research is an effort to observe the learning activities of the group of learners by providing an act that deliberately raised. The action is done by teachers together with the students under the guidance and direction of teachers, with a goal to improve the quality of learning. The improvement effort that researcher choose is focusing on cognitive learning outcomes with learning model Problem-Based Instruction learning model using media KOKAMI (Kotak dan Kartu Misteri).
3.3 Research Procedure
Picture 3.1 Classroom Action Research Procedure
Planning
Action
CYCLE 1
Reflection
Observing
Plannig
Action
CYCLE 2
Observing
Reflection
3.4Research Planning
1. Permission Request
Request permission at SD Negeri Dukuh 01 to the principal before conducting the research
2. Observation and interview before conducting the research
The observation and interview conducted to get an initial description of SD Dukuh 01 about the whole situation of teaching and learning process of natural science subjects in fourth grade.
3. Problem Identification
The natural science learning in the fourth grade of SD Negeri Dukuh 01 is still conventional, so students feel bored and tired in the learning process. Students tend to learn by memorizing and recording what is explained by the teacher. So with this the students do not master the concept taught by the teacher so that the learning outcomes become low. By inviting students to learn by using problem-based instruction model is expected to be a fun learning so that students more easily understand the learning materials. 4. Action Planning
Reviewing the fourth grade natural science learning materials of that will be done for research by reviewing the indicators of learning. Preparing the lesson plan according to predetermined indicators. Then, develop the natural science learning scenarios with problem-based instruction model. Preparing teaching aids and KOKAMI (Kotak dan Kartu Misteri) as a learning media. Prepare the observation sheet to be used in the research. Preparing evaluation tools in the form of student worksheets in the form of written tests.
5. Action Implementation
two meetings. In the second cycle implemented in accordance with the plan and to improve learning on the first cycle. The second cycle was held with two meetings as well.
6. Observation
When learning takes place, the observation were carried out by homeroom teacher as an observer to observe the students' activities during the science lesson using the problem-based instruction model aided KOKAMI (Kotak dan Kartu Misteri) as a learning media. In addition, besides the students, the observers also observe the researcher who applied the teaching process using problem-based instruction aided by KOKAMI (Kotak dan Kartu Misteri).
7. Reflection
The reflection is done on the implementation of learning by using problem-based learning model aided by KOKAMI (Kotak dan Kartu Misteri) in two cycles, and then the outcomes of natural science learning students will be obtained. In addition, the results of observations on teacher activity will also be obtained. From the data the researcher will see whether the indicators of achievement and performance already been achieved or not. If not then the researchers make improvements in the next cycle for more effective implementation and achieved performance indicators.
3.5Research Variable
According to Sugiyono (2008), research variable are an attribute or value of people, objects or activities that have a certain variation set by researchers to learn and then drawn conclusions. According to the relationship between an
The research variables in this action are the fourth grade students of SD Negeri Dukuh 01 on natural science subjects and this research uses three variables, namely problem-based instruction learning model, learning media KOKAMI (Kotak dan Kartu Misteri) and natural science learning outcomes. The explanation of these three variables.
3.5.1 Independent Variable (X).
According to Sugiyono (2008), independent variables are variables used by researchers to influence or cause change. The problem-based instruction learning model and learning media KOKAMI (Kotak dan Kartu Misteri) are independent variables.
1. Problem-Based Instruction Learning Model (X1)
Problem-based instruction is a constructivist-based learning model that accommodates students' involvement in authentic learning and problem solving (Arends et al., 2001). In grabbing information and developing an understanding of topics, students learn how to construct problem frameworks, organize and investigate problems, collect and analyze data, construct facts, construct arguments about problem solving, individual work or collaboration in problem solving.
In other words this learning model raises an actual problem as a challenging and interesting learning. Learners are expected to learn to solve the problem fairly and objectively.
2. Learning Media KOKAMI (Kotak dan Kartu Misteri) (X2)
game is very well used in heterogeneous classes. According to Kadir (2011) the combination of media and games is able to significantly motivate and attract students to be actively involved in the learning process is expected to learn to solve the problem fairly and objectively.
3.5.2 Dependent Variable (Y)
According to Sugiyono (2008), the dependent variable is a variable that is affected or become a result, because of the independent variables. In this research, the dependent variable is the result of science learning of fourth grade students of SD Negeri Dukuh 01.
The learning outcomes is the result of the value obtained by the students after getting the learning process in the class so that the success rate is known. Success rate is stated on the test score obtained in accordance with the objectives of science learning that have been determined.
3.6 Action Planning 3.6.1 Pre-cycle
At this stage, the researcher takes the students' learning outcomes from the natural resources material, which is taught by the homeroom teacher by using the lecture method only and the underutilization of existing learning media. Then from the results of that study, a reflection will be conducted on the findings of both the advantages and disadvantages that are used as improvement materials in
3.6.2 Cycle 1
In cycle 1, there are several stages of research implementation plan, such as: 1. Planning
a. Develop a Lesson Plans.
b. Prepare sources, tools and media.
c. Prepare evaluation tool in the form of written test.
d. Prepare an observation sheet to observe teacher performance and student activities.
2. Action Implementation
The action implementation in general includes three activities, namely: Opening Activity, Main Activity and Closing Activity.
a. Opening Activity
1. The teacher conditions the class so that the student ready to accept the learner.
2. The teacher delivers the material taught.
3. The teacher conveys the goals achieved by the students. 4. The teacher gives the motivation to the students.
b. Main Activity
1. The teacher delivers the subject matter to the students. 2. The teacher asks the students about the subject matter.
3. The teacher asks the students to relearn the material described. 4. The teacher divides groups heterogeneously.
5. The teacher introduces KOKAMI (Kotak dan Kartu Misteri). 6. The teacher along with the students formulate problem studied.
8. The students accompanied by the teacher collect data based on problems and solution proposed.
9. The teacher gives the group representatives the opportunity to present the problem solution they have made.
10. The teacher makes observations by observing the students carefully when there are special needs.
c. Closing Activity
1. The teacher gives the students chance to ask questions. 2. The teacher with the students conclude the lesson delivered. 3. The teacher gives reflections.
3. Observation
The observation done by the homeroom teacher as an observer. In this observation, the observer provided by the researcher observation sheets for student activity and teacher activity in teaching process through problem-based instruction learning model aided by learning media KOKAMI (Kotak dan Kartu Misteri).
4. Reflection
3.6.3 Cycle 2
In cycle 2, researchers re-design the lesson plan based on the results of reflection on the one cycle implemented before. This felt to be very useful to improve the deficiencies or problems that occur in the one cycle it will be improved and improved learning back on cycle two.
1. Planning
a. Develop a Lesson Plans.
b. Prepare sources, tools and media.
c. Prepare evaluation tool in the form of written test.
d. Prepare an observation sheet to observe teacher performance and student activities.
2. Action Implementation
The action implementation in general includes three activities, namely: Opening Activity, Main Activity and Closing Activity.
a. Opening Activity
The teacher conditions the class so that the student ready to accept the learner.
The teacher delivers the material taught.
The teacher conveys the goals achieved by the students. The teacher gives the motivation to the students.
b. Main Activity
The teacher delivers the subject matter to the students. The teacher asks the students about the subject matter.
The teacher asks the students to relearn the material described.
The teacher divides groups heterogeneously.
The teacher along with the students seek a solution of the problem studied.
The students accompanied by the teacher collect data based on problems and solution proposed.
The teacher gives the group representatives the opportunity to present the problem solution they have made.
The teacher makes observations by observing the students carefully when there are special needs.
c. Closing Activity
The teacher gives the students chance to ask questions. The teacher with the students conclude the lesson delivered.
The teacher gives reflections.
3. Observation
The observation done by the homeroom teacher as an observer. In this observation, the observer provided by the researcher observation sheets for student activity and teacher activity in teaching process through problem-based instruction learning model aided by learning media KOKAMI (Kotak dan Kartu Misteri).
4. Reflection
of students' learning completeness in cycle two already meets the specified success indicators, then the study declared complete.
3.7 Data Collection Techniques and Instrument 3.7.1 Data Collection Techniques
Data collection techniques used by researchers are a test technique, observation and documentation. By using these techniques, the researchers obtained the descriptions needed in the study.
1. Test Technique
According to Hamzah B. Uno and Satria Koi (2013: 111) test is a very valuable measuring tool in research. This is a set of stimuli given to someone with the intent to get answers that become a basis for determining the score of numbers. The test used by the researcher is using test result of student learning outcomes in the form of written test. In each end of the cycle will be presented questions in the form of multiple choice test.
2. Observation
The researchers interacted fully in social situations with research subjects. This technique was used to observe, understand events closely, deeply and focused on the subject of research, both in formal and casual situations. According to Iskandar (2008: 78). The observations were done by the homeroom teaches because they felt more experienced. The observer observes the learning activities of cycle one and cycle two. In cycle one and cycle two of learning using problem-based instruction model combined with KOKAMI (Kotak dan Kartu Misteri). THE observer and researcher observe student activities in learning activities and observe the actions or performance of teachers while teaching.
3. Documentation
At the time of the learning activities conducted, researchers documented (taking pictures) of learning activities both teacher and student activities, which
3.7.2 Research Instrument
The research instrument is the question items and the performance observation sheet.
1. Evaluation Test Sheet
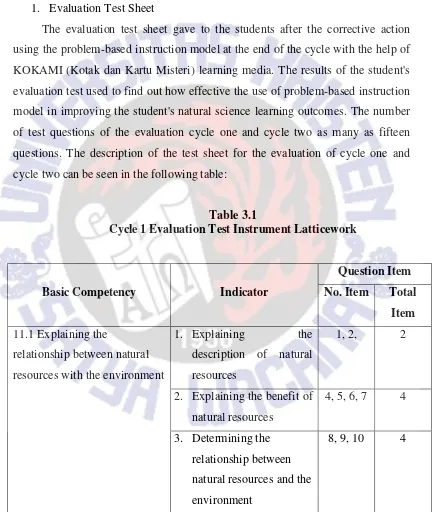
The evaluation test sheet gave to the students after the corrective action using the problem-based instruction model at the end of the cycle with the help of KOKAMI (Kotak dan Kartu Misteri) learning media. The results of the student's evaluation test used to find out how effective the use of problem-based instruction model in improving the student's natural science learning outcomes. The number of test questions of the evaluation cycle one and cycle two as many as fifteen questions. The description of the test sheet for the evaluation of cycle one and cycle two can be seen in the following table:
Table 3.1
Cycle 1 Evaluation Test Instrument Latticework
Basic Competency Indicator
description of natural resources
1, 2, 2
Table 3.2
Cycle 2 Evaluation Instrument Test Latticework
KD Indikator
Item Soal No. Item Total
Item
11.2 Explaining the
relationship between natural resources and technology
1. Mentioning the kinds of natural resources processor technology
1, 2, 2
2. Explaining the example of natural resources processor technology
3, 4, 5, 6 4
3. Suggesting the result of natural resources processing
7, 8, 9, 10
4
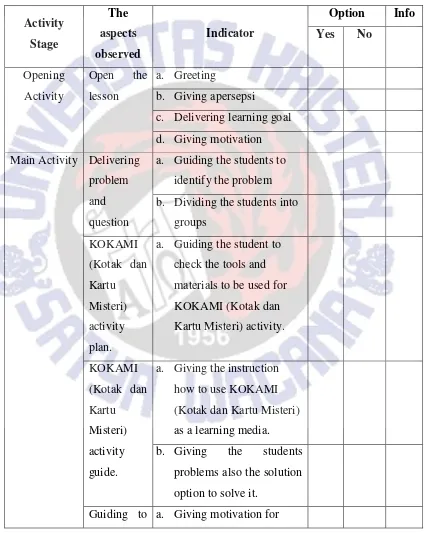
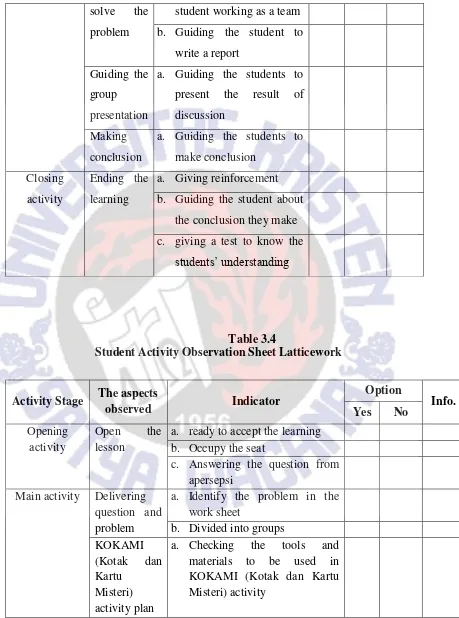
2. Observation Sheet
The observation sheets used to observe teacher and student activities at each meeting from cycle one and cycle two. Teachers' activities observed from pre-learning, opening activities, main activities to closing activities through problem-based instruction models, as well as student activities ranging from pre-learning, opening activities, main activities to closing activities through problem-based
Table 3.3
Teacher Activity Observation Sheet Latticework
Activity
a. Guiding the students to identify the problem b. Dividing the students into
groups
solve the problem
student working as a team b. Guiding the student to
Student Activity Observation Sheet Latticework
Activity Stage The aspects
observed Indicator
Problem teacher determining the problem-solving solution relevant with the problem. Discussion
and making report
a. Discuss to determining the best solution to solve the problem and making a report b. The students guided by the teacher to make a conclusion Closing
b. be able to conclude the lesson c. do the test given by the teacher
3.8 Validity Test and Instrument Reliability
Before the test is used as a research instrument. Firstly the respondents will be tested, the trial is intended to determine whether the instrument can meet the requirements of validity and reliability.
3.8.1 Instrument Validity Test
Generally, in collecting research data required instrument (measuring instrument). Instrument of research related to data collection and data processing, because the research instrument is a tool of collecting and processing data about the variables studied.
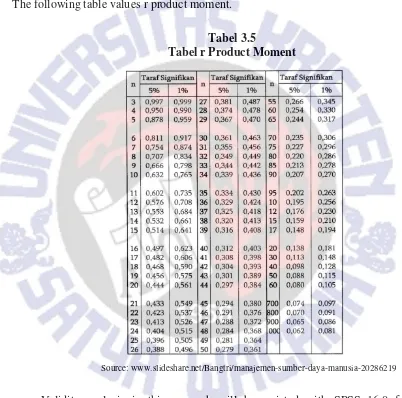
This means that if r arithmetic> 0.3, the item number can be said to be valid. Conversely, if r count <0.3 the number of the item is not valid.
The R table value depends on the number of respondents (N) and the level of error (a). From r table product moment to respondent (N) = 24 with df = n - 2, then df = 24 - 2 = 22, with significance level 5% obtained r table price = 0,432. The following table values r product moment.
Tabel 3.5
Tabel r Product Moment
Source: www.slideshare.net/Bangtri/manajemen-sumber-daya-manusia-20286219
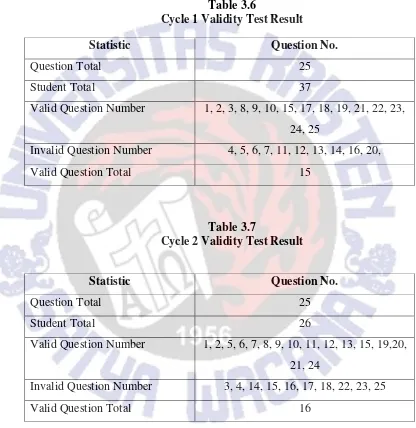
25 tested questions, and in cycle 2 there are 16 valid questions from 25 tested questions, and used as test instrument by the researcher to know the student learning result. The following items are declared valid and invalid.
Table 3.6
Cycle 1 Validity Test Result
Table 3.7
Cycle 2 Validity Test Result
Statistic Question No.
Question Total 25
Student Total 37
Valid Question Number 1, 2, 3, 8, 9, 10, 15, 17, 18, 19, 21, 22, 23, 24, 25
Invalid Question Number 4, 5, 6, 7, 11, 12, 13, 14, 16, 20,
Valid Question Total 15
Statistic Question No.
Question Total 25
Student Total 26
Valid Question Number 1, 2, 5, 6, 7, 8, 9, 10, 11, 12, 13, 15, 19,20, 21, 24
Invalid Question Number 3, 4, 14, 15, 16, 17, 18, 22, 23, 25
3.8.2 Reliability Test Instrument
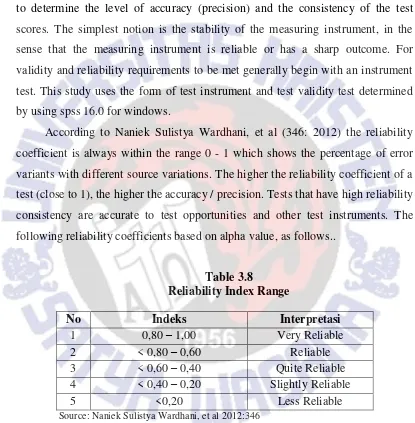
Reliability test instrument aims to determine the level of consistency a test question measured. The main purpose of calculating the reliability of test scores is to determine the level of accuracy (precision) and the consistency of the test scores. The simplest notion is the stability of the measuring instrument, in the sense that the measuring instrument is reliable or has a sharp outcome. For validity and reliability requirements to be met generally begin with an instrument test. This study uses the form of test instrument and test validity test determined by using spss 16.0 for windows.
According to Naniek Sulistya Wardhani, et al (346: 2012) the reliability coefficient is always within the range 0 - 1 which shows the percentage of error variants with different source variations. The higher the reliability coefficient of a test (close to 1), the higher the accuracy / precision. Tests that have high reliability consistency are accurate to test opportunities and other test instruments. The following reliability coefficients based on alpha value, as follows..
Table 3.8
Reliability Index Range
No Indeks Interpretasi
1 0,80 – 1,00 Very Reliable
2 < 0,80 – 0,60 Reliable
3 < 0,60 – 0,40 Quite Reliable
4 < 0,40 – 0,20 Slightly Reliable
5 <0,20 Less Reliable
Source: Naniek Sulistya Wardhani, et al 2012:346
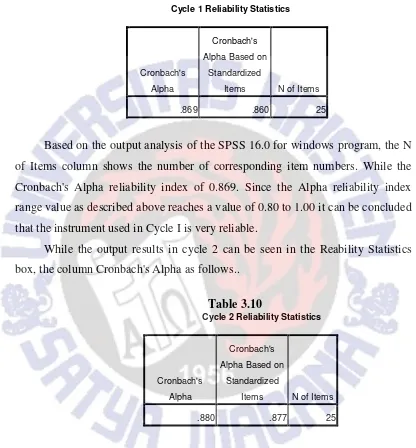
Cronbach's Alpha testing techniques are used to test the reliability of each item. The following output results in cycle 1 can be seen in the Reability Statistics
Table 3.9
Cycle 1 Reliability Statistics
Cronbach's
Alpha
Cronbach's
Alpha Based on
Standardized
Items N of Items
.869 .860 25
Based on the output analysis of the SPSS 16.0 for windows program, the N of Items column shows the number of corresponding item numbers. While the Cronbach's Alpha reliability index of 0.869. Since the Alpha reliability index range value as described above reaches a value of 0.80 to 1.00 it can be concluded that the instrument used in Cycle I is very reliable.
While the output results in cycle 2 can be seen in the Reability Statistics box, the column Cronbach's Alpha as follows..
Table 3.10
Cycle 2 Reliability Statistics
Cronbach's
Alpha
Cronbach's
Alpha Based on
Standardized
Items N of Items
.880 .877 25
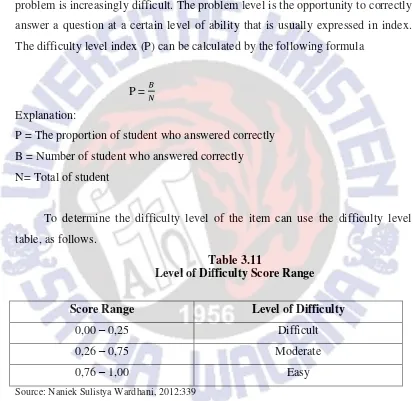
3.9 Analysis of Level Of Difficulty Question
According to Naniek Sulistya Wardhani, et al (338-339: 2012) said that the level of difficulty is a number that indicates the proportion of learners who answered a point (Slameto, 2001). The greater the level of difficulty means the problem is easier, and vice versa the lower the level of difficulty means the problem is increasingly difficult. The problem level is the opportunity to correctly answer a question at a certain level of ability that is usually expressed in index. The difficulty level index (P) can be calculated by the following formula
P =
Explanation:
P = The proportion of student who answered correctly B = Number of student who answered correctly N= Total of student
To determine the difficulty level of the item can use the difficulty level table, as follows.
Table 3.11
Level of Difficulty Score Range
Score Range Level of Difficulty
0,00 – 0,25 Difficult
0,26 – 0,75 Moderate
0,76 – 1,00 Easy
Source: Naniek Sulistya Wardhani, 2012:339
Table 3.12
Cycle 1 Level of Difficulty Analysis
No Index Interpretation No. Item Total
1 0,00 – 0,25 Difficult - -
2 0,26 – 0,75 Moderate 1, 2, 3, 4, 5, 6, 7, 8, 9, 10,11, 12, 13, 14,
15
15
3 0,76 – 1,00 Easy - -
Total 15
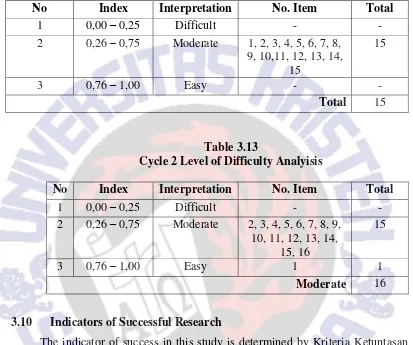
Table 3.13
Cycle 2 Level of Difficulty Analyisis
No Index Interpretation No. Item Total
1 0,00 – 0,25 Difficult - -
2 0,26 – 0,75 Moderate 2, 3, 4, 5, 6, 7, 8, 9, 10, 11, 12, 13, 14,
15, 16
15
3 0,76 – 1,00 Easy 1 1
Moderate 16
3.10 Indicators of Successful Research
The indicator of success in this study is determined by Kriteria Ketuntasan Minimum (KKM) to be achieved by students is 70, while the effort to improve student learning outcomes using inquiry model is considered successful if 80% of fourth grade students of SD Negeri Dukuh 01 and also positive change (using model Problem-Based Instruction with KOKAMI) on learning natural science. These indicators are:
1. Application of learning model Problem-Based Instruction combined with learning media KOKAMI.
3.11 Data Analysis Technique
The data analysis used is quantitative and qualitative. According to Naniek Sulistya Wardhani, et al (2012: 337) quantitative research is the research of items based on the empirical data from the items concerned. Data analysis is done after the data collected to determine the success rate of corrective action that has been implemented. Quantitative data analysis is taken based on the learning result in the form of evaluation test or formative test which is processed to find the highest score, the lowest score, the average score obtained by all students, and the percentage of the students' learning achievement at each end of the cycle..