Big Data
Principles and Paradigms
Edited by
Rajkumar Buyya
The University of Melbourne and Manjrasoft Pty Ltd, Australia
Rodrigo N. Calheiros
The University of Melbourne, Australia
Amir Vahid Dastjerdi
The University of Melbourne, Australia
AMSTERDAM • BOSTON • HEIDELBERG • LONDON NEW YORK • OXFORD • PARIS • SAN DIEGO SAN FRANCISCO • SINGAPORE • SYDNEY • TOKYO
No part of this publication may be reproduced or transmitted in any form or by any means, electronic or mechanical, including photocopying, recording, or any information storage and retrieval system, without permission in writing from the publisher. Details on how to seek permission, further information about the Publisher’s permissions policies and our arrangements with organizations such as the Copyright Clearance Center and the Copyright Licensing Agency, can be found at our website: www.elsevier.com/permissions.
This book and the individual contributions contained in it are protected under copyright by the Publisher (other than as may be noted herein).
Notices
Knowledge and best practice in this field are constantly changing. As new research and experience broaden our understanding, changes in research methods, professional practices, or medical treatment may become necessary.
Practitioners and researchers must always rely on their own experience and knowledge in evaluating and using any information, methods, compounds, or experiments described herein. In using such information or methods they should be mindful of their own safety and the safety of others, including parties for whom they have a professional responsibility.
To the fullest extent of the law, neither the Publisher nor the authors, contributors, or editors, assume any liability for any injury and/or damage to persons or property as a matter of products liability, negligence or otherwise, or from any use or operation of any methods, products, instructions, or ideas contained in the material herein.
Library of Congress Cataloging-in-Publication Data
A catalog record for this book is available from the Library of Congress
British Library Cataloguing-in-Publication Data
A catalogue record for this book is available from the British Library
ISBN: 978-0-12-805394-2
Publisher: Todd Green Acquisition Editor: Brian Romer
Editorial Project Manager: Amy Invernizzi
Production Project Manager: Punithavathy Govindaradjane Designer: Victoria Pearson
Typeset by SPi Global, India
xv T. Achalakul
King Mongkut’s University of Technology Thonburi, Bangkok, Thailand P. Ameri
Karlsruhe Institute of Technology (KIT), Karlsruhe, Baden-Württemberg, Germany A. Berry
Deontik, Brisbane, QLD, Australia N. Bojja
Machine Zone, Palo Alto, CA, USA R. Buyya
The University of Melbourne, Parkville, VIC, Australia; Manjrasoft Pty Ltd, Melbourne, VIC, Australia
W. Chen
University of News South Wales, Sydney, NSW, Australia C. Deerosejanadej
King Mongkut’s University of Technology Thonburi, Bangkok, Thailand A. Diaz-Perez
Cinvestav-Tamaulipas, Tamps., Mexico H. Ding
Xi’an Jiaotong University, Shaanxi, China X. Dong
Huazhong University of Science and Technology, Wuhan, Hubei, China H. Duan
The University of Melbourne, Parkville, VIC, Australia S. Dutta
Max Planck Institute for Informatics, Saarbruecken, Saarland, Germany A. Garcia-Robledo
Cinvestav-Tamaulipas, Tamps., Mexico V. Gramoli
University of Sydney, Sydney, NSW, Australia X. Gu
Huazhong University of Science and Technology, Wuhan, Hubei, China J. Han
Xi’an Jiaotong University, Shaanxi, China B. He
S. Ibrahim
Inria Rennes – Bretagne Atlantique, Rennes, France Z. Jiang
Xi’an Jiaotong University, Shaanxi, China S. Kannan
Machine Zone, Palo Alto, CA, USA S. Karuppusamy
Machine Zone, Palo Alto, CA, USA A. Kejariwal
Machine Zone, Palo Alto, CA, USA B.-S. Lee
Nanyang Technological University, Singapore, Singapore Y.C. Lee
Macquarie University, Sydney, NSW, Australia X. Li
Tsinghua University, Beijing, China R. Li
Huazhong University of Science and Technology, Wuhan, Hubei, China K. Li
State University of New York–New Paltz, New Paltz, NY, USA H. Liu
Huazhong University of Science and Technology, Wuhan, China P. Lu
University of Sydney, Sydney, NSW, Australia K.-T. Lu
Washington State University, Vancouver, WA, United States Z. Milosevic
Deontik, Brisbane, QLD, Australia G. Morales-Luna
Cinvestav-IPN, Mexico City, Mexico A. Narang
Data Science Mobileum Inc., Gurgaon, HR, India A. Nedunchezhian
Machine Zone, Palo Alto, CA, USA D. Nguyen
Washington State University, Vancouver, WA, United States L. Ou
S. Prom-on
King Mongkut’s University of Technology Thonburi, Bangkok, Thailand Z. Qin
Hunan University, Changsha, China F.A. Rabhi
University of News South Wales, Sydney, NSW, Australia K. Ramamohanarao
The University of Melbourne, Parkville, VIC, Australia T. Ryan
University of Sydney, Sydney, NSW, Australia R.O. Sinnott
The University of Melbourne, Parkville, VIC, Australia S. Sun
The University of Melbourne, Parkville, VIC, Australia Y. Sun
The University of Melbourne, Parkville, VIC, Australia S. Tang
Tianjin University, Tianjin, China P. Venkateshan
Machine Zone, Palo Alto, CA, USA S. Wallace
Washington State University, Vancouver, WA, United States P. Wang
Machine Zone, Palo Alto, CA, USA C. Wu
The University of Melbourne, Parkville, VIC, Australia W. Xi
Xi’an Jiaotong University, Shaanxi, China Z. Xue
Huazhong University of Science and Technology, Wuhan, Hubei, China H. Yin
Hunan University, Changsha, China G. Zhang
Tsinghua University, Beijing, China M. Zhanikeev
Tokyo University of Science, Chiyoda-ku, Tokyo, Japan X. Zhao
W. Zheng
Tsinghua University, Beijing, China A.C. Zhou
Nanyang Technological University, Singapore, Singapore A.Y. Zomaya
xix
Dr. Rajkumar Buyya is a Fellow of IEEE, a professor of Computer Science and Software Engineering, a Future Fellow of the Australian Research Council, and director of the Cloud Computing and Distributed Systems (CLOUDS) Laboratory at the University of Melbourne, Australia. He is also serving as the founding CEO of Manjrasoft, a spin-off company of the University, commercializing its innovations in cloud computing. He has authored over 500 publications and four textbooks, in-cluding Mastering Cloud Computing, published by McGraw Hill, China Machine Press, and Morgan Kaufmann for Indian, Chinese and international markets respectively. He also edited several books in-cluding Cloud Computing: Principles and Paradigms (Wiley Press, USA, Feb. 2011). He is one of the most highly cited authors in computer science and software engineering worldwide (h-index=98, g-index=202, 44800+ citations). The Microsoft Academic Search Index ranked Dr. Buyya as the world’s top author in distributed and parallel computing between 2007 and 2015. A Scientometric Analysis of Cloud Computing Literature by German scientists ranked Dr. Buyya as the World’s Top-Cited (#1) Author and the World’s Most-Productive (#1) Author in Cloud Computing.
Software technologies for grid and cloud computing developed under Dr. Buyya’s leadership have gained rapid acceptance and are in use at several academic institutions and commercial enterprises in 40 countries around the world. Dr. Buyya has led the establishment and development of key com-munity activities, including serving as foundation chair of the IEEE Technical Committee on Scalable Computing and five IEEE/ACM conferences. These contributions and international research leader-ship of Dr. Buyya are recognized through the award of 2009 IEEE TCSC Medal for Excellence in Scalable Computing from the IEEE Computer Society TCSC. Manjrasoft’s Aneka Cloud technology that was developed under his leadership has received 2010 Frost & Sullivan New Product Innovation Award. Recently, Manjrasoft has been recognized as one of the Top 20 Cloud Computing Companies by the Silicon Review Magazine. He served as the foundation editor-in-chief of “IEEE Transactions on Cloud Computing”. He is currently serving as co-editor-in-chief of Journal of Software: Practice and Experience, which was established 40+ years ago. For further information on Dr. Buyya, please visit his cyberhome: www.buyya.com.
Dr. Rodrigo N. Calheiros is a research fellow in the Department of Computing and Information Systems at The University of Melbourne, Australia. He has made major contributions to the fields of Big Data and cloud computing since 2009. He designed and developed CloudSim, an open source tool for the simulation of cloud platforms used at research centers, universities, and companies worldwide.
xxi Rapid advances in digital sensors, networks, storage, and computation, along with their availability at low cost, are leading to the creation of huge collections of data. Initially, the drive for generation and storage of data came from scientists; telescopes and instruments such as the Large Hadron Collider (LHC) generate a huge amount of data that needed to be processed to enable scientific discovery. LHC, for example, was reported as generating as much as 1 TB of data every second. Later, with the popular-ity of the SMAC (social, mobile, analytics, and cloud) paradigm, enormous amount of data started to be generated, processed, and stored by enterprises. For instance, Facebook in 2012 reported that the company processed over 200 TB of data per hour. In fact, SINTEF (The Foundation for Scientific and Industrial Research) from Norway reports that 90% of the world’s data generated has been generated in the last 2 years. These were the key motivators towards the Big Data paradigm.
Unlike traditional data warehouses that rely in highly structured data, this new paradigm unleashes the potential of analyzing any source of data, whether structured and stored in relational databases; semi-structured and emerging from sensors, machines, and applications; or unstructured obtained from social media and other human sources.
This data has the potential to enable new insights that can change the way business, science, and governments deliver services to their consumers and can impact society as a whole. Nevertheless, for this potential to be realized, new algorithms, methods, infrastructures, and platforms are required that can make sense of all this data and provide the insights while they are still of interest for analysts of diverse domains.
This has led to the emergence of the Big Data computing paradigm focusing on the sensing, col-lection, storage, management and analysis of data from variety of sources to enable new value and insights. This paradigm enhanced considerably the capacity of organizations to understand their activities and improve aspects of its business in ways never imagined before; however, at the same time, it raises new concerns of security and privacy whose implications are still not completely understood by society.
To realize the full potential of Big Data, researchers and practitioners need to address several chal-lenges and develop suitable conceptual and technological solutions for tackling them. These include life-cycle management of data; large-scale storage; flexible processing infrastructure; data modeling; scalable machine learning and data analysis algorithms; techniques for sampling and making trade-off between data processing time and accuracy and dealing with privacy and ethical issues involved in data sensing, storage, processing, and actions.
This book addresses the above issues by presenting a broad view of each of the issues, identifying challenges faced by researchers and opportunities for practitioners embracing the Big Data paradigm.
ORGANIZATION OF THE BOOK
The content of the book is organized into four parts:
I. Big Data Science
II. Big Data Infrastructures and Platforms
III. Big Data Security and Privacy
IV. Big Data Applications
PART I: BIG DATA SCIENCE
Data Science is a discipline that emerged in the last few years, as did the Big Data concept. Although there are different interpretations of what Data Science is, we adopt the view that Data Science is a discipline that merges concepts from computer science (algorithms, programming, machine learning, and data mining), mathematics (statistics and optimization), and domain knowledge (business, applica-tions, and visualization) to extract insights from data and transform it into actions that have an impact in the particular domain of application. Data Science is already challenging when the amount of data enables traditional analysis, which thus becomes particularly challenging when traditional methods lose their effectiveness due to large volume and velocity in the data.
Part I presents fundamental concepts and algorithms in the Data Science domain that address the issues rose by Big Data. As a motivation for this part and in the same direction as what we discussed so far, Chapter 1 discusses how what is now known as Big Data is the result of efforts in two distinct areas, namely machine learning and cloud computing.
The velocity aspect of Big Data demands analytic algorithms that can operate data in motion, ie, algorithms that do not assume that all the data is available all the time for decision making, and deci-sions need to be made “on the go,” probably with summaries of past data. In this direction, Chapter 2 discusses real-time processing systems for Big Data, including stream processing platforms that enable analysis of data in motion and a case study in finance.
The volume aspect of data demands that existing algorithms for different analytics data are adapted to take advantage of distributed systems where memory is not shared, and thus different machines have only part of data to operate. Chapter 3 discusses how it affects natural language processing, text mining, and anomaly detection in the context of social media.
A concept that emerged recently benefiting from Big Data is deep learning. The approach, derived from artificial neural networks, constructs layered structures that hold different abstractions of the same data and has application in language processing and image analysis, among others. Chapter 4 discusses algorithms that can leverage modern GPUs to speed up computation of Deep Learning models.
Another concept popularized in the last years is graph processing, a programming model where an abstraction of a graph (network) of nodes and vertices represents the computation to be carried out. Likewise the previous chapter, Chapter 5 discusses GPU-based algorithms for graph processing.
PART II: BIG DATA INFRASTRUCTURES AND PLATFORMS
different abstractions for programmers arose that enable problems to be represented in different ways. Thus, instead of adapting the problem to fit a programming model, developers are now able to select the abstraction that is closer to the problem at hand, enabling faster more correct software solutions to be developed. The same revolution observed in the computing part of the analytics is also observed in the storage part; in the last years, new methods were developed and adopted to persist data that are more flexible than traditional relational databases.
Part II of this book is dedicated to such infrastructure and platforms supporting Big Data. Starting with database support, Chapter 6 discusses the different models of NOSQL database models and sys-tems that are available for storage of large amounts of structured, semi-structured and structured data, including key-value, column-based, graph-based, and document-based stores.
As the infrastructures of choice for running Big Data analytics are shared (think of clusters and clouds), new methods were necessary to rationalize the use of resources so that all applications get their fair share of resources and can progress to a result in a reasonable amount of time. In this direction, Chapter 7 discusses the general problem of resource management techniques for Big Data frameworks and a new efficient technique for resource management implemented in Apache YARN. Chapter 8 pres-ents a novel technique for increasing resource usage and performance of Big Data platforms by applying a “resource-shaping” technique, whereas Chapter 9 contains a survey on various techniques for optimi-zation of many aspects of the Hadoop framework, including the job scheduler, HDFS, and Hbase.
Whereas the previous three chapters focused on distributed platforms for Big Data analytics, paral-lel platforms, which rely on many computing cores sharing memory, are also viable platforms for Big Data analytics. In this direction, Chapter 10 discusses an alternative solution that is optimized to take advantage of the large amount of memory and large number of cores available in current servers.
PART III: BIG DATA SECURITY AND PRIVACY
For economic reasons, physical infrastructures supporting Big Data are shared. This helps in rational-izing the huge costs involved in building such large-scale cloud infrastructures. Thus, whether the infrastructure is a public cloud or a private cloud, multitenancy is a certainty that raises security and privacy concerns. Moreover, the sources of data can reveal many things about its source; although many times sources will be applications and the data generated is in public domain, it is also possible that data generated by devices and actions of humans (eg, via posts in social networks) can be analyzed in a way that individuals can be identified and/or localized, an issue that also raises privacy issues. Part III of this book is dedicated to such security and privacy issues of Big Data.
Chapter 11 addresses the issue of spatial privacy of users of social networks and the threats to it enabled by Big Data analytics. Chapter 12 addresses the issue of the use of shared resources for Big Data computing and ways to protect queries and prevent loss of privacy on correlated data.
Chapter 13 is dedicated to methods to perform consumer analytics when shopping. It introduces methods to infer the location of mobile devices and to estimate human behavior in shopping activities.
PART IV: BIG DATA APPLICATIONS
case, and a range of applications in the most diverse areas were developed to fulfill the goal of deliver-ing value via Big Data analytics. These days, financial institutions, governments, educational institu-tions, and researchers, to name a few, are applying Big Data analytics on a daily basis as part of their business as usual tasks. Part IV of this book is dedicated to such applications, featuring interesting use cases of the application of Big Data analytics.
Social media arose in the last 10 years, initially as a means to connect people. Now, it has emerged as a platform for businesses purposes, advertisements, delivery of news of public interest, and for people to express their opinions and emotions. Chapter 14 introduces an application in this context, namely a Big Data framework for mining opinion from social media in Thailand. In the same direction, Chapter 15 presents an interesting case study of application of Big Data Analytics to mine social media to evaluate the effect of the weather in people’s emotions.
The entertainment industry can also benefit from Big Data, as demonstrated in Chapter 16, with an application of Big Data analytics for optimization of delivery of video on demand via the Internet.
Big Data analytics is also disrupting core traditional sectors. As an example, Chapter 17 presents a case study on application of Big Data Analytics in the energy sector; the chapter shows how data generated by smart distribution lines (smart grids) can be analyzed to enable identification of faults in the transmission line.
xxv We thank all the contributing authors for their time, effort, and dedication during the preparation of this book.
Raj would like to thank his family members, especially his wife, Smrithi, and daughters, Soumya and Radha Buyya, for their love, understanding, and support during the preparation of this book. Rodrigo would like to thank his wife, Kimie, his son, Roger, and his daughter, Laura. Amir would like to thank his wife, Elly, and daughter, Diana.
Finally, we would like to thank the staff at Morgan Kauffman, particularly, Amy Invernizzi, Brian Romer, Punitha Govindaradjane, and Todd Green for managing the publication in record time.
Rajkumar Buyya The University of Melbourne and Manjrasoft Pty Ltd, Australia
Rodrigo N. Calheiros The University of Melbourne, Australia
3 . http://dx.doi.org/10.1016/B978-0-12-805394-2.00001-5
Big Data
© 2016 Elsevier Inc. All rights reserved.
BIG DATA ANALYTICS = MACHINE
LEARNING
+
CLOUD COMPUTING
C. Wu, R. Buyya, K. Ramamohanarao
1.1 INTRODUCTION
Although the term “Big Data” has become popular, there is no general consensus about what it really means. Often, many professional data analysts would imply the process of extraction, transformation, and load (ETL) for large datasets as the connotation of Big Data. A popular description of Big Data is based on three main attributes of data: volume, velocity, and variety (or 3Vs). Nevertheless, it does not capture all the aspects of Big Data accurately. In order to provide a comprehensive meaning of Big Data, we will investigate this term from a historical perspective and see how it has been evolving from yesterday’s meaning to today’s connotation.
Historically, the term Big Data is quite vague and ill defined. It is not a precise term and does not carry a particular meaning other than the notion of its size. The word “big” is too generic; the ques-tion how “big” is big and how “small” is small [1] is relative to time, space, and circumstance. From an evolutionary perspective, the size of “Big Data” is always evolving. If we use the current global Internet traffic capacity [2] as a measuring stick, the meaning of Big Data volume would lie between the terabyte (TB or 1012 or 240) and zettabyte (ZB or 1021 or 270) range. Based on the historical data traffic growth rate, Cisco claimed that humans have entered the ZB era in 2015 [2]. To understand the significance of the data volume’s impact, let us glance at the average size of different data files shown in Table 1.
The main aim of this chapter is to provide a historical view of Big Data and to argue that it is not just 3Vs, but rather 32Vs or 9Vs. These additional Big Data attributes reflect the real motivation behind Big Data analytics (BDA). We believe that these expanded features clarify some basic questions about the essence of BDA: what problems Big Data can address, and what problems should not be confused as BDA. These issues are covered in the chapter through analysis of historical developments, along with associated technologies that support Big Data processing. The rest of the chapter is organized into eight sections as follows:
1) A historical review for Big Data
2) Interpretation of Big Data 3Vs, 4Vs, and 6Vs
3) Defining Big Data from 3Vs to 32Vs 4) Big Data and Machine Learning (ML)
5) Big Data and cloud computing
6) Hadoop, Hadoop distributed file system (HDFS), MapReduce, Spark, and Flink
7) ML + CC (Cloud Computing) → BDA and guidelines
8) Conclusion
1.2 A HISTORICAL REVIEW OF BIG DATA
In order to capture the essence of Big Data, we provide the origin and history of BDA and then propose a precise definition of BDA.
1.2.1 THE ORIGIN OF BIG DATA
Several studies have been conducted on the historical views and developments in the BDA area. Gil Press [3] provided a short history of Big Data starting from 1944, which was based on Rider’s work [4]. He covered 68 years of history of evolution of Big Data between 1944 and 2012 and illustrated 32 Big Data-related events in recent data science history. As Press indicated in his article, the fine line be-tween the growth of data and Big Data has become blurred. Very often, the growth rate of data has been referred as “information explosion”; although “data” and “information” are often used interchangeably, the two terms have different connotations. Press’ study is quite comprehensive and covers BDA events up to December 2013. Since then, there have been many relevant Big Data events. Nevertheless, Press’ review did cover both Big Data and data science events. To this extent, the term “data science” could be considered as a complementary meaning to BDA.
In comparison with Press’ review, Frank Ohlhorst [5] established the origin of Big Data back to 1880 when the 10th US census was held. The real problem during the 19th century was a statistics issue, which was how to survey and document 50 million of North American citizens. Although Big Data may contain computations of some statistics elements, these two terms have different interpretations today. Similarly, Winshuttle [6] believes the origin of Big Data was in the 19th century. Winshuttle argue if data sets are so large and complex and beyond traditional process and management capability, then these data sets can be considered as Big Data. In comparison to Press’ review, Winshuttle’s review emphasizes enterprise resource planning and implementation on cloud infrastructure. Moreover, the review also makes a predication for data growth to 2020. The total time span of the review was more than 220 years. Winshuttle’s Big Data history included many SAP events and its data products, such as HANA.
The longest span of historical review for Big Data belongs to Bernard Marr’s description [7]. He traced the origin of Big Data back to 18,000 BCE. Marr argued that we should pay attention to historical
Table 1 Typical Size of Different Data Files
Media Average Size of Data File Notes (2014)
Web page 1.6–2 MB Average 100 objects
eBook 1–5 MB 200–350 pages
Song 3.5–5.8 MB Average 1.9 MB/per minute (MP3) 256 Kbps rate (3 mins)
foundations of Big Data, which are different approaches for human to capture, store, analyze, and re-trieve both data and information. Furthermore, Marr believed that the first person who casted the term “Big Data” was Erik Larson [8], who presented an article for Harper’s Magazine that was subsequently reprinted in The Washington Post in 1989 because there were two sentences that consisted of the words of Big Data: “The keepers of Big Data say they do it for the consumer’s benefit. But data have a way of being used for purposes other than originally intended.”
In contrast, Steve Lohr [9] disagrees with Marr’s view. He argues that just adopting the term alone might not have the connotation of today’s Big Data because “The term Big Data is so generic that the hunt for its origin was not just an effort to find an early reference to those two words being used together. Instead, the goal was the early use of the term that suggests its present interpretation — that is, not just a lot of data, but different types of data handled in new ways.” This is an important point. Based on this reasoning, we consider that Cox and Ellsworth [10] as proposers of the term Big Data because they assigned a relatively accurate meaning to the existing view of Big Data, which they stated, “…data sets are generally quite large, taxing the capacities of main memory, local disk and even remote disk. We call this the problem of Big Data. When data sets do not fit in main memory (in core), or when they do not fit even on local disk…” Although today’s term may have an extended meaning as opposed to Cox and Ellsworth’s term, this definition reflects today’s connotation with reasonable accuracy.
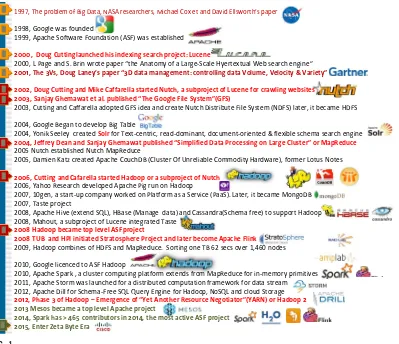
Another historical review was contributed by Visualizing.org [11]. It focused on the timeline of how to implement BDA. Its historical description is mainly determined by events related to the Big Data push by many Internet and IT companies, such as Google, YouTube, Yahoo, Facebook, Twitter, and Apple. It emphasized the significant impact of Hadoop in the history of BDA. It primarily highlighted the significant role of Hadoop in the BDA. Based on these studies, we show the history of Big Data, Hadoop, and its ecosystem in Fig. 1.
Undoubtedly, there will be many different views based on different interpretations of BDA. This will inevitably lead to many debates of Big Data implication or pros and cons.
1.2.2 DEBATES OF BIG DATA IMPLICATION
ProsThere have been many debates regarding Big Data’s pros and cons during the past few years. Many advocates declare Big Data to be a new rock star [12] and that it will be the next frontier [13,14] for innovation, competition, and productivity because data is embedded in the modern human being’s life. Data that are generated every second by both machines and humans is a byproduct of all other activi-ties. It will become the new epistemologies [15] in science. To certain degree, Mayer and Cukier [16] argued that Big Data would revolutionize our way of thinking, working, and living. They believe that a massive quantitative data accumulation will lead to qualitative advances at the core of BDA: ML, paral-lelism, metadata, and predictions: “Big Data will be a source of new economic value and innovation” [16]. Their conclusion is that data can speak for itself, and we should let the data speak.
Cons
In contrast, some argue that Big Data is inconclusive, overstated, exaggerated, and misinformed by the media and that data cannot speak for itself [18]. It does not matter how big the data set is. It could be just another delusion because “it is like having billions of monkeys typing, one of them will write Shakespeare” [19]. In Dobelli’s term [20], we should “never judge a decision by its outcome — out-come bias.” In other words, if one of the monkeys can type Shakespeare, we cannot conclude or infer-ence that a monkey has sufficient intelliginfer-ence to be Shakespeare.
Gary Drenik [21] believed that the sentiment of the overeager adoption of Big Data is more like “Extraordinary Popular Delusion and the Madness of Crowds,” the description made by Charles Mackay [22] in his famous book’s title. Psychologically, it is a kind of a crowd emotion that seems to have a perpetual feedback loop. Drenik quoted this “madness” with Mackay’s warning: “We find that whole communities suddenly fix their minds upon one subject, and go mad in its pursuit; that millions of people become simultaneously impressed with one delusion, and run it till their attention is caught
1997, The problem of Big Data, NASA researchers, Michael Cox et and David Ellsworth’s paper
1998, Google was founded
1999, Apache Software Foundation (ASF) was established
2000, Doug Cutting launched his indexing search project: Lucene
2000, L Page and S. Brin wrote paper “the Anatomy of a Large-Scale Hyertextual Web search engine” 2001, The 3Vs, Doug Laney’s paper “3D data management: controlling data Volume, Velocity & Variety”
2002, Doug Cutting and Mike Caffarella started Nutch, a subproject of Lucene for crawling websites 2003, Sanjay Ghemawat et al. published “The Google File System”(GFS)
2003, Cutting and Caffarella adopted GFS idea and create Nutch Distribute File System (NDFS) later, it became HDFS
2004, Google Began to develop Big Table
2004, Yonik Seeley created Solrfor Text-centric, read-dominant, document-oriented & flexible schema search engine
2004, Jeffrey Dean and Sanjay Ghemawat published “Simplified Data Processing on Large Cluster” or MapReduce
2005 Nutch established Nutch MapReduce
2005, Damien Katz created Apache CouchDB (Cluster Of Unreliable Commodity Hardware), former Lotus Notes
2006, Cutting and Cafarella started Hadoop or a subproject of Nutch
2006, Yahoo Research developed Apache Pig run on Hadoop
2007, 10gen, a start-up company worked on Platform as a Service (PaaS). Later, it became MongoDB 2007, Taste project
2008, Apache Hive (extend SQL), HBase (Manage data) and Cassandra(Schema free) to support Hadoop 2008, Mahout, a subproject of Lucene integrated Taste
2008 Hadoop became top level ASF project
2008 TUB and HPI initiated Stratosphere Project and later become Apache Flink
2009, Hadoop combines of HDFS and MapReduce. Sorting one TB 62 secs over 1,460 nodes
2010, Google licenced to ASF Hadoop
2010, Apache Spark , a cluster computing platform extends from MapReduce for in-memory primitives 2011, Apache Storm was launched for a distributed computation framework for data stream 2012, Apache Dill for Schema-Free SQL Query Engine for Hadoop, NoSQL and cloud Storage
2012, Phase 3 of Hadoop – Emergence of “Yet Another Resource Negotiator”(YARN) or Hadoop 2
2013 Mesos became a top level Apache project
2014, Spark has > 465 contributors in 2014, the most active ASF project 2015, Enter Zeta Byte Era
FIG. 1
by some new folly more captivating than the first.” The issue that Drenik has noticed was “the hype overtaken reality and there was little time to think about” regarding Big Data. The former Obama’s campaign CTO: Harper Reed, had the real story in terms of adoption of BDA. His remarks of Big Data were “literally hard” and “expensive” [23].
Danah Boyd et al. [24] are quite skeptical in regarding big data in terms of its volume. They argued that bigger data are not always better data from a social science perspective. In responding to “The End of Theory” [25] proposition, Boyd asserted that theory or methodology is still highly relevant for today’s statistical inference and “The size of data should fit the research question being asked; in some cases, small is best.” Boyd et al. suggested that we should not pay a lot of attention to the volume of data. Philosophically, this argument is similar to the debate between John Stuart Mill (Mill’s five clas-sical or empirical methods) and his critics [26]. Mill’s critics argued that it is impossible to bear on the intelligent question just by ingesting as much as data alone without some theory or hypothesis. This means that we cannot make Big Data do the work of theory.
Another Big Data critique comes from David Lazer et al. [27]. They demonstrated that the Google flu trends (GFT) prediction is the parable and identified two issues (Big Data hubris and algorithm dynamics) that contributed to GFT’s mistakes. The issue of “Big Data hubris” is that some observers believe that BDA can replace traditional data mining completely. The issue of “algorithm dynamics” is “the changes made by [Google’s] engineers to improve the commercial service and by consumers in us-ing that service.” In other words, the changus-ing algorithms for searchus-ing will directly impact the users’ behavior. This will lead to the collected data that is driven by deliberated algorithms. Lazer concluded there are many traps in BDA, especially for social media research. Their conclusion was “we are far from a place where they (BDA) can supplant more traditional methods or theories.”
All these multiple views are due to different interpretations of Big Data and different implementa-tions of BDA. This suggests that in order to resolve these issues, we should first clarify the definition of the term BDA and then discover the clash point based on the same term.
1.3 HISTORICAL INTERPRETATION OF BIG DATA
1.3.1 METHODOLOGY FOR DEFINING BIG DATA
Intuitively, neither yesterday’s data volume (absolute size) nor that of today can be defined as “big.” Moreover, today’s “big” may become tomorrow’s “small.” In order to clarify the term Big Data pre-cisely and settle the debate, we can investigate and understand the functions of a definition based on the combination of Robert Baird [28] and Irving Copi’s [29] approaches (see Fig. 2).
Based on Baird or Irving’s approach of definition, we will first investigate the historical definition from an evolutionary perspective (lexical meaning). Then, we extend the term from 3Vs to 9Vs or 32Vs based on its motivation (stipulative meaning), which is to add more attributes for the term. Finally, we will eliminate ambiguity and vagueness of the term and make the concept more precise and meaningful.
1.3.2 DIFFERENT ATTRIBUTES OF DEFINITIONS
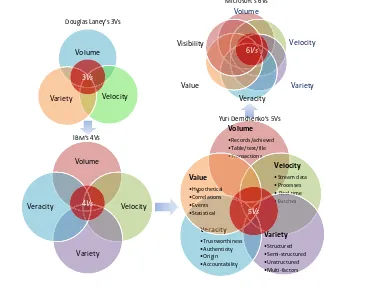
Gartner — 3Vs definitionwhite paper published by Meta group, which Gartner subsequently acquired in 2004. Douglas noticed that due to surging of e-commerce activities, data has grown along three dimensions, namely:
1. Volume, which means the incoming data stream and cumulative volume of data
2. Velocity, which represents the pace of data used to support interaction and generated by interactions
3. Variety, which signifies the variety of incompatible and inconsistent data formats and data structures
According to the history of the Big Data timeline [30], Douglas Laney’s 3Vs definition has been widely regarded as the “common” attributes of Big Data but he stopped short of assigning these attri-butes to the term “Big Data.”
IBM — 4Vs definition
IBM added another attribute or “V” for “Veracity” on the top of Douglas Laney’s 3Vs notation, which is known as the 4Vs of Big Data. It defines each “V” as following [31,32]:
1. Volume stands for the scale of data
2. Velocity denotes the analysis of streaming data
3. Variety indicates different forms of data
4. Veracity implies the uncertainty of data
Zikopoulos et al. explained the reason behind the additional “V” or veracity dimension, which is “in response to the quality and source issues our clients began facing with their Big Data initiatives” [33]. They are also aware of some analysts including other V-based descriptors for Big Data, such as vari-ability and visibility.
Microsoft — 6Vs definition
For the sake of maximizing the business value, Microsoft extended Douglas Laney’s 3Vs attributes to 6 Vs [34], which it added variability, veracity, and visibility:
1. Volume stands for scale of data
2. Velocity denotes the analysis of streaming data
3. Variety indicates different forms of data
4. Veracity focuses on trustworthiness of data sources
5. Variability refers to the complexity of data set. In comparison with “Variety” (or different data format), it means the number of variables in data sets
6. Visibility emphasizes that you need to have a full picture of data in order to make informative decision
More Vs for big data
A 5 Vs’ Big Data definition was also proposed by Yuri Demchenko [35] in 2013. He added the value dimension along with the IBM 4Vs’ definition (see Fig. 3). Since Douglas Laney published 3Vs in 2001, there have been additional “Vs,” even as many as 11 [36].
All these definitions, such as 3Vs, 4Vs, 5Vs, or even 11 Vs, are primarily trying to articulate the aspect of data. Most of them are data-oriented definitions, but they fail to articulate Big Data clearly in a relationship to the essence of BDA. In order to understand the essential meaning, we have to clarify what data is.
Data is everything within the universe. This means that data is within the existing limitation of technological capacity. If the technology capacity is allowed, there is no boundary or limitation for
Volume
data. The question is why we should capture it in the first place. Clearly, the main reason of capturing data is not because we have enough capacity to capture high volume, high velocity, and high variety data rather than to find a better solution for our research or business problem, which is to search for actionable intelligence. Pure data-driven analysis may add little value for a decision maker; sometimes, it may only add the burden for the costs or resources of BDA. Perhaps this is why Harper believes Big Data is really hard [23].
1.3.3 SUMMARY OF 7 TYPES DEFINITIONS OF BIG DATA
Table 2 shows seven types of definitions, summarized by Timo Elliott [36] and based on more than 33 Big Data definitions [41].
Each of the above definitions intends to describe a particular issue from one aspect of Big Data only and is very restrictive. However, a comprehensive definition can become complex and very long. A solution for this issue is to use “rational reconstruction” offered by Karl Popper, which intends to make the reasons behind practice, decision, and process explicit and easier to understand.
1.3.4 MOTIVATIONS BEHIND THE DEFINITIONS
The purpose of Big Data or BDA is to gain hindsight (ie, metadata patterns emerging from historical data), insight (ie, deep understanding of issues or problems), and foresight (ie, accurate prediction in near future) in a cost-effective manner. However, these important and necessary attributes are often
Table 2 Seven Popular Big Data Definitions
No Type Description
1 The original big data (3Vs)
The original type of definition is referred to Douglas Laney’s volume, velocity, and variety, or 3Vs. It has been widely cited since 2001. Many have tried to extend the number of Vs, such as 4Vs, 5Vs, 6Vs … up to 11Vs
2 Big Data as technology
This type of definition is oriented by new technology development, such as MapReduce, bulk synchronous parallel (BSP — Hama), resilient distributed datasets (RDD, Spark), and Lambda architecture (Flink)
3 Big Data as application
This kind of definition emphasizes different applications based on different types of big data. Barry Devlin [37] defined it as application of process-mediated data, human-sourced information, and machine-generated data. Shaun Connolly [38] focused on analyzing transactions, interactions, and observation of data. It looks for hindsight of data 4 Big Data as
signals
This is another type of application-oriented definition, but it focuses on timing rather than the type of data. It looks for a foresight of data or new “signal” pattern in dataset 5 Big Data as
opportunity
Matt Aslett [39]: “Big data as analyzing data that was previously ignored because of technology limitations.” It highlights many potential opportunities by revisiting the collected or archived datasets when new technologies are variable
6 Big Data as metaphor
It defines Big Data as a human thinking process [40]. It elevates BDA to the new level, which means BDS is not a type of analytic tool rather it is an extension of human brain 7 Big Data as
new term for old stuff
neglected by many definitions that only focus on either single-issue or data aspects. In order to reflect all aspects of Big Data, we consider all attributes from different aspects.
1.4 DEFINING BIG DATA FROM 3V
STO 3
2V
SThe real objective of BDA is actually to seek for business intelligence (BI). It enables decision makers to make the right decisions based on predictions through the analysis of available data. Therefore, we need to clarify new attributes of Big Data and establish their relationship meaning cross three aspects (or domain knowledge), namely:
• Data domain (searching for patterns)
• Business intelligence domain (making predictions) • Statistical domain (making assumptions)
1.4.1 DATA DOMAIN
Laney’s 3Vs have captured the importance of Big Data characteristics reflecting the pace and explo-ration phenomena of data growth during the last few years. In this, the key attribute in data aspect is volume. If we look the history of data analytics, the variation of velocity and variety is relatively small in comparison with volume. The dominated V that often exceeds our current capacity for data process-ing is volume. Although volume cannot determine all attributes of data, it is one of the crucial factors in BDA.
1.4.2 BUSINESS
[1]INTELLIGENT (BI) DOMAIN
When we discuss BI of BDA, we mean value, visibility, and verdict within the business intelligent domain. These 3Vs are the motivations or drivers for us to implement BDA process at the first place. If we cannot achieve BI, the pure exercise of data analytics will be meaningless. From a decision maker’s perspective, these 3Vs are how to leverage data’s 3Vs for BI’s 3Vs.
• Visibility: It does not only focus on the insight but also focuses on metadata or sometimes the wisdom of data crowds or hierarchical level of abstraction data patterns. From a BI perspective, it provides hindsight, insight, and foresight of a problem and an adequate solution associated with it.
• Value: the purpose of V for value is to answer the question of “Does the data contain any
valuable information for my business needs?” In comparison with 5Vs definition, it is not just the value of data but also the value of BI for problem solving. It is the value and utility for the long-term or strategic pay off.
• Verdict: It is a potential choice or decision that should be made by a decision maker or committee based on the scope of the problem, available resources, and certain computational capacity. This
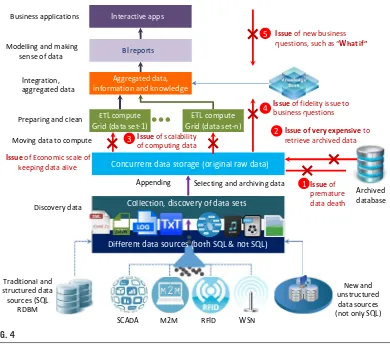
is the most challenging V to be quantified at the beginning of BDA. If there are many hypotheses or “What-ifs,” the cost of collecting, retrieving data, and ETL, especially to extract archived data, will be costly (see Fig. 4).
These business motivations led to the new BDA platforms or MapReduce processing frameworks, such as Hadoop. It intends to answer the five basic questions in Big Data, as shown in Fig. 4. These questions reflect the bottom line of BI:
1. How to store massive data (such as in PB or EB scale currently) or information in the available resources
2. How to access these massive data or information quickly
3. How to work with datasets in variety formats: structured, semi-structured, and unstructured
4. How to process these datasets in a full scalable, fault tolerant, and flexible manner
5. How to extract BI interactively and cost-effectively
Concurrent data storage (original raw data)
Collection, discovery of data sets
Different data sources (both SQL & not SQL)
ETL compute
Issue of Economic scale of
keeping data alive
ETL compute Grid (data set-n)
FIG. 4
In this domain, the key notation of V is visibility, which is to obtain the prediction or real-time in-sight from BDA exercises. The relationship of these 3Vs in BI is that without visibility, other 2Vs will be impossible.
1.4.3 STATISTICS DOMAIN
Similarly, we should have another set of 3 V attributes in the statistic domain, which are veracity, valid-ity, and variability. These 3Vs should establish the statistic models based on the right hypothesis (What if), which is the trustworthiness of the data sets and the reliability of the data sources. If the hypothesis is inadequate or the data source is contaminated or the statistics model is incorrect, the BDA might lead to a wrong conclusion. There have been many lessons regarding contaminated data samples. A famous example was the opinion poll for the 1936 US presidential election that was carried by Literary Digest
magazine before the election [42]. Because the sample data (2.4 million survey responses) were ac-cidentally contaminated, the result of their predication (or president winner in 1936) became a disaster for the polling company. Therefore, the statistics domain should consist of following attributes:
• Veracity: Philosophically speaking, it is the true information (or fact) is the resolution of data uncertainty. V of Veracity is searching for trustworthiness and certainty of data sets.
• Validity: It is to verify the quality of data being logically sound. The V of validity emphasizes how to correctly acquire data and avoid biases. Another essential meaning of validity is the inference process based on a statistical model.
• Variability: It is the implication of data complexity and variation. For example, Bruce Ratner [43] believed that if there are more than 50 variables or different features in one dataset, it could be considered as “Big Data.” Statistically, it is how to use the logical inference process to reduce data complexity and reach desirable outcomes or predictions for business needs.
The key attribute of this aspect is veracity, which emphasizes how to build a statistical model close to the reality. The process to approach veracity can be considered an exercise of a curve fitting: If we have few constraints, the regression errors of the curve will be too large. If we adopt too many con-straints, it will cause an overfitting problem.
1.4.4 3
2V
SDEFINITION AND BIG DATA VENN DIAGRAM
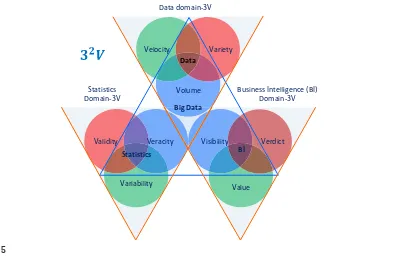
Once all 32 Vs attributes have been defined from three different aspects, we can establish a combined Venn diagram and their relationships. This has become our definition of Big Data (see Fig. 5), which is comprehensive enough to capture all aspects of Big Data.
As shown in Fig. 5, each Venn diagram is supported by one V shape of a triangle to illustrate 3Vs’ attributes in one aspect. Moreover, three key attributes from each Venn diagram can also form a single hierarchical triangle diagram. It represents the essential meaning of Big Data.
1.5 BIG DATA ANALYTICS AND MACHINE LEARNING
1.5.1 BIG DATA ANALYTICS
If 32Vs represent semantic meaning of Big Data, then BDA represents pragmatic meaning of Big Data. We can view from computational viewpoint, Big Data Venn diagram with a BDA’s Venn diagram in Fig. 6.
According to Arthur Samuel, the original definition of ML was “The field of study that gives com-puters (or machines) that ability to learn without being explicitly programmed” [44]. Historically, there have been many terms that intend to describe the equivalent meaning of ML, such as learning from data, pattern Recognition, data science, data mining, text mining, or even BI, etc. If we list all terms based on their different orientations, we can probably find there are more than 32 different descriptions that contain certain meanings of ML from four aspects (see Table 3):
• Data • Information • Knowledge • Intelligence
Volume Velocity Variety
Variability Validity Veracity
Value
Visibilityy Verdict Data
Statistics BI
Big Data Data domain-3V
Statistics Domain-3V
Business Intelligence (BI) Domain-3V
FIG. 5
1.5.2 MACHINE LEARNING
The essence of ML is an automatic process of pattern recognition by a learning machine. The main objective of ML is to build systems that can perform at or exceed human level competence in han-dling many complex tasks or problems. ML is a part of artificial intelligence (AI). During the early AI research era, the goal was to build robots and to simulate human activities. Later, the application of AI has been generalized to solve general problems by a machine. The popular solution was to feed a computer with algorithms (or a sequence of instructions) so it can transform the input data to output answers. This is often called a rule-based system or Good Old-Fashioned of Artificial Intelligence (GOFAI), such as expert systems.
However, we cannot easily find suitable algorithms for many problems; for example, the recogni-tion of human handwriting. We do not know how to transform the input of handwriting letter to the output of the standard recognized letter; an alternative is learning from data. The principle of learning from data is similar as both trial and error and “The Wisdom of Crowds” [45]. This means that having
3Vs Data
Correlation of 32Vs to machine learning Venn diagrams.
Table 3 Popular Interpretation of ML
Data Information Knowledge Intelligence
Data mining Information analytics Real-time analytics Business analysis Data science Information visualization Predictive analytics Business intelligence Data warehouse Information system
management
Machine learning Artificial intelligence
one trial could have a large error but if we can aggregate many trials, the error will be reduced down to an acceptable level or convergence. Fig. 7 illustrates a typical example of a ML process or learning from data.
Since the dotcom boom started in late 1990s, the volume of data has become increasingly larger. A logical question is how to deal with these large volumes of data and how to find useful or meaningful patterns from a larger volume of data. This leads to knowledge discovery in database, or KDD, which is also called data mining. In other words, we want to dig into the database and discover the meaning or knowledge for decision making. Larose et al. [47] defined the term as “the process of discovering useful patterns and trends in large datasets.” In order to discover meaningful patterns from a massive data set, statistics are the vital tools to add value to data sampling, modeling, analysis, interpretation, and presentation, just as Jiawei Han et al. [48] indicated, “Data mining has an inherent connection with statistics.” This leads to the converging of data mining and fuzzy expert system under the big umbrella of ML. From ML evolution perspective, the statistics theory or probability modeling has shifted AI discipline from rule-based expert systems or schema-on-write learning to a schema-on-read or data-driven methodology, which is to resolve the uncertainty issue with parameters’ probability of a model. From this perspective, the statistics have been embedded into ML. As Witten et al. [49] indicated, “In truth, you should not look for a dividing line between machine learning and statistics because there is a continuum — and a multidimensional one at that — of data analysis techniques.”
Real or ideal world :
Real unknown function (No control)
Sample data set (learning example)
1, 1 … ( , )
Learning algorithm R
Set of learning techniques or models
Final hypothesis or model:
Historical records
Learning formulas
Final solution
Process of learning or selecting and optimising
solution or model
Probability distribution
P
X
in
P
out e
FIG. 7
Since the 1950s, there have been many functional definitions of ML. Different authors would em-phasize different aspects of ML, such as process, application, and utility. For example, Arthur Samuel’s definition emphasized “automatically learning” of ML. Mitchell described every component of ML process [50]. Murphy [51] and Bishop [52], on the other hand, stressed the function of pattern recogni-tion. Nisan and Schocken [53] argued that ML could turn abstract thoughts into a physical operarecogni-tion. In the summary of over 30 definitions, we can find some essential and common ingredients of these ML definitions:
• Train the machine to learn automatically and improve results as it gets more data • Discover or recognize patterns and intelligence with input data
• Predicate on unknown inputs
• The machine will acquire knowledge directly from data and solve problems
According to these elements, we can find that fundamentally, ML is “an outgrowth of the intersec-tion of computer science and statistics, aims to automatically learn to recognize complex patterns and make intelligent decisions based on existing datasets” [54]. Another way to say that is “Machine learn-ing is turnlearn-ing data into information” [55]. The ultimate goal of ML is to build systems that are of at the level of human competence (see Fig. 8) in performing complex tasks.
ML underpins the BDA implementation. Without ML to mine ever-growing massive data, BDA would be impossible. In conclusion, ML is the centerpiece of any BDA. All other components within a framework of Big Data aim to support ML process. In terms of computational support to BDA, there are four major architectural models that are able to process large amounts of data in a reasonable time, according to Wadkar et al. [56]:
• Massively parallel processing database system: For example, EMC’s Greenplum and IBM’s Netezza
• In-memory database systems, such as Oracle Exalytics, SAP’s HANA, and Spark
• MapReduce processing model and platforms such as Hadoop and Google File System (GFS) • Bulk Synchronous Parallel (BSP) systems such as Apache HAMA and Giraph
To perform BDA in the most cost-effective way, a fifth model, cloud computing (CC), has become a preferred solution especially for small and media businesses.
Human process 1
Inputs Outputs
Machine process 2
Inputs Outputs
Replacing
Human learning Machines learning
FIG. 8
1.6 BIG DATA ANALYTICS AND CLOUD COMPUTING
CC plays a critical role in the BDA process as it offers subscription-oriented access to computing infra-structure, data, and application services [57]. The original objective of BDA was to leverage commod-ity hardware to build computing clusters and scale-out the computing capaccommod-ity for web crawling and indexing system workloads. Due to the massive volume of dataset, searching for lower cost and fault-tolerance computational capacity is an important factor for implementing BDA. On the other hand, the implementation of CC were underpinned with three service models, four deployment models, and five characteristics [58], which is the so-called 3S-4D-5C definition.
◦ Service orientation or 3 S Service models (SaaS, PaaS, and IaaS)
◦ Customized delivery or 4D Deployment models (private, public, community, and hybrid cloud)
◦ Shared infrastructure or 5C characteristics (on-demand, broad network access, resource pool, rapid elasticity, and measured service)
This means that the nature of cloud characteristics makes it the most accessible infrastructure for many small to medium companies to be able to implement BDA.
The cloud does not only enable us to easily scale-out, but also scale down to fit all sizes of dataset. When BDA is discussed, it is quite often that the only focus is how to scale-out. However, it is not necessarily the case. Although the overall data volume may tend to increase, the daily volume for each individual case could be moderate and fluctuating, or Big Data processing requirements needed for BI can vary from time to time. If we can leverage the elastic nature of cloud, we can save a substantial amount of the cost due to amortization benefits provided by the cloud systems. The elastic nature of cloud can reduce the overall cost of computation for different types of Big Data workloads, such as batch, micro-batch, interactive, real-time, and near real-time.
Taking Yahoo sorting one TB data as an example, it took 3.5 minutes over 910 nodes to complete the task in 2008, but it only took 62 seconds over 1460 nodes in 2009. To "scale-out" computational capacity will make a huge difference regardless of an improvement of each node due to technological advances. This implies that cloud infrastructure provides computational flexibility if Big Data work-load or business requirements need it. For example, Amazon Web Service (AWS) offers spots instances at a fraction of the regular rate. If the workload only requires batch mode, we can leverage AWS’s spots instances to increase computational capacity and complete the job in a much shorter time.
A popular and open platform that is widely deployed on a cloud infrastructure is Hadoop, whose implementation is inspired by Google MapReduce and GFS.
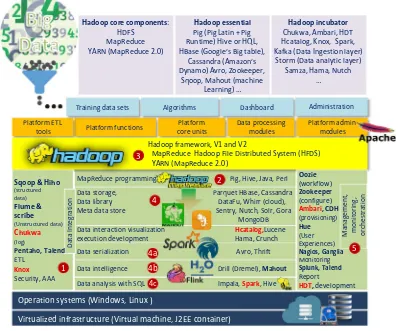
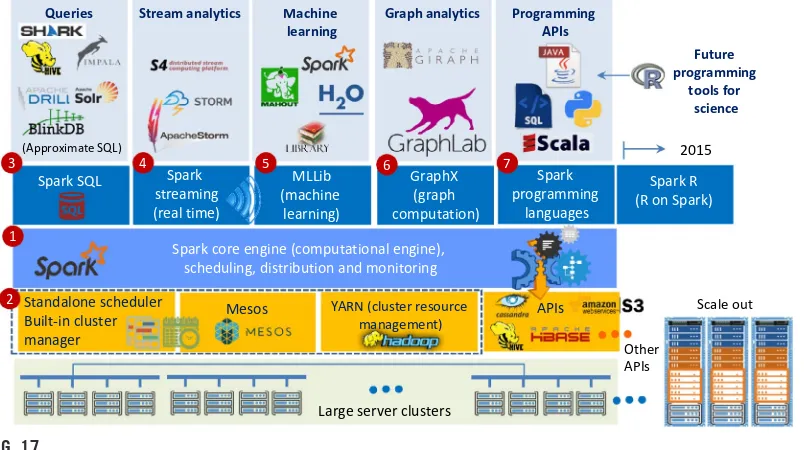
1.7 HADOOP, HDFS, MAPREDUCE, SPARK, AND FLINK
Fig. 9 highlights one of the most popular platforms of BDA, Hadoop. It was the first choice for many analysts and decision makers for implementing BDA. Michael Cafarella, one of the two Hadoop’s founders once remarked, “Nutch (the predecessor of Hadoop) is The National Public Radio (NPR) of search engines” [59]. There are several reasons behind this development:
1. It is an open source platform and also programmed in Java
2. It is linearly scalable and reliable and accepts hardware failure
4. It is a practical platform to store and process data amounts greater than tens of TB
5. It leverages a commodity-type of hardware
6. It is “schema-on-read” or has “data agility” character
7. It is best fit for diversified data sources
The basic idea to create Hadoop is driven by both ever-growing data and cost of computational hardware. The objective of Hadoop is to leverage the commodity hardware for large-scale workload processing, which used to be accomplished only by expensive mainframe computers. From an infra-structure perspective, Hadoop enables the computational capacity to be scale-out rather than scale-up. Notice that it is quite often we use both terms interchangeably [60] but based on a standard definition, “scale-up” has a quality improvement sense while “scale-out” implies adding or repeating the same unit horizontally.
Virtualized infrastructure (Virtual machine, J2EE container)
Data intelligence Drill (Dremel), Mahout
Data serialization Avro, Thrift
MapReduce programming Pig, Hive, Java, Perl
Hadoop framework, V1 and V2
MapReduce Hadoop File Distributed System (HFDS) YARN (MapReduce 2.0 )
Training data sets Algorithms Dashboard Administration
Data analysis with SQL Impala, Spark, Hive
1
The advantage to adopt Hadoop [60] platform is that “Hadoop is a free and open source distributed storage and computational platform. It was created to allow storing and processing large amounts of data using clusters of commodity hardware.” This statement also describes the basic principle of Hadoop architecture that consists of three essential components (see Fig. 10): HDFS for file storage function, Map for distribute function, and Reduce for parallel processing function.
However, Hadoop’s main disadvantage is that it processes all workloads in batch mode because “Hadoop is a generic processing framework designed to execute queries and other batch read opera-tions on massive datasets that can scale from tens of terabytes to petabytes in size” [61]. This means that the early version of Hadoop cannot handle streaming and interactive workloads. Table 4 summa-rizes main characteristics of Hadoop.
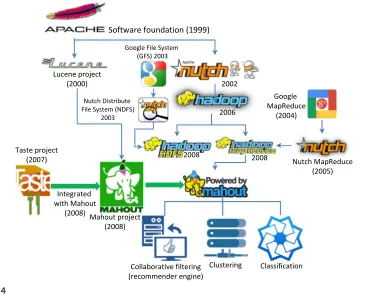
The origin of Hadoop can be traced back to Nutch project under Apache Software Foundation (ASF) in 2002 (see Fig. 11). The initial platform was built as an open source implementation of MapReduce [62] processing model and distributed file system [62] proposed by Google. In 2010, Google granted a license to Apache for incorporating the MapReduce model into Hadoop software freely and distributed it without any patent or IP rights infringement concerns.
1.7.1 GOOGLE FILE SYSTEM (GFS) AND HDFS
The Hadoop project adopted GFS architecture and developed HDFS. The original authors (Google’s engineers) laid out four pillars for GFS:
• System principles • System architecture • System assumptions • System interfaces
The GFS principles departed from the traditional system design dogma that a failure was not al-lowed and a computation system should be designed to be as reliable as possible. In contrast, GFS anticipates the certain number of system failures with specified redundancy or replicating factor
Hadoop Distributed File System (HDFS) =
Self-healing Distributed and Shared Storage System
• Map = Distribute, aggregate and collaboration • Reduce = Parallel processing
• MapReduce = A batch query processor Share storage
Distribution
Hadoop kernel
Parallel processing
and automatic recovery. In comparison to the traditional file standard, GFS is capable of handling billions of objects, so I/O should be revisited. Moreover, most of files will be altered by appending rather than overwriting. Finally, the GFS flexibility is increased by balancing the benefits between GFS applications and file system API. The GFS architecture consists of three components (see Fig. 12):
• Single master server (or name node)
• Multiple chunk servers (or data nodes for Hadoop) • Multiple clients
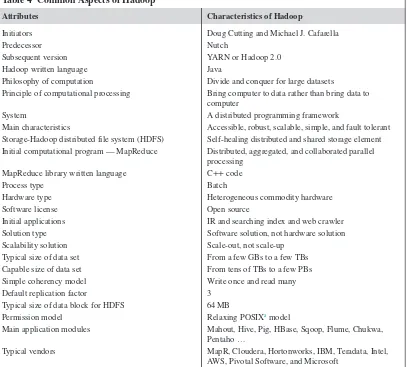
Table 4 Common Aspects of Hadoop
Attributes Characteristics of Hadoop
Initiators Doug Cutting and Michael J. Cafarella
Predecessor Nutch
Subsequent version YARN or Hadoop 2.0
Hadoop written language Java
Philosophy of computation Divide and conquer for large datasets
Principle of computational processing Bring computer to data rather than bring data to computer
System A distributed programming framework
Main characteristics Accessible, robust, scalable, simple, and fault tolerant Storage-Hadoop distributed file system (HDFS) Self-healing distributed and shared storage element Initial computational program — MapReduce Distributed, aggregated, and collaborated parallel
processing MapReduce library written language C++ code
Process type Batch
Hardware type Heterogeneous commodity hardware
Software license Open source
Initial applications IR and searching index and web crawler
Solution type Software solution, not hardware solution
Scalability solution Scale-out, not scale-up
Typical size of data set From a few GBs to a few TBs Capable size of data set From tens of TBs to a few PBs
Simple coherency model Write once and read many
Default replication factor 3
Typical size of data block for HDFS 64 MB
Permission model Relaxing POSIXa model
Main application modules Mahout, Hive, Pig, HBase, Sqoop, Flume, Chukwa, Pentaho …
Typical vendors MapR, Cloudera, Hortonworks, IBM, Teradata, Intel, AWS, Pivotal Software, and Microsoft
The master server maintains six types of the GFS metadata, which are: (1) namespace; (2) access control information; (3) mapping from files to chunks (data); (4) current locations of chunks or data; (5) system activities (eg, chunk lease management, garbage collection of orphaned chunks, and chunk mi-gration between chunk servers); (6) master communication of each chunk server in heartbeat messages.
GFS was designed with five basic assumptions, [63] according to its particular application requirements:
1. GFS will anticipate any commodity hardware outages caused by both software and hardware faults. This means that an individual node may be unreliable. This assumption is similar to one of its system design principles
2. GFS accepts a modest number of large files. The quantity of “modest” is few million files. A typical file size is 100 MB/per file. The system also accepts smaller files, but it will not optimize them
3. The typical workload size for stream reading would be from hundreds of KBs to 1 MB, with small random reads for a few KBs in batch mode
4. GFS has its well defined sematic for multiple clients with minimal synchronization overhead
5. A constant high-file storage network bandwidth is more important than low latency
In contrast to other file systems, such as Andrew File System, Serverless File System, or Swift, GFS does not adopt a standard API POSIX permission model rather than relax its rules to support the usual operations to create, delete, open, close, and write.
According to these workload processing assumptions, GFS is actually a file storage system or frame-work that has two basic data structure: logs (metadata) and sorted string table (SSTable). The main object of having GFS is to implement Google’s data-intensive applications; initially, it was designed to handle the issues of web crawler and a file indexing system under the pressure of accelerating data growing.
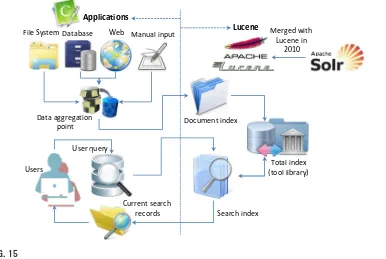
The aim for Google publishing these influential papers [63] was to show how to scale-out the file storage system for large distributed data-intensive applications. Doug Cutting and Mike Cafarella leveraged the Google’s GFS idea to develop their file system, Nutch or Nutch Distribute File System (NDFS) for web crawling application, namely Apache Lucene. NDFS was the predecessor of HDFS (see Figs. 13 and 15). Although HDFS is based on a GFS concept and has many similar properties and assumptions as GFS, it is different from GFS in many ways, especially in term of scalability, data mutability, communication protocol, replication strategy, and security.
FIG. 13
![FIG. 7Machine learning process [46].](https://thumb-ap.123doks.com/thumbv2/123dok/3860577.1842077/27.540.76.446.76.364/fig-machine-learning-process.webp)