CHAPTER III
RESEARCH METHOD
This chapter aims to provide methodology of the research. It is divided into the following section: research design, variable of study, Participants (Population and Sample), Research instrument (research instrument, research instrument try out, research instrument reliability, research instrument validity), and data collection.
A. Design Of The Study
In this research, quasi-experimental design was used. This study is conducted in a classroom setting, so it may not be possible for the writer to assign subjects randomly to groups. In this case, one must use designs that would provide as much
control as possible under the existing situation.41
This research has aim at finding out whether or not English is improving students’ vocabulary with English song media. The writer needs to deliver an
experimental research, which have plan for about 4 meetings. During 4 meetings the writer gave instruction to two groups of sample, Experimental Group was taught by using song as media and control group was taught by using the English book which used to be applied by the teacher.
41
Camphell and Stanley, Experimental and Quasi-Experimental Designs, America:Houghton Mifflin Company Boston, 1963, p.34.
B. Place and Time Of the Study
The place of the study was MTs Darul Amin Palangka Raya at Yakut I Palangka Raya. The writer was six weeks to research at seventh graders of MTs Darul
Amin Palangka Raya. This research was done from 14 April until 20 May 2015.
C. Participants (Population and Sample)
1. Population
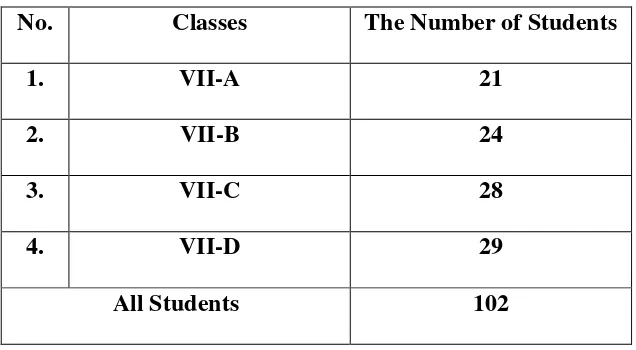
Population is all cases, situation, or individuals who share one or more characteristics.42 The population of this study is all of the seventh grade students MTs Darul Amin Palangka Raya. The number of population is about 102 students. It is classification into two classed as show table 3.2.
Table 3.1
The Population distribution of the Seventh Grade of MTs Darul Amin
Palangka Raya
No. Classes The Number of Students
1. VII-A 21
2. VII-B 24
3. VII-C 28
4. VII-D 29
All Students 102
42
2. Sample
Sample is a smallest group of population.43 To determine the sample form
population, the writer use cluster sampling, that cluster sampling took base on establish class. Cluster sampling is used if the population is not consists of individuals, but groups or cluster.44 Therefore, the use of cluster sampling is because the sample of study should be in group or class, where the class has determined by the school.
Table 3.2
The Sample of the Seventh Grade of MTs Darul Amin Palangka Raya
No. Classes The Number of Students
1. VII C 28
2. VII D 29
TOTAL 57
D. Data Collecting Procedures
In this study the writer uses some procedures to collect the data. The procedures consists of some steps as follows :
1. The writer observed the school to know the number of class of students
and the class activity.
2. The writer determined the class experimental group.
43SuharsimiArikunto, Pendekatandan Praktik, Jakarta: PT Asdi Mahasatya, 2002, p. 109. 44
3. The writer gave try out to another class before testing for pre-test and post-test.
4. The writer gave score to the students’ sheet of try out to test the validity and reliability.
5. The writer gave pre-test to the experimental and control groups. Lynch
sates: pre-test plays a crucial role: it is use to attempt a statistical adjustment of potential preexisting differences between the program and control group.45
6. The writer taught the experimental group using song.
7. The writer taught the control group using English book media as teacher
use to do.
8. The writer gave post test to the experimental group and control group.
9. Measured the normality and homogeneity.
10. The writer analyzed the obtained data from mean of post test score the
experiment group.
11. The writer interpreted the statistical result.
12. The writer concluded the activity of the study whether the use of song to
teach vocabulary gives effect or not to the students’ vocabulary score.
13. The writer discussed about the conclusion.
45
E. Research Instrument
Instrument of the study is very needed in the research. It is because the instrument is tool to get the data of study, in which the data is the important things to help the writer in answering the problem of study and also to prove the hypotheses. The data also needed to find the aim of study. It is to measure the effectiveness of
using song in teaching English toward the students’ vocabulary score of the seventh
Grade students at MTs Darul Amin Palangka Raya.
1. Test
According to Heaton "Test may be constructed primarily as devices to reinforce learning and to motivate student, or primarily as a means of as seeing the student's performance the language.46 Test is a question which is used to measure competence, knowledge, intelligence, and ability of talent which is possessed by individual or group to collect data. In this research, there were two kinds of test, pre test and post test that were given to the students as participants. Before carrying out the teaching, the pre test will be given to experiment groups in order to make sure that the groups have similar and equal level of proficiencies. The post test will be given to the experimental group after being taught by song.
The instrument of the test in this research is objective test. Test that given was multiple choice form which covered 50 items. Where the instrument for try out 50 items, pretest 30 items and posttest 30 items.
46
2. Try Out
The purpose of try out is to test or measure validity or reliability of research instrument. The writer would try out the instrument before it applied to give pre test to the real sample. The writer obtained the instrument quality consisted of instrument validity and instrument reliability. The test would be tried to the seventh Grade of MTs Darul Amin Palangka Raya in the VII- A class. In this case, the student assigned to answer some questions will be given. Then, the writer gave score and analyzed the obtained data to check the instrument reliability.
3. Reliability
Reliability is a necessary characteristic of any good test: For it to be valid at all, a test must first be reliable as a measuring instrument.47 In Rather reliability, there are inter-rater reliability and intra-rater reliability. Inter-rater reliability is the consistency of the judgment of several raters on how they see
a phenomenon or interpreted the responses of the subject.48 It indicates
accuracy in scoring composition of two different raters. Meanwhile, intra-rater reliability referred to the consistency of the rater in scoring the same paper at two different points of time. It points out an individual accuracy in scoring a
47Ibid , p. 155 48
particular composition.49 In this study the writer uses intra-rater reliability.
The reliability of the whole test can be estimated by using this formula:50
Note : k = number of items
M = The mean score on the test for all the testers
Vt = the standard deviation of all the testers’ score The steps in determining the reliability of the test are:
a. Making tabulating of testes’ scores.
b. Measuring the mean of the testes’ scores with the formula : M= N
Y
c. Measuring the total variants with the formula:51
Vt=
= the square of score total
N = the number of testes
d. Calculating the instrument reliability using KR-21.
e. The last decision is comparing the value of 11 and t
49Ibid, p. 37 50
Suharsimi Arikunto, Prosedur Penelitian, p. 108 51
Sugiyono. Metode Penelitian Administrasi. Bandung. Alfabeta. 2007. P. 137
f. Knowing the level of reliability of instrument, the value of 11 was
interpret based on the qualification of reliability as follows:52 0.800- 1.000: Very High Reliability
0.600-0.799 : High Reliability 0.400-0.599 : Fair Reliability 0.200-0.399 : Poor Reliability 0.000-0.199 : Very Poor Reliability
From the measurement of instrument try out reliability it is known that the whole numbers of test items are reliable and can be used as the instrument of the study. And this case, the sore of try out was 0.746, fair reliability.
4. Validity
To measure the validity of the instrument, the writer uses the formulation
of Product Moment by Pearson as follows :53
𝑟𝑥𝑦 =
rxy : Total coefficient of correlation
∑X : Total Value of Score X
∑Y : Total Value of Score Y
∑XY : Multiplication Result between Score X and Y
N : Number of students
The validity of a test is the extent to which it measures what is supposed
to measure and nothing else.54 An instrument is considered to be a good one if
it meets some requirement. One of them is validity.
Every test, whether it is a short, informal classroom test or a public examination, should be a valid a constructor can make it. The test must aim to provide a true measure of a particular skill which it is intended to measure, to the extent that is measures external knowledge and other skills at the same time, and it will not be a valid test. Validity on this study was distinguished into some kinds as follows:
a. Face Validity
This type of validity, in fact is often referred to as face validity : If a test item looks right to other testers, teachers, moderators, and tastes.55 The test will be used by the writer is suitable to others and at the same level that is Senior High School level. The face validity of the test items as follow :
1) The kind of test is vocabulary. The test is about noun and adjective.
2) The form of test items is multiple choice.
54
J.B. Heaton, Writing English Language Test, England : Longman, p. 153. 55
3) The Language of Items uses English.
4) The test items are suitable to the Junior High School.
b. Content Validity
A test is said to have content validity if its content constitutes a
representative sample.56 The content validity has something to do with
questions as to how adequately the test content samples larger domain of situations at presents. In the other words a test supposed to be valid in terms of its content when it is developing as to contain adequately representative sample of the course, the objective, and the items. The writer used multiple choice test consist of 30 items.
c. Construct Validity
Construct validity is type of validity which assumes the existence of certain learning theories or constructs underlying the acquisition of abilities and skills.57
If a test has construct validity, it was capable of measuring certain specific characteristic in accordance with a theory of language behavior and learning. Construct validity refer to the extent to which operationalization of a construct (e.g. practical tests developed from a theory) do actually measured what the theory said they do.
56Ibid
, p. 153. 57
F. Data Analysis
To answer the problem of study about whether the song gave effect or not toward students’ vocabulary scores of the seventh grade students at MTs Darul Amin
Palangka Raya, the writer followed some procedures to analyze the obtained data as follows :
1. Gave tests to the students of the Seventh Grade at MTs Darul Amin Palangka
Raya.
2. Collected the data of the students work sheet test result.
3. Gave score the students’ test result by using the formula :
Score = X100%
Where:
B : Frequency of the correct answers N : Number of test items
4. Calculated the data by using t-test to test the hypotheses of the study, whether
the using song gave effect to the students’ vocabulary scores or not. To
examine the hypotheses, the writer used t-test formula as follows:58
to=
M1-M2 : The difference of two means
SEm1-m2 : The standard error of the differences between two means To know the hypothesis is accepted or rejected using the criterion: If t-test (the value) ≥ ttable, it means Ha is accepted and Ho is rejected.
If t-test (the value) <ttable, it means Ha is rejected and Ho is accepted.
4. Measured the normality and homogeneity.
a. Normality Test
It is use to know the normality of the data that is going to be analyzed whether both groups have normal distribution or not.
Chi square is used here.59
2 = ( fo− fh )2 fh
Notice:
𝟐 = Chi square
fo = frequency from observation
fh= expected frequency
Calculation result of 𝟐is compared with x table by 5% degree of
significance. If 𝟐 is lower than x table so the distribution list is normal. In addition, the SPSS 17.00 program is applied to see the normality.
b. Homogeneity Test
It is used to know whether experimental group and control group, that are
59
decided, come from population that has relatively same variant or not. The formula is:60
F = Bigger Variant
Smaller Variant
Notice:
F : Frequence
The hypotheses in homogeneity:
Fvalue≤ Ftable, means both of variants arehomogeneity.
Fvalue>Ftable, both of variants are homogeneity.
If calculation result of F is lower than F table by 5% degree of significance so Ho is accepted, it means both groups have same variant. In
addition, the SPSS 17.00 program was applied to see the homogeneity.
5. Interpreted the result of t-test. Previously, the writer accounted the degrees of
freedom (df) with the formula :61
df = (N1+N2-2)
Note :
df : degrees of freedom
N1 : Number of subject group 1
N2 : Number of subject group 2
2 : Number of variable
60
Donald Ary, Lucy Cheser Jacobs, Chir Sorense, Asghar Razavieh, Introduction to Research in Education, 8thedition, Wardsworth: USA, 2010,, p.280
61
After that, the value of T-test was consulted on the t-table at the level of significance 1% and 5%. In this Study, the writer used the level of significance at 5%.
If the result or T-test is higher than T-table, it means Ha is accepted. But if the result
of T-test is lower than T-table, it means Ho is accepted.
6. The writer made the conclusion of data analysis obtain.
7. In addition, the writer used SPSS 17.0 program to compare the data.