Analytical Method Evaluation and Discovery of Variation within
Maize Varieties in the Context of Food Safety: Transcript Pro
fi
ling
and Metabolomics
Weiqing Zeng,
*
,†Jan Hazebroek,
§Mary Beatty,
§Kevin Hayes,
#Christine Ponte,
†Carl Maxwell,
†and Cathy Xiaoyan Zhong
*
,††
DuPont Pioneer, Regulatory Sciences, Wilmington, Delaware 19880, United States §
DuPont Pioneer, Analytical and Genomics Technologies, Johnson, Iowa 50131, United States #
DuPont Pioneer, Trait Characterization, Johnson, Iowa 50131, United States
*
S Supporting InformationABSTRACT: Profiling techniques such as microarrays, proteomics, and metabolomics are used widely to assess the overall effects of genetic background, environmental stimuli, growth stage, or transgene expression in plants. To assess the potential regulatory use of these techniques in agricultural biotechnology, we carried out microarray and metabolomic studies of 3 different tissues from 11 conventional maize varieties. We measured technical variations for both microarrays and metabolomics, compared results from individual plants and corresponding pooled samples, and documented variations detected among different varieties with individual plants or pooled samples. Both microarray and metabolomic technologies are reproducible and can be used to detect plant-to-plant and variety-to-variety differences. A pooling strategy lowered sample variations for both microarray and metabolomics while capturing variety-to-variety variation. However, unknown genomic sequences differing between maize varieties might hinder the application of microarrays. High-throughput metabolomics could be useful as a tool for the characterization of transgenic crops. However, researchers will have to take into consideration the impact on the detection and quantitation of a wide range of metabolites on experimental design as well as validation and interpretation of results.
KEYWORDS: metabolomics, Zea mays, maize, microarray
■
INTRODUCTIONGlobal demand for food is increasing rapidly, a trend that is expected to continue for many years. This trend coincides with the growth of the world’s population, the limited availability of arable land and irrigation water, and global environmental changes.1−3 In addition to traditional plant breeding,
biotechnology has become a main focus in the effort to meet the global food demand. The main crops targeted for genetic engineering include maize, soy, cotton, oilseed, canola/ rapeseed, rice, potato, staple cereal plants, and vegetables.2
The introduction of genetically modified (GM) crops has presented technical, regulatory, and social challenges.4,5 De-tailed studies are required to demonstrate that food and feed produced from agricultural products developed through biotechnology are as safe as conventional counterparts, not posing risks to the environment or human health.6−8 In the
early 2000s, the concept of substantial equivalence emerged for testing the equivalence of GM and corresponding conventional crops.5,9 The introduction of a single gene of interest should preferably affect only the desired trait. The biochemical composition of the crop should otherwise be comparable to that of a parental strain or a variety similar to the parental line.10Therefore, compositional analysis covering key nutrients and antinutrients is recommended by the Organization for Economic Cooperation and Development (OECD). This targeted approach, focusing on the majority of the composi-tional components,11−14has been widely accepted by
interna-tional regulatory agencies as part of the concept of substantial equivalence and applied to the assessment of the safety of GM crops.9,14,15
The development of“-omics”profiling offers powerful high-throughput tools for biomedical and agricultural studies. Because nontargeted profiling technologies can screen many components simultaneously, they have the potential to provide insight into complicated metabolic pathways and their interconnections. Such technologies therefore could represent valuable analytical approaches for the assessment of substantial equivalence for GM plants.10,15−17The challenges in the use of
these methods are due to the complexity of the data sets and the use of different technological platforms and software that might generate artifacts, biases, and nonuniform data representations.18
Although nontargeted surveys of the overall transcriptome, proteome, or metabolome of a plant at one snapshot in time and tissue are gaining attention,19,20these technologies are not yet validated within the regulatory framework and therefore not at present officially recommended for safety evaluations of GM plants. A major challenge is to determine whether any detected differences are due to genetic manipulation through
bio-Received: August 5, 2013 Revised: February 23, 2014 Accepted: February 24, 2014 Published: February 24, 2014
technology or are due to natural variation resulting from genetic and environmental effects, interaction of genotypes with environments, or even stochastic differences between plants. For this purpose it is necessary to evaluate the reproducibility of these analytical methods and natural variation of the results of applying these methods to crop species, such as maize. Without this understanding it would be impossible to interpret the -omics data and declare equivalence. Therefore, the International Life Sciences Institute (ILSI) recommended establishing baseline ranges for natural variations and validating these -omics technologies before they can be used for regulatory assessment of biotech crops.15This paper is directed toward fulfilling this function for transcriptomic and metab-olomic methods.
Microarray analysis of transcriptomes is available for both model and crop plants, including Arabidopsis, maize, rice, potato, tomato, soy, pepper, barley,Brassica, and sugar cane.21 Microarrays provide high-throughput, simultaneous detection of differences in mRNA abundance between samples for thousands of genes. Use of microarray technology for safety assessment of GM crops faces some challenges. First, nucleic acid probe hybridization is not able to detect genes expressed at very low level or genes with alternate splicing forms. Second, it is difficult to achieve high reproducibility for microarray experiments due to variations resulting from sample handling, experiment processes, environmental impact on plants, and crop variety differences.22−24
Technologies for simultaneous analysis of metabolites have been developed25,26 and offer the possibility of surveying significantly more metabolites than conventional chemical analyses in a much shorter time and with much lower cost per analyte. However, comparing data from different laboratories remains challenging. This challenge is usually due to relative rather than absolute quantification and different methodologies adopted by different groups, including equip-ment platforms and statistical analysis methods. High sample-to-sample and experiment-to-experiment variability, even within the same laboratory, and the wide concentration range of the same metabolite between plants add to the complexity of the analysis.10 We applied microarray and metabolomic technologies to a randomized field study as conventionally used in regulatory studies. To evaluate the reproducibility and technical variations of the microarray and metabolomic technologies, the samples were tested individually or as pools of plants and RNA and metabolites were extracted and analyzed by microarray and GC-MS. Overall, we evaluated the reproducibility of the microarray and metabolomic technologies to explore the capability of these methodologies in our experimental settings to detect the natural variation of gene expression and metabolite levels between plants and maize varieties.
■
MATERIALS AND METHODSPlant Tissue.Seven inbred and four non-GM commercial hybrid maize varieties were planted in a randomized plot at DuPont Stine Haskell Research Center, Newark, DE, USA. Twenty-five seeds were sowed per row for each variety. Leaves at the V5 growth stage and immature kernels at 25 days after pollination (DAP) were collected in the morning between 8:30 a.m. and 12 p.m. for microarray and GC-MS-based metabolomics.
Three leaf punches avoiding midribs were collected at the middle of the V5 leaf area and placed on dry ice immediately after harvest, transported to the laboratory on dry ice, and stored at−80°C before
processing for metabolomic analysis. The remaining leaf was collected
and frozen in liquid nitrogen immediately after harvest, transported to the laboratory on dry ice, and stored at−80°C before processing for
microarray analysis.
For 25 DAP kernels, 10 kernels in the middle row of the ear were collected for metabolomics, and the remaining kernels were used for microarray analysis. The ears at 25 DAP were removed from the plants and placed on wet ice immediately after harvest and transported to the laboratory on wet ice. Immature kernels were removed from the cobs, frozen in the liquid nitrogen, and stored at−80°C before processing
for microarray and metabolomics analyses.
Mature kernels at R6 growth stage (about 60 DAP) were also collected for metabolomics analysis. The ears at R6 stage were removed from the plants and placed on wet ice immediately after harvest and transported to the laboratory on wet ice. Ten mature kernels in the middle row of the ear were removed from the cob, frozen in the liquid nitrogen, and stored at−80°C before processing
for metabolomics analyses.
For microarray analysis, tissues were ground intofine powders. For metabolomics analysis, tissues were lyophilized before they were ground tofine powders. Additional pooled samples were obtained by combining equivalent amounts of ground material from three individual plants.
Microarray. Total RNA was isolated from ground frozen tissue using the EZNA SQ RNA Isolation Kit (Omega Bio-Tek, Norcross, GA, USA), treated with DNase-I, and used for mRNA isolation with an Illustra mRNA Purification Kit (GE Biosciences, Pittsburgh, PA, USA). The total RNA and mRNA samples were visualized and quantified on a Bioanalyzer 2100 (Agilent Technologies, Santa Clara, CA, USA). Each mRNA sample was converted into double-stranded DNA by an in vitro transcription reaction and labeled with Cy3 fluorescent dye using the Low RNA Input Fluorescent Linear Amplification Kit (Agilent Technologies). The cRNA product was purified with an Agencourt RNAClean Kit (Beckman Coulter, Indianapolis, IN, USA). Hybridizations were performed overnight with equal amounts of labeled cRNA to a custom 4x44K Maize Oligo Microarray from Agilent Technologies according to Agilent’s One-Color Microarray-Based Gene Expression Analysis protocol. After hybridization, the microarray slides were washed and immediately scanned with the a G2505C DNA microarray scanner (Agilent Technologies). The images were visually inspected for artifacts, and feature intensities were extracted,filtered, and normalized with Feature Extraction software (v 10.5.1.1) (Agilent Technologies). Quality control and downstream analysis were performed using data analysis tools in Genedata Expressionist and the statistical language R. Further data analysis and bioinformatic analyses were carried out according to methods described in Hayes et al.27
Metabolomics.Metabolites were extracted from approximately 3 mg (dry weight) of lyophilized tissues for each sample. In a 1.1 mL polypropylene microtube containing two 5/32 in. stainless steel ball bearings, each sample was added with 500 μL of chloroform/ methanol/water (2:5:2, v/v/v) solution containing a 0.015 mg ribitol internal standard. Samples were homogenized in a 2000 Geno/ Grinder ball mill at setting 1650 for 1 min and then rotated at 4°C for 30 min before being centrifuged at 1454gfor 15 min at 4°C. Aliquots (300μL) were transferred to 1.8 mL high recovery glass autosampler vials, evaporated to dryness in a speed vac, and redissolved in 50μL of 20 mg mL−1methoxyamine hydrochloride in pyridine. The vials were capped, agitated with a vortex mixer, and incubated in an orbital shaker at 30°C for 90 min to form methoxyamine derivatives. Next, 80μL of
N-methyl-N-(trimethylsilyl)trifluoroacetamide (MSTFA) was added
to each sample to form trimethylsilyl (TMS) derivatives by a Gerstel autosampler 30 min prior to injection to minimize sample variations due to derivatization differences. This “just in time” derivatization eliminates variation due to differences in reaction time or temperature. Furthermore, the gas chromatograph inlet liner and septum were replaced daily, mitigating the known influence of sample residue in the inlet on trimethylsilylation completeness.28 However, trimethylsilyla-tion can vary with the sample matrix.28Thus, for molecules such as amino acids that present multiple reaction sites leading to the possibility of two or more chemical derivatives, the relative abundance
of these trimethylsilylated forms can vary among the three different tissue types assayed in this study.
The derivatized samples were separated by gas chromatography on a Restek 30 m×0.25 mm ×0.25 μm film thickness Rtx-5Sil MS column with a 10 m Integra-Guard column. One microliter injections were made with a 1:30 split ratio using a Gerstel autosampler. An Agilent 6890N gas chromatograph was programmed for an initial temperature of 80°C for 0.5 min and increased to 350°C at a rate of 18°C min−1, at which it was held for 2 min before being cooled rapidly to 80°C and held there for 5 min in preparation for the next run. The injector and transfer line temperatures were 230 and 250°C, respectively, and the source temperature was 200°C. Helium was used as the carrier gas with a constantflow rate of 1 mL min−1maintained by electronic pressure control. Data acquisition was performed on a LECO Pegasus III time-of-flight mass spectrometer with an acquisition rate of 10 spectra s−1in the mass range ofm/z45
−600. An electron
beam of 70 eV was used to generate spectra. Detector voltage was 1750 V. An instrument autotune for mass calibration using perfluorotributylamine (PFTBA) was performed prior to each sample sequence.
Metabolomics Data Processing and Analysis.Raw Leco GC-MS .peg datafiles were converted into .netcdf (Andi) formats using Leco ChromaTof ver. 4.13 software. Data preprocessing was performed with Genedata Refiner MS ver. 5.2.1 software. For each .netcdffile, retention times were converted into retention indices using an in-house program. Preprocessing consisted of gridding chromato-grams in them/zvalue (80−437) and retention index dimensions,
subtracting chemical noise, aligning the retention indices of each
selected ion chromatogram, and detecting nominal mass peaks, using empirically optimized settings for each process. Data from each of the three tissue types were processed separately to maximize alignment and peak peaking. The resulting three matrices consisted of intensities for each m/zvalue−retention index combination and each sample.
The aligned and denoised data matrices were passed to Genedata Analyst ver. 2.1 software, where each intensity value by sample was normalized for both the ribitol internal standard signal and sample dry weight.
Becausem/zvalue−retention indexfingerprint data are redundant,
significant signatures were reduced to named known metabolites on the basis of matching both the retention index and mass spectrum to those of authentic standards. Relative quantitation of each metabolite in each sample was derived from the intensity of each metabolite’s representativem/zvalue obtained from the Genedata Analyst output. In a few cases, peak heights obtained from ChromaTof quantification ion chromatograms were used instead when signals were below the threshold set forfingerprinting and thus not present in the Genedata Analyst output. Metabolite detection from either source was dependent on reaching a conservative limit of detection to mitigate false-positive peaks that would have an undue effect on subsequent statistical analyses. Percent CV values were calculated for each metabolite across selected samples. Data matrices were reformatted and imported into the PLS_Toolbox version 7.0.1 (Eigenvector Research, Inc.), with which principal component analysis (PCA) was performed on autoscaled (mean centered and each variable scaled to unit variance) data.
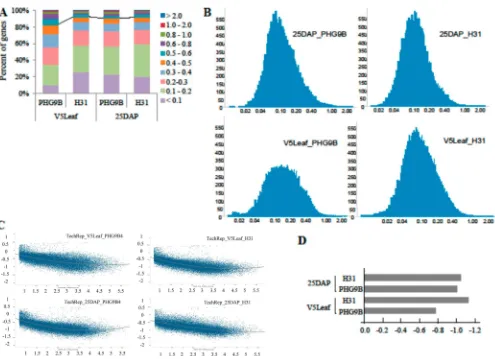
Figure 1. CVs of gene expression calculated from technical repeat microarrays: (A) percentages of genes within different CV ranges; (B) CV distributions generated by TIBCO Spotfire (x-axis, CV values in log scale;y-axis, gene counts); (C) plots of log10 (CV)s (y-axis) and against log10 (mean)s (x-axis) (curves are polynomialfittings generated by TIBCO Spotfire); (D) log10 (CV) values of inflection points calculated from curves in panel C.
Experimental Design. For both microarray and metabolomics experiments, 11 maize varieties were used, including (1) 7 inbred lines, PHG9B (high oil), H31 (low oil), PH2WBS (high protein), PH2WBR (low protein), PH0GP (median starch), PH14T (median starch), and 658 (low starch); and (2) 4 commodity hybrid lines, 38B85, 37Y12, 34A15, and 34P88. These lines were chosen as a partial representation of the range of U.S. cultivated maize diversity and include lines differing in protein, oil, and starch contents. Three types of tissues, V5 leaf, 25 DAP immature kernel, and mature kernel, were used for metabolomic experiments. Because the mature kernels are dormant and have very limited gene expression,29,30only the V5 leaf and the 25
DAP immature kernels were used for microarray experiments. Due to limited tissue availability for some varieties, some microarray or metabolomic experiments were not conducted.
For microarray technical repeat controls, eight independent RNA samples were isolated from either V5 leaves or 25 DAP immature kernels of a single plant from the high-oil variety PHG9B and the low-oil line H31 and used for eight different microarray hybridizations. The signal differences among these hybridizations were considered the technical variation of the microarray methodology. Similarly, eight independent metabolite extractions were made from bulk collections of V5 leaves or 25 DAP immature kernels of PHG9B and H31 and from bulk mature kernels of PH2WBS (high-protein line) and PHG9B. They were used for independent GC-MS analyses and technical variation assessment. Multiple sample preparation and testing steps were used to evaluate the reproducibility of both technical methods. Sample variations were also evaluated by comparing data from different individual plants and different pooled plants.
qRT-PCR.Genes, primers, and probes are listed in Supplementary Table 1 in the Supporting Information. Primers and probes were designed with Primer Express 3.0.1 (Applied Biosystems, Carlsbad, CA, USA) and purchased from Integrated DNA Technologies, Inc. (Coralville, IA, USA). First-strand cDNA was synthesized from the same mRNA samples used for microarray. Fifteen pooled samples from either V5 leaf or 25 DAP kernel were chosen on the basis of sample availability. For each RT reaction, 240 ng of mRNA was used as a template in a total volume of 80μL following the manufacturer’s instruction for the SuperScript VILO cDNA synthesis kit (Invitrogen, Carlsbad, CA, USA). All qRT-PCR primers and Taqman probes were designed using the Primer Express program (Applied Biosystems) and tested for specificity by Blast search against the NCBI public sequence database. The qPCR reactions were carried out in 384-well plates in a ViiA 7 real-time-PCR machine (Applied Biosystems) using the TaqMan Gene Expression Master Mix (Applied Biosystems). The qPCR program was 50°C for 2 min, 95°C for 10 min, followed with 40 cycles of 95°C for 15 s and 60°C for 1 min. Each reaction contains 200 nM of each primer, 100 nM of probe, and 2μL of the RT reaction solution as template in afinal volume of 20μL. Every reaction was repeated three times. The ViiA 7 software V1.2 was used to record and process the data. The Rn (normalized reporter) values of each reaction for every cycle were exported and used to calculate the single-well qPCR efficiencies using a real-time PCR Miner program.31
■
RESULTSMicroarray Reproducibility. To compare the reproduci-bility of expression levels of the same genes on repeated microarrays, the data were analyzed using correlation statistics. The coefficient of variation (CV) for each set of repeats was calculated and compared as an indication of reproducibility.32 Mean CV values of gene transcripts for technical repeats were 0.25, 0.23, 0.33, and 0.23 for 25 DAP PHG9B, 25 DAP H31, V5 leaf PHG9B, and V5 leaf H31 samples, respectively, relatively low compared to the microarray literature,33−35
indicating good technical reproducibility. Expression of most of genes on the microarrays had low CV values, with 82.4, 92.1, 90.4, and 91.6% of genes from V5 leaf PHG9B, V5 leaf H31, 25 DAP PHG9B, and 25 DAP H31 microarrays exhibiting CV values below 0.5 (Figure 1A). In addition, these CV values
showed log-normal distribution centered at 0.1 (Figure 1B), indicating good reproducibility. However, the reproducibility of eight technical repeat microarrays for PHG9B V5 leaves was little higher than other technical repeat microarrays (Figure 1A). Alternatively, the CV values were log transformed and plotted against the log transformed mean values. Polynomial curve fitting showed as expected that CV values decreased as the mean intensities increased (Figure 1C). The inflection points calculated on the basis of the polynomial curves showed that technical repeat microarrays for PHG9B V5 leaves have higher background noise (Figure 1D), similar to that shown by the CV distributions (Figure 1A).
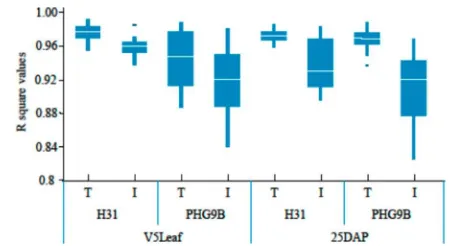
We further investigated the reproducibility of microarray results by a linear regression model correlating data between any pair of microarrays within each group. Four groups were analyzed this way for both V5 leaf and 25 DAP kernel samples, including the eight technical arrays for H31, the six individual biological repeats for H31, the eight technical arrays for PHG9B, and the nine individual biological repeats for PHG9B. The box plots represent the distributions ofRsquare values of all pairwise comparisons of linear regression modeling (Figure 2). The technical replicates had consistently higher correlations
than the biological replicates (Figure 2). We conclude that gene expression variation from microarrays resulted primarily from maize variety differences rather than from plant-to-plant differences, pooled sample-to-sample differences, or technical variations, indicating that the method is sensitive enough to detect biological variation among individual or pooled plant samples.
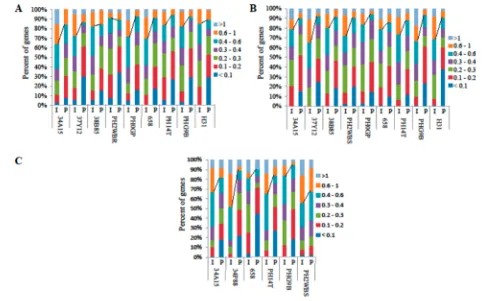
Correlation between Gene Expression of Individual and Pooled Samples.Next, CV values for the microarrays from the six varieties analyzed both as individual samples (I) and as pooled samples (P) were calculated. For each variety, six or nine individual plants and two or three pools of samples (three plants per pool) were analyzed. The pools were created by combining equal amounts of RNA extracts from individual plants. Overall, 73.7% (34A15_I)−93.3% (38B85_P) of the
genes had CV values below 0.5 from V5 leaf samples, and 73.8% (38B85_I) − 96.8% (PHG9B_P) of genes had CV
values below 0.5 from 25 DAP kernel samples (Supporting Information Supplementary Table 2), representing very good experimental reproducibility. The distributions of the CV values from both 25 DAP kernel and V5 leaf samples are shown in Supplementary Figure 1 in the Supporting Information. When Figure 2.Technical reproducibility of microarrays. Pairwise correlation coefficients between pairs of technical replicates (T) or between pairs of biological repeats (I). Box plots were generated with TIBCO Spotfire. The white bar represents the median value. Edges of boxes represent values at 75 and 25% percentiles. Edges of bars represent the ranges of values with outside dots as outliers.
the overall CV distribution patterns of individual or pooled samples were compared, microarrays for 25 DAP kernel samples showed larger CV differences, compared to V5 leaf samples. Additionally, log10 (CV) versus log10 (mean) plots were generated for all of the microarrays to reveal the relationship between CV and mean intensities (data not shown). The inflection point values were very similar to what was shown by the CV distribution patterns (Supporting Information Supplementary Figure 1).
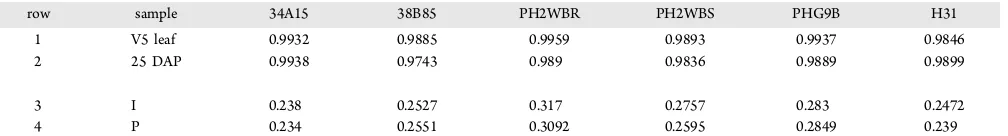
The Pearson’s correlation coefficient was calculated by comparing mean gene expressions between individual samples and pooled samples for each variety and tissue type. The R values were between 0.9743 and 0.9959 (Table 1), indicating that the signals obtained from individual plants and pooled plants were highly correlated and similar. When samples from the same variety but different tissue types were compared, the Pearson correlation R values were between 0.234 and 0.317 (Table 1), indicating significant gene expression differences between leaves and kernels, as expected. For every variety−
tissue combination, the pooled samples showed a smaller mean CV value than the one from corresponding individual samples (Supporting Information Supplementary Table 3). Therefore, the plant-to-plant variation detected from the same variety was reduced by pooling three plants into a single sample, essentially transforming plant-to-plant variation into sample-to-sample variation. In addition, the distribution patterns of CV values from I and P samples were very similar (Supporting Information Supplementary Figure 2), indicating that our pooling strategy was efficient in capturing the variations existing among maize varieties while realizing a cost savings.
Gene Expression Differences between Varieties. To evaluate gene expression variation between maize varieties, mean microarray spot intensities from six or nine individual samples (I) and two or three pooled samples, with three individuals per each pool (P), were determined and used for CV calculations comparing the six varieties that had both I and P samples.
When the CV distributions of individual samples represent-ing variety-to-variety variations (Supportrepresent-ing Information Supplementary Figure 2 and Table 4) were compared to the CV distributions representing plant-to-plant variation within a certain variety (Supporting Information Supplementary Figure 3 and Table 2), we found that the former were larger. For V5 leaves, 65.4% of genes showed a CV value <0.5 when different maize varieties were compared (Supporting Information Supplementary Figure 2 and Table 4), but 73.7% (34A15)−
93.1% (38B85) of genes had a CV <0.5 when individual plants within a given variety were compared (Supporting Information Supplementary Figure 1 and Table 2). For 25 DAP kernels,
68% of genes showed a CV value <0.5 when different maize varieties were compared (Supporting Information Supplemen-tary Figure 2 and Table 4), but 73.8% (38B85)−85.1% (H31)
of genes had a CV <0.5 when individual plants within a given variety were compared (Supporting Information Supplemen-tary Figure 1 and Table 2). These results indicate that higher variations exist among different maize varieties compared to those among individual plants of the same variety, likely due to the genetic differences and/or genetic and environmental interactions affecting gene expression among varieties.
In addition, the variety-to-variety variation detected in 25 DAP kernels is similar to that among V5 leaf tissues on the basis of their CV distributions (Supporting Information Supplementary Figure 2), indicating that gene expression variations among different maize varieties are similar between these two tissue types.
Confirmation of Microarray Results by qRT-PCR. To confirm the gene expression levels measured by the microarray experiments, two groups of 18 different genes were chosen for V5 leaf and 25 DAP kernel, respectively (Supporting Information Supplementary Table 1). The expression levels of these genes are ranked across all microarrays at 80 or 50% percentiles. Expression of these genes was measured by qRT-PCR reactions using the same RNA samples used for microarrays. Due to limited sample availability and possible polymorphisms among different maize varieties at primer annealing locations, we used a real-time PCR Miner program31 that has been validated by many other groups36−43to monitor
the single-well qRT-PCR efficiency. ThedapAgene was used as a control for comparison between microarray and qRT-PCR data. Gene expression levels from qRT-PCR reactions were calculated on the basis of thedapAexpression and compared to levels detected on microarrays that were also quantified on the basis of thedapAexpression. The ratio of expression levels for each gene detected by these two techniques was log transformed for proper comparison (Figure 3).
For V5 leaf tissue samples, two genes (pco602011 and pco603626) were not amplified from any of the 15 templates by qRT-PCR and therefore not included in the analysis. Two genes, pco627753 and pco643043 (genes 2 and 11 in Figure 3A, respectively), had expression detected only in some of the samples, and four genes, pco624384, pco521467, pco652567, and pco658406 (genes 13, 14, 15, and 16 in Figure 3A, respectively), showed higher expression (ca. 2−32-fold higher),
relative to microarray, in all 15 samples. For the remaining genes tested, the expression levels were close to those measured by the microarrays, although there were some variety-specific expression differences between the two techniques (Figure 3A). For 25 DAP kernel samples, one gene (pco621453) did not
Table 1. (Rows 1 and 2) Mean Gene Expression Levels Detected in Individual Plants (I) and Pooled Plants (P) for the Same Tissue Type of a Variety Are Highly Correlated;a
(Rows 3 and 4) Mean Gene Expression Detected Microarrays Are Not Correlated between V5 Leaf and 25 DAPb
row sample 34A15 38B85 PH2WBR PH2WBS PHG9B H31
1 V5 leaf 0.9932 0.9885 0.9959 0.9893 0.9937 0.9846
2 25 DAP 0.9938 0.9743 0.989 0.9836 0.9889 0.9899
3 I 0.238 0.2527 0.317 0.2757 0.283 0.2472
4 P 0.234 0.2551 0.3092 0.2595 0.2849 0.239
aValues are Pearson correlation coefficients (R) comparing mean gene expression intensities between all I and all P samples for each variety −tissue
combination, calculated using Excel function PEARSON.bValues are Pearson correlation coefficients (R) comparing gene expression intensities from V5 leaf and 25 DAP for the same plant samples, calculated using Excel function PEARSON, for individual plants (I) or pooled plants (P).
show any amplification from qRT-PCR and was not included for further analysis. Two genes, pco653893 and pco598383 (genes 14 and 15 in Figure 3B, respectively), were amplified
from 11 and 8 samples of 15 varieties, respectively. Two genes, pco601999 and pco632057 (genes 16 and 17 in Figure 3B, respectively), had very different expression levels from microarray across all varieties (Figure 3B). Gene 16 showed 4−60 times lower expression and gene 17 showed 8−60 times
higher expression when detected by qRT-PCR compared to microarray results. The rest of the genes tested in 25 DAP kernel samples showed good consistency with microarray data (Figure 3B). A few qRT-PCR expression data points were different from the microarray data, but only for one or two maize varieties.
Metabolomic Data Analysis. The three processed data matrices contained 3891 metabolomic signatures orfingerprints (m/zvalue−RI combinations) for V5 leaves, 4300 for 25 DAP
immature kernels, and 3891 for mature kernels. Of these, 87−
103 metabolites were successfully identified in tissues examined. These numbers, reduced relative to the raw data set, take into account the elimination of the inherent redundancy in metabolomics signatures and ignore metabolites for which the identity could not be unambiguously established. The substantial reductions are due to (1) eliminating the inherent redundancy in metabolomics signatures wherein each metabolite can be represented by multiple m/z values in its electron impact mass spectrum and (2) ignoring metabolites for which the identity could not be unambiguously established. To evaluate technical variations including the sampling, analytical, and data analysis variability, eight technical repeats were produced from V5 leaves of PHG9B and H31, 25 DAP kernels from PHG9B and H31, and mature kernels from PH2WBS and PHG9B. For each tissue−variety combination, a
single bulk tissue sample was aliquoted into eight extraction tubes, producing eight metabolomic samples. Mean CV values calculated from technical repeat metabolite relative levels were Figure 3.Gene expression analysis comparing qRT-PCR to microarray
hybridization with V5 leaf (A) or 25 DAP (B) samples. Numbers are log 2 transformed ratios between expression levels detected by qRT-PCR and microarray that were defined against dapA expression levels.
Figure 4.CV distribution of metabolite levels detected from V5 leaf (A), 25 DAP immature kernel (B), and mature kernels (C).
between 0.33 and 0.54, and median values were between 0.27 and 0.46, indicating good reproducibility despite some outliers in the upper ranges (Supporting Information Supplementary Figure 3). The majority of metabolites detected showed CV values <0.6, with 76.7 and 87.4% metabolites from V5 leaves of PHG9B and H31, 76.1 and 80.2% of metabolites from 25 DAP immature kernels of PHG9B and H31, and 77.6 and 60.9% of metabolites from mature seeds of PH2WBS and PHG9B, respectively (Supporting Information Supplementary Figure 3). We also found that pooled samples had lower variances compared to the individual samples (Figure 4; Supporting Information Supplementary Table 5), similar to what was observed from the transcript data. Particularly, metabolomics for mature seed samples showed much less variation than for immature seeds (Supporting Information Supplementary Table 5), probably due to a less complex metabolome and terminal differentiation state of mature kernels.
Mean metabolite levels detected from individual and pooled samples of the same tissue−variety combination are highly
correlated, with Pearson correlation R values all close to 1 (Table 2). For PHG9B and H31, the high correlations are
observed despite the fact that the individual samples were from nine different plants, compared to the technical variation tests for which metabolites were extracted from eight aliquots of the same plant sample. These results also demonstrate consistent derivatization, GC, MS data acquisition, and data processing.
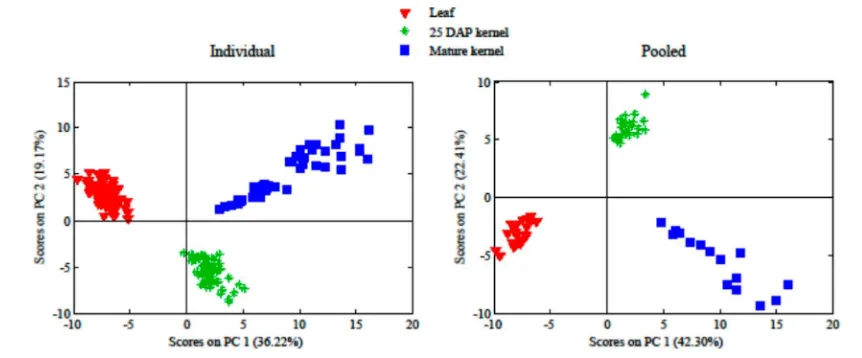
Tissue or Variety Separation Based on Metabolomics.
When the metabolites detected from the three different tissues were compared, PCA clearly indicated tissue separation (Figure 5), reflecting tissue specificity of metabolic processes, as expected. However, PCA revealed variety specificity for only certain variety−tissue combinations. For example, for V5 leaf
tissues, there was clear separation of PH2WBR, PH14T, and H31 from other varieties based on PC1 and PC3 (Figure 6A). Likewise, PH2WBS and PH2WBR in 25 DAP kernels were readily distinguished from other varieties with PC1 and PC4 (Figure 6E). For mature kernels, PH2WBS and PHG9B showed good separation from other varieties based on PC2 and PC3 (Figure 6I).
For the most part, the tissue and variety classifications observed with individual plants were also evident in pooled plant samples, although sometimes with different principal component projections (Figures 5 and 6A,J). This result suggests that pooling did not degrade the discriminating power afforded by individual samples. Interestingly, the combined percent variance included in the PCA scores plots was slightly higher for pooled samples compared to that generated for analogous individual samples, suggesting that pooling removed some uninformative signal.
Loadings associated with examples of the above variety classifications were selected graphically (Figures 6C,D; G,H; and K,L; in purple) and listed in Supplementary Table 6 in the Supporting Information. The very significant increases in the amount of amino acids in developing kernels, including glutamic acid, glutamine, histidine, leucine, lysine, pyroglutamic acid (which could be derived from glutamine during sample preparation), and tryptophan, are expected for PH2WBS, a genotype with elevated grain protein. Explanations for the genotype-specific differences (loadings) in the other tissues are less obvious. For the three examples shown, loadings from pooled plants were very similar to those from individual plants. Thus, pooling generated similar PCA scores and loadings, maintaining the ability to classify sample groups (varieties) as well as to identify the prominent metabolites underlying said classifications.
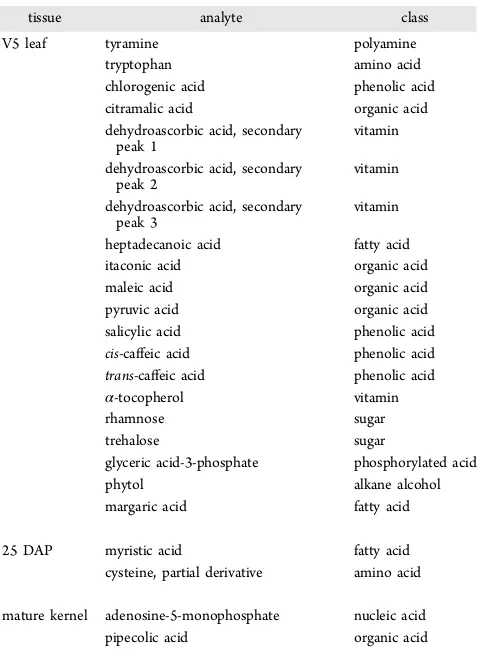
In this GC-MS metabolomic study, we also found that some metabolites were detected in only one or two tissue types. Among individual plant samples, there were 19 metabolites uniquely detected in V5 leaves, 2 only in immature kernels, and 3 only in mature kernels (Table 3). It is expected that the
Table 2. Mean Metabolite Levels Detected from Individual Plant (I) and Pooled Plants (P) Samples for the Same Tissue Type of a Variety Are Highly Correlateda
variety V5 leaf 25 DAP mature
34A15 0.9976 0.9996 0.9732
37Y12 0.9988 0.9987 0.9921
38B85 0.9988 0.9994
PH2WBS 0.9089 0.9952
PH2WBR 0.9985
PH0GP 0.9970 0.9971
658 0.9981 0.9948 0.9984
PH14T 0.9994 0.9981 0.9992
PHG9B 0.9993 0.9933 0.9940
H31 0.9980 0.9891
aPearson correlation coefficients (R) by Excel function PEARSON.
Figure 5.PCA score plots from individual or pooled plants showing tissue specificity of metabolomes.
metabolome of leaves is more divergent than that of immature or mature kernels. Some of these metabolites are present but not detected in other tissues, given our conservative limit of peak detection. Moreover, immature and mature kernels contain more polysaccharides by weight than leaves. Because approximately 3 mg dry weight samples were used for all three tissue types, it is expected that the concentration of many small molecule metabolites will be greater in leaf than in kernel samples. This could result in apparent tissue specificity, as seen in Table 3.
Range and Variations of Metabolite Abundances.We observed large ranges in relative levels for many metabolites across all varieties. The ratio between the maximum value and the minimum value detected for a metabolite in individual samples ranged from 1.8 to 1663 for V5 leaf tissues, from 3.3 to 16815 for immature kernels, and from 2.7 to 585 for mature kernels (Supporting Information Supplementary Table 7). However, when samples were pooled, the ranges narrowed to 1.4−167 for V5 leaves, 2.1−4828 for immature kernels, and 1.6−86 for mature kernels (Supporting Information
Supple-mentary Table 7). Similarly, when the mean values within each variety for each metabolite from either individual samples or pooled samples were compared across all varieties with box plots, the pooled samples showed much narrower distribution compared to the individual samples (data not shown). This observation indicated that the biological variation among individual plants combined with variety variation was very large. However, our pooling strategy effectively decreased the biological variation between plants. The actual relative levels are specific to the current data set and should not be compared to other data sets, unless they were processed (aligned and scaled) together.
Figure 6.PCA scores and loadings plots from individual plants (A, C; E, G; I, K) or pooled plants (B, D; F, H; J, L) showing classifications of PH2WBR from the leaf metabolome (A−D), PH2WBS from the 25 DAP kernel metabolome (E−H), and PH2WBS from the mature kernel
metabolome (I−L). Significant loadings are shown in purple.
Table 3. Apparent Tissue-Specific Metabolites
tissue analyte class
V5 leaf tyramine polyamine
tryptophan amino acid
chlorogenic acid phenolic acid citramalic acid organic acid dehydroascorbic acid, secondary
peak 1 vitamin
dehydroascorbic acid, secondary
peak 2 vitamin
dehydroascorbic acid, secondary
peak 3 vitamin
heptadecanoic acid fatty acid itaconic acid organic acid
maleic acid organic acid
pyruvic acid organic acid
salicylic acid phenolic acid
cis-caffeic acid phenolic acid
trans-caffeic acid phenolic acid
α-tocopherol vitamin
rhamnose sugar
trehalose sugar
glyceric acid-3-phosphate phosphorylated acid
phytol alkane alcohol
margaric acid fatty acid
25 DAP myristic acid fatty acid
cysteine, partial derivative amino acid
mature kernel adenosine-5-monophosphate nucleic acid pipecolic acid organic acid
Multiple derivative forms for certain metabolites are characteristic of GC-MS-based metabolomics, as illustrated by asparagine in Supplementary Table 7 in the Supporting Information. Asparagine with four TMS groups (one attached to the carboxyl and three to the amines) was found in mature kernels, whereas asparagine with just three TMS moieties (one attached to the carboxyl and two to the amines) was specific to V5 leaves. This dichotomy might be explained by differential trimethylsilylation due to the different sample matrices.28 Consequently, comparing metabolomes across tissue types or species should be undertaken with caution.
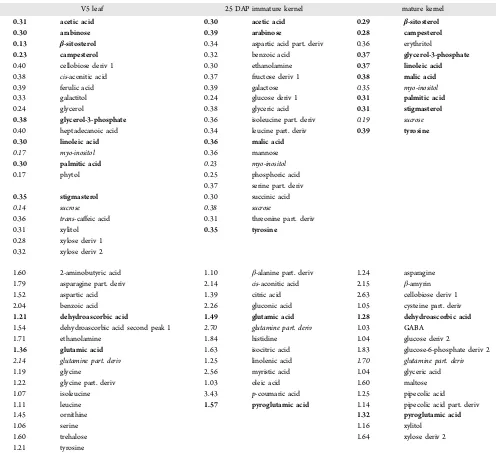
We also compared the levels of metabolites in all samples across all varieties for a given tissue type and identified metabolites that are quite stable as well as those that are highly variable among varieties. There were 21 metabolites from V5
leaves, 20 metabolites from 25 DAP immature kernels, and 11 metabolites from the mature kernels that showed a CV value of <0.4 across all varieties (Table 4), representing tissue-specific stable metabolomes. Among them, sucrose and myo-inositol were identified from all three tissues, and another 10 metabolites appeared in two tissue types. On the other hand, there were 17 metabolites from the V5 leaves, 13 from the 25 DAP immature kernels, and 16 from the mature kernels that showed CV values >1, indicating that these metabolites are highly variable among different maize varieties (Table 4). A partial derivative form of glutamine seemed to be highly variable in all three tissue types, and another three metabolites were highly variable for two tissue types. The high variability of the partial derivative of glutamine may be due, at least in part, to inconsistent transformation to pyroglutamic acid, which was
Table 4. Metabolites with Relatively Stable or Highly Variable Levels among Different Maize Varieties and Their CV Valuesa
V5 leaf 25 DAP immature kernel mature kernel
0.31 acetic acid 0.30 acetic acid 0.29 β-sitosterol
0.30 arabinose 0.39 arabinose 0.28 campesterol
0.13 β-sitosterol 0.34 aspartic acid part. deriv 0.36 erythritol
0.23 campesterol 0.32 benzoic acid 0.37 glycerol-3-phosphate
0.40 cellobiose deriv 1 0.30 ethanolamine 0.37 linoleic acid
0.38 cis-aconitic acid 0.37 fructose deriv 1 0.38 malic acid
0.39 ferulic acid 0.39 galactose 0.35 myo-inositol
0.33 galactitol 0.24 glucose deriv 1 0.31 palmitic acid
0.24 glycerol 0.38 glyceric acid 0.31 stigmasterol
0.38 glycerol-3-phosphate 0.36 isoleucine part. deriv 0.19 sucrose
0.40 heptadecanoic acid 0.34 leucine part. deriv 0.39 tyrosine
0.30 linoleic acid 0.36 malic acid
0.17 myo-inositol 0.36 mannose
0.30 palmitic acid 0.23 myo-inositol
0.17 phytol 0.25 phosphoric acid
0.37 serine part. deriv
0.35 stigmasterol 0.30 succinic acid
0.14 sucrose 0.38 sucrose
0.36 trans-caffeic acid 0.31 threonine part. deriv
0.31 xylitol 0.35 tyrosine
0.28 xylose deriv 1 0.32 xylose deriv 2
1.60 2-aminobutyric acid 1.10 β-alanine part. deriv 1.24 asparagine
1.79 asparagine part. deriv 2.14 cis-aconitic acid 2.15 β-amyrin
1.52 aspartic acid 1.39 citric acid 2.63 cellobiose deriv 1
2.04 benzoic acid 2.26 gluconic acid 1.05 cysteine part. deriv
1.21 dehydroascorbic acid 1.49 glutamic acid 1.28 dehydroascorbic acid
1.54 dehydroascorbic acid second peak 1 2.70 glutamine part. deriv 1.03 GABA
1.71 ethanolamine 1.84 histidine 1.04 glucose deriv 2
1.36 glutamic acid 1.63 isocitric acid 1.83 glucose-6-phosphate deriv 2
2.14 glutamine part. deriv 1.25 linolenic acid 1.70 glutamine part. deriv
1.19 glycine 2.56 myristic acid 1.04 glyceric acid
1.22 glycine part. deriv 1.03 oleic acid 1.60 maltose
1.07 isoleucine 3.43 p-coumaric acid 1.25 pipecolic acid
1.11 leucine 1.57 pyroglutamic acid 1.14 pipecolic acid part. deriv
1.45 ornithine 1.32 pyroglutamic acid
1.06 serine 1.16 xylitol
1.60 trehalose 1.64 xylose deriv 2
1.21 tyrosine
aCV values were calculated from metabolite levels from all individual (I) and pooled (P) samples for all varieties. Only metabolites that were
detected from all I and P samples of all varieties were included for the calculation. Only metabolites with CV values of <0.30 (relatively stable) and >1.00 (highly variable) are shown. Metabolites initalicwere found in all three tissues, and metabolites inboldwere found in two tissues for the same category.
also highly variable in two of the tissues. The inconsistent transformation of pyroglutamic acid is a process known to be associated with trimethylsilylation.
As with gene expression levels detected from microarrays, mean metabolite abundances from individual samples or pooled samples were calculated for each variety and used to calculate CV values among varieties. For all three tissue types, metabolite variations among different varieties detected from individual or pooled samples are well-correlated. Linear regressionR2values are 0.90, 0.92, and 0.82 for V5 leaves, 25 DAP developing kernels, and mature kernels, respectively. Furthermore, the CV distribution patterns are very similar between individual and pooled samples (Supporting Information Supplementary Figure 4). For V5 leaves, 43.7% of metabolites showed higher CV values in pooled samples compared to individual samples. In 25 DAP developing kernels and mature kernels, the numbers are 61.5 and 47.6%. This observation indicated that using pooled samples revealed variety-to-variety metabolomic variation similar to that using individual samples.
■
DISCUSSIONThorough evaluation of the applicability and limitations of the -omics technologies for food safety assessment is necessary before their acceptance for this purpose. Toward this end, we evaluated high-throughput gene expression and metabolomic technologies by characterizing the transcriptomes and metab-olomes of several conventional maize varieties using alternative protocols. Our observations led us to conclude that in applying these methods to regulatory issues, consideration should be given to natural variation in maize transcriptome and to the high degree of variation in metabolite concentrations between plant varieties and individuals of the same variety.
Technical Variation. To validate methods for both microarray and metabolomics, selected samples were analyzed multiple times to serve as technical repeats. The CV distribution for the technical microarrays showed small variations between different microarray runs for the same sample (Figure 1), validating the method and technical consistency. When compared to CVs detected from individual plant samples, the technical CVs are much smaller (Figure 1A; Supporting Information Supplementary Table 2), indicating that our microarray technology is consistent and sensitive enough to detect biological variations outside technical variations. The data correlation analysis among repeat arrays comparing individual samples and technical repeat samples confirmed this conclusion (Figure 2). Technical plus biological CVs detected from metabolomics, however, were much larger compared to microarrays (Supporting Information Supplem-etary Figure 3). This increase is not unexpected because expression of many metabolites is dynamically affected by microenvironment. Furthermore, different metabolites have very different physical and biochemical properties as well as ranges of expression and, therefore, can be affected by the extraction and derivatization methods employed. Nevertheless, biological variability was found to be greater than analytical variability. The mean CVs observed are similar to those reported in the plant metabolomic literature.
Sample Pooling.Profiling techniques are a powerful tool for gene discovery research as long as appropriate statistical tools are used to analyze the data. Pooling of mRNA samples from different individuals of the same variety for microarray hybridizations has the following advantages: (1) controls cost, (2) generates data when the amounts of individual samples are
insufficient, and (3) decreases variation between individuals. A design of multiple pools with multiple individual samples in each pool was established as a compromise.44−47 Thus, the
ability to detect the difference between biological subject-to-subject variations and the experimental technical variations is combined with the efficiency of the pooling strategy designed to reduce overall variance. The larger the individual-to-individual variability is, as compared to technical variability, the greater the reduction of variability is achieved by pooling samples.44,45
We designed the microarray and metabolomics experiments to include both individual samples and sample pools. Gene expression levels detected from microarray and metabolite abundances both showed very good correlation between individual and pooled samples within the same tissue type and variety (Tables 1 and 2). Using pooled samples lowered sample-to-sample variation, resulting in lower CV values (Figure 4; Supporting Information Supplementary Figure 1 and Tables 2, 3, 5, and 6). Interestingly, pooling microarray samples reduced the CV values more dramatically for 25 DAP samples compared to V5 leaf samples (Supporting Information Supplementary Figure 1C,D), presumably due to the higher transcriptome variation among 25 DAP individual samples compared to V5 leaf individual samples.
The mean CV values for each variety calculated from either individual plants or pooled samples represent variety-to-variety variations. The CV values representing variety-to-variety variations were similar when obtained from either individual plants or pooled samples for both microarrays and metab-olomics (Supporting Information Supplementary Figures 2 and 4). Furthermore, the distribution patterns of variety CV values were similar for both microarrays and metabolomics. A slight increase of variation in pooled samples compared with individual samples from microarrays was detected (Supporting Information Supplementary Figure 2 and Table 3), presumably due to fewer pooled samples.
Pooling plants prior to analysis also did not adversely affect the ability to classify tissues or varieties or identify discriminating metabolites by PCA (Figures 5 and 6). In fact, pooling appeared to enhance discriminating power, presumably by eliminating some noise from the data sets. Overall, our pooling strategy of three sample pools of three is a cost-saving design that does not sacrifice analytical power.
qRT-PCR and Microarray.The use of microarray profiling for comparative assessment of biotech crops requires a gene expression sequence database for probe design, gene annotation, and expression level interpretation. For many plant species, genomes or transcriptomes have not been completely sequenced except for a few model genotypes. The maize genome has an especially high level of DNA sequence polymorphisms, approximately an order of magnitude higher than that in humans.48−50A high level of genotypic variation in
maize introduces challenges for gene expression profiling such as microarray or PCR-based technologies, because experimental designs are based on knowledge obtained from just one or two varieties. As most of the genomic sequence and transcriptome for the varieties used in this study are not available, microarray hybridization efficiency is expected to vary between varieties. In the microarray study and in qRT-PCR, the primers and probes were designed using gene sequences of the B73 reference genome. Consequently, we observed substantial variation in single-well qRT-PCR efficiencies for the amplification of the same gene from different maize variety samples (data not
shown). This resulted in some inconsistency in expression values detected by qRT-PCR and microarrays across different varieties (Figure 3). For some genes, expression values assayed by qRT-PCR were very different from the corresponding microarray expression levels (Figure 3). This observation raises concerns about the validity of probe homology-dependent methodologies in highly diverse species. In some cases, very large variation in measured expression levels between varieties may be due to the presence or absence of variation.51For future studies, caution should be exercised when using microarray technology under similar circumstances. When transgenic and nontransgenic varieties are compared, pairs of lines should be used that are isogenic except for the presence of transgenes.
Metabolomics. The physiological concentration range of metabolites is very broad (Supporting Information Supple-mentary Table 7).52,53 The lower technical variation for microarrays compared to metabolomics (Figure 1; Supporting Information Supplementary Figure 3) can be partially explained by quantile normalization of microarray data, which helps reduce CV. The CV ranges observed in our study are nevertheless comparable to those seen by others using different systems.54−57
The levels of many metabolites measured by metabolomics are extremely sensitive to not only the experimental procedures and instrument type used but also the environment from which the samples are collected. Nevertheless, large changes in the amounts of many metabolites within a plant rarely make significant overall contributions to the nutritional composition or raise safety concerns.12,53,58−60Genetic background strongly
affects metabolite levels,60,61 usually more than transgene insertions.16,20,63 Per-sample cost for metabolomics is much lower compared to microarrays, allowing more sample replicates, increasing statistical power and lowering technical variation while retaining true variation in physiological metabolite levels.
GC-MS-based high-throughput metabolomics requires a uniform extraction and sample processing protocol for hundreds of metabolites differing in chemical properties and in vivo concentrations, which leads to suboptimal analytical conditions for many metabolites. Most metabolomic techniques lack sufficient analytical breadth to accurately measure hundreds of metabolites with very diverse chemical proper-ties.64−66 Analytical compromises must be made to achieve
high-throughput and high metabolome coverage, rendering metabolomic data fundamentally different from targeted analysis of specific analytes. Even augmented with LC-MS and CE-MS, metabolomics does not cover all of the compounds presumed to be present in maize leaves or kernels. Also, metabolomics results include a large amount of unidentified metabolites that currently cannot be mapped to a biochemical pathway. Thus, a traditional metabolic pathway-centric evaluation of metabolomic data for safety assessment is not conceptually appropriate. The lack of knowledge of metabolic pathways and the limited availability of reference standards and databases also have restricted the use of metabolomic technology for tasks best served by traditional targeted analytical methods. Therefore, it might be preferable to combine nontargeted methods with multivariate tools such as PCA and hierarchical clustering to visualize sample relationships, rather than to focus on individual metabolite tolerance levels.62
Although our metabolomic study identified metabolites present at significantly different levels in different maize
varieties, the biological significance of these differences should be interpreted with caution.16,67 We reported relative metabolite abundances rather than absolute abundances; therefore, only metabolomic data generated using the same experimental procedures, detection methodologies, and internal controls should be compared to this data set directly. This consideration is additional to significant biological variability. As recommended by Codex Alimentarius,68 “The statistical significance of any observed differences should be assessed in the context of the range of natural variations for that parameter to determine its biological significance.” Our study strongly supports this recommendation.
■
ASSOCIATED CONTENT*
S Supporting InformationSupplementary Figures 1−4 and Tables 1−7. This material is
available free of charge via the Internet at http://pubs.acs.org.
■
AUTHOR INFORMATION NotesThe authors declare no competingfinancial interest.
■
ACKNOWLEDGMENTSWe express appreciation to the Wilmington Regulatory Science team for assistance in tissue generation; John Nau for carrying out the microarray experiments and data processing; Teresa Harp for carrying out the metabolomics experiments; Xiaoxiao Kong and Bonnie Hong for assistance in data analysis; Antoni Rafalski for assistance in the preparation of the manuscript; and Antoni Rafalski, Stan Luck, and Mary Locke for critical review of the manuscript.
■
ABBREVIATIONS USEDGMO, genetically modified organism; qRT-PCR, quantitative reverse transcript PCR; OECD, Organization for Economic Co-operation and Development; GM, genetically modified; ILSI, International Life Sciences Institute; mRNA, message RNA; RNA, ribonucleic acid; GC-MS, gas chromatography−
mass spectrometry; DAP, days after pollination; cRNA, complementary RNA; MSTFA, N-methyl-N -(trimethylsilyl)-trifluoroacetamide; PFTBA, perfluorotributylamine; CV, co-efficient of variation; PCA, principal component analysis; cDNA, complementary DNA; RT, reverse transcription; NCBI, National Center for Biotechnology Information; qPCR, quantitative PCR; LC-MS, liquid chromatography−ass
spec-trometry; CE-MS, capillary electrophoresis/mass specspec-trometry; TMS, trimethylsilyl
■
REFERENCES(1) Fedoroff, N. V.; Battisti, D. S.; Beachy, R. N.; Cooper, P. J. M.; Fischhoff, D. A.; Hodges, C. N.; Knauf, V. C.; Lobell, D.; Mazur, B. J.; Molden, D.; Reynolds, M. P.; Ronald, P. C.; Rosegrant, M. W.; Sanchez, P. A.; Vonshak, A.; Zhu, J.-K. Radically rethinking agriculture for the 21st century.Science2010,327, 833−834.
(2) Godfray, H. C. J.; Beddington, J. R.; Crute, I. R.; Haddad, L.; Lawrence, D.; Muir, J. F.; Pretty, J.; Robinson, S.; Thomas, S. M.; Toulmin, C. Food security: the challenge of feeding 9 billion people.
Science2010,327, 812−818.
(3) Park, J. R.; McFarlane, I.; Phipps, R. H.; Ceddia, G. The role of transgenic crops in sustainable development.Plant Biotechnol. J.2010,
9, 2−21.
(4) McGloughlin, M. N. Modifying agricultural crops for improved nutrition.New Biotechnol.2010,27, 494−504.
(5) Domingo, J.; Bordonaba, J. G. A literature review on the safety assessment of genetically modified plants.Environ. Int.2011,37, 734−
742.
(6) Kuiper, H. A.; Kleter, G.; Noteborn, H. P.; Kok, E. J. Assessment of food safety issues related to genetically modified foods. Plant J.
2001,27, 503−528.
(7) Kok, E. J.; Kuiper, H. A. Comparative safety assessment for biotech crops.Trends Biotechnol.2003,21, 439−444.
(8) König, A.; Cockburn, A.; Crevel, R. W. R.; Debruyne, E.; Grafstroem, R.; Hammerling, U.; Kimber, I.; Knudsen, I.; Kuiper, H. A.; Peijnenburg, A. A. C. M.; Penninks, A. H.; Poulsen, M.; Schauzu, M.; Wal, J. M. Assessment of the safety of foods derived from genetically modified (GM) crops. Food Chem. Toxicol. 2004, 42, 1047−1088.
(9) Organization for Economic Cooperation and Development.An Introduction to the Food/Feed Safety Consensus Documents of the Task Force; Series on the Safety of Novel Foods and Feeds 14; Paris, France, 2006; pp 7−9.
(10) Chassy, B. M. Can -omics inform a food safety assessment?
Regul. Toxicol. Pharmacol.2010,58, S62−S70.
(11) ILSI. Recent developments in the safety and nutritional assessment of nutritionally improved foods and feeds. Compr. Rev.
Food Sci. Food Saf.2008,7, 50−113.
(12) Herman, R. A.; Chassy, B. M.; Parrott, W. Compositional assessment of transgenic crops: an idea whose time has passed?Trends
Biotechnol.2009,27, 565−567.
(13) Davies, H. V.; Shepherd, L. V. T.; Stewart, D.; Frank, T.; Röhlig, R. M.; Engel, K.-H. Metabolome variability in crop plant species −
when, where, how much and so what? Regul. Toxicol. Pharmacol. 2010b,58, S54−S61.
(14) Harrigan, G. G.; Glenn, K. C.; Ridley, W. P. Assessing the natural variability in crop composition. Regul. Toxicol. Pharmacol.
2010,58, S13−S20.
(15) ILSI. Nutritional and safety assessments of foods and feeds nutritionally improved through biotechnology.Compr. Rev. Food Sci.
Food Saf.2004,3, 36−104.
(16) Harrigan, G. G.; Lundry, D.; Drury, S.; Berman, K.; Riordan, S. G.; Nemeth, M. A.; Ridley, W. P.; Glenn, K. C. Natural variation in crop composition and the impact of transgenesis. Nat. Biotechnol. 2010b,28, 402−404.
(17) EFSA. Guidance document of the scientific panel on genetically modified organisms for the risk assessment of genetically modified plants and derived food and feed.EFSA J.2006,99, 1−100.
(18) Joyce, A. R.; Palsson, B. O. The model organism as a system: integrating‘omics’data sets.Nat. Rev. Mol. Cell Biol.2006,7, 198−210.
(19) Li, X.; Huang, K. L.; Zhu, B. Z.; Tang, M. Z.; Luo, Y. B. Potentiality of “omics” techniques for the detection of unintended effects in genetically modified crops. J. Agric. Biotechnol. 2005, 13, 1082−1088.
(20) Ricroch, A. E.; Bergé, J. B.; Kuntz, M. Evaluation of genetically engineered crops using transcriptomic, proteomic, and metabolomic profiling techniques.Plant Physiol.2011,155, 1752−1761.
(21) Davies, H. A role for “omics” technologies in food safety assessment.Food Control2010,21, 1601−1610.
(22) Baudo, M. M.; Lyons, R.; Powers, S.; Pastori, G. M.; Edwards, K. J.; Holdsworth, M. J.; Shewry, P. R. Transgenesis has less impact on the transcriptome of wheat grain than conventional breeding. Plant
Biotechnol. J.2006,4, 369−380.
(23) Batista, R.; Saibo, N.; Lourenco, T.; Oliveira, M. M. Microarray analyses reveal that plant mutagenesis may induce more transcriptomic changes than transgene insertion.Proc. Natl. Acad. Sci. U.S.A. 2008,
105, 3640−3645.
(24) van Dijk, J. P.; Leifert, C.; Barros, E.; Kok, E. J. Gene expression profiling for food safety assessment: examples in potato and maize.
Regul. Toxicol. Pharmacol.2010,58, S21−S25.
(25) Schauer, S.; Fernie, A. R. Plant metabolomics: towards biological function and mechanism.Trends Plant Sci.2006,11, 508−516.
(26) Hall, R. D. Plant metabolomics: from holistic hope, to hype, to hot topic.New Phytol.2006,169, 453−468.
(27) Hayes, K. R.; Beatty, M.; Meng, X.; Simmons, C. R.; Habben, J. E.; Danilevskaya, O. N. Maize global transcriptomics reveals pervasive leaf diurnal rhythms but rhythms in developing ears are largely limited to the core oscillator.PLoS One2010,5, e12887.
(28) Fiehn, O.; Wohlgemuth, G.; Scholz, M.; Kind, T.; Lee, D. Y.; Lu, Y.; Moon, S.; Nikolau, B. Quality control for plant metabolomics: reporting MSI-compliant studies.Plant J.2008,53, 691−704.
(29) McElver, J.; Tzafrir, I.; Aux, G.; Rogers, R.; Ashby, C.; Smith, K.; Thomas, C.; Schetter, A.; Zhou, Q.; Cushman, M. A.; Tossberg, J.; Nickle, T.; Levin, J. Z.; Law, M.; Meinke, D.; Patton, D. Insertional mutagenesis of genes required for seed development inArabidopsis
thaliana.Genetics2001,159, 1751−1763.
(30) Luo, M.; Liu, J.; Lee, R. D.; Guo, B. Z. Characterization of gene expression profiles in developing kernels of maize (Zea mays) inbred Tex6.Plant Breed.2008,127, 569−578.
(31) Zhao, S.; Fernald, R. D. Comprehensive algorithm for quantitative real-time polymerase chain reaction. J. Comput. Biol. 2005,12(8), 1045−1062.
(32) Fan, J.; Tam, P.; Woude, G. V.; Ren, Y. Normalization and analysis of cDNA microarrays using within-array replications applied to neuroblastoma cell response to a cytokine.Proc. Natl. Acad. Sci.
U.S.A.2004,101, 1135−1140.
(33) Zhou, J.; Thompson, D. K. In Microarray Technology and Applications in Environmental Microbiology; Sparks, D. L., Ed.; Advances in Agronomy Vol. 82; Academic Press: San Diego, CA, USA, 2004; pp 183−270.
(34) Novak, J. P.; Miller, M. C., III; Bell, D. A. Variation in fiberoptic bead-based oligonucleotide microarrays: dispersion characteristics among hybridization and biological replicate samples. Biol. Direct
2006,1, 18.
(35) Sato, F.; Tsuchiya, S.; Terasawa, K.; Tsujimoto, G. Intra-platform repeatability and inter-Intra-platform comparability of microRNA microarray technology.PLoS One2009,4, e5540.
(36) Rutledge, R. G.; Stewart, D. A kinetic-based sigmoidal model for the polymerase chain reaction and its application to high-capacity absolute quantitative real-time PCR.BMC Biotechnol.2008,8, 47.
(37) Cruz, F.; Kalaoun, S.; Nobile, P.; Colombo, C.; Almeida, J.; Barros, L. M. G.; Romano, E.; Grossi-de-Sa, M. F.; Vaslin, M.; Alves-́
Ferreira, M. Evaluation of coffee reference genes for relative expression studies by quantitative real-time RT-PCR.Mol. Breed.2009,23, 607−
616.
(38) Ruijter, J. M.; Ramakers, C.; Hoogaars, W. M. H.; Karlen, Y.; Bakker, O.; van den Hoff, M. J. B.; Moorman, A. F. M. Amplification efficiency: linking baseline and bias in the analysis of quantitative PCR data.Nucleic Acids Res.2009,37, e45.
(39) Capitão, C.; Paiva, J. A. P.; Santos, D. M.; Fevereiro, P.Medicago truncatula, water deficit modulates the transcript accumulation of components of small RNA pathways.BMC Plant Biol.2011,11, 79.
(40) Demidenko, N. V.; Logacheva, M. D.; Penin, A. A. Selection and validation of reference genes for quantitative real-time PCR in buckwheat (Fagopyrum esculentum) based on transcriptome sequence data.PLoS One2011,6, e19434.
(41) Graeber, K.; Linkies, A.; Wood, A. T. A.; Leubner-Metzger, G. A guideline to family-wide comparative state-of-the-art quantitative RT-PCR analysis exemplified with a Brassicaceae cross-species seed germination case study.Plant Cell2011,23, 2045−2063.
(42) Mafra, V.; Kubo, K. S.; Alves-Ferreira, M.; Ribeiro-Alves, M.; Stuart, R. M.; Boava, L. P.; Rodrigues, C. M.; Machado, M. A. Reference genes for accurate transcript normalization in citrus genotypes under different experimental conditions.PLoS One 2012, 2, e31263.
(43) Marum, L.; Miguel, A.; Ricardo, C. P.; Miguel, C. Reference gene selection for quantitative real-time PCR normalization inQuercus
suber.PLoS One2012,4, e35113.
(44) Kendziorski, C. M.; Zhang, Y.; Lan, H.; Attie, A. D. The efficiency of pooling mRNA in microarray experiments. Biostatistics
2003,4, 465−477.
(45) Kendziorski, C.; Irizarry, R. A.; Chen, K.-S.; Haag, J. D.; Gould, M. N. On the utility of pooling biological samples in microarray experiments.Proc. Natl. Acad. Sci. U.S.A.2005,102, 4252−4257.
(46) Peng, X.; Wood, C. L.; Blalock, E. M.; Chen, K. C.; Landfield, P. W.; Stromberg, A. J. Statistical implications of pooling RNA samples for microarray experiments.BMC Bioinf.2003,4, 26.
(47) Zhang, W.; Carriquiry, A.; Nettleton, D.; Dekkers, J. C. M. Pooling mRNA in microarray experiments and its effect on power.
Bioinformatics2007,23, 1217−1224.
(48) Buckler, E. S.; Thornsberry, J. M. Plant molecular diversity and applications to genomics.Curr. Opin. Plant Biol.2002,5, 107−111.
(49) Ching, A.; Caldwell, K. S.; Jung, M.; Dolan, M.; Smith, O. S.; Tingey, S.; Morgante, M.; Rafalski, J. A. SNP frequency, haplotype structure and linkage disequilibrium in elite maize inbred lines.BMC
Genet.2002,3(19), 3−19.
(50) Rafalski, A.; Morgante, M. Corn and humans: recombination and linkage disequilibrium in two genomes of similar size. Trends
Genet.2004,20, 103−111.
(51) Springer, N. M.; Ying, K.; Fu, Y.; Ji, T.; Yeh, C.-T.; et al. Maize inbreds exhibit high levels of copy number variation (CNV) and presence/absence variation (PAV) in genome content. PLoS Genet. 2009,5(11), e1000734 DOI: 10.1371/journal.pgen.1000734.
(52) Eldridge, A. C.; Kwolek, W. F. Soybean isoflavones: effect of environment and variety on composition.J. Agric. Food Chem. 1983,
31, 394−396.
(53) Gutierrez-Gonzalez, J. J.; Wu, X.; Zhang, J.; Lee, J. D.; Ellersieck, M.; Shannon, J. G.; Yu, O.; Nguyen, H. T.; Sleper, D. A. Genetic control of soybean seed isoflavone content: importance of statistical model and epistasis in complex traits.Theor. Appl. Genet.2009,119, 1069−1083.
(54) Morgenthal, K.; Wienkoop, S.; Scholz, M.; Selbig, J.; Weckwerth, W. Correlative GC-TOF-MS-based metabolite profiling and LC-MS-based protein profiling reveal time-related systemic regulation of metabolite-protein networks and improve pattern recognition for multiple biomarker selection. Metabolomics 2005, 1, 109−121.
(55) Sysi-Aho, M.; Katajamaa, M.; Yetukuri, L.; Orešič, M. Normalization method for metabolomics data using optimal selection of multiple internal standards.BMC Bioinf.2007,8, 93.
(56) Parsons, H. M.; Ekman, D. R.; Collette, T. W.; Viant, M. R. Spectral relative standard deviation: a practical benchmark in metabolomics.Analyst2009,134, 478−485.
(57) Toubiana, D.; Semel, Y.; Tohge, T.; Beleggia, R.; Cattivelli, L.; Rosental, L.; Nikoloski, Z.; Zamir, D.; Fernie, A. R.; Fait, A. Metabolic profiling of a mapping population exposes new insights in the regulation of seed metabolism and seed, fruit, and plant relations.PLoS
Genet.2012,8, e1002612.
(58) Harrigan, G. G.; Stork, L. G.; Riordan, S. G.; Reynolds, T. L.; Ridley, W. P.; Masucci, J. D.; Macisaac, S.; Halls, S. C.; Orth, R.; Smith, R. G.; Wen, L.; Brown, W. E.; Welsch, M.; Riley, R.; Mcfarland, D.; Pandravada, A.; Glenn, K. C. Impact of genetics and environment on nutritional and metabolite components of maize grain.J. Agric. Food
Chem.2007,55, 6177−6185.
(59) Skogerson, K.; Harrigan, G. G.; Reynolds, T. L.; Halls, S. C.; Ruebelt, M.; Iandolino, A.; Pandravada, A.; Glenn, K. C.; Fiehn, O. Impact of genetics and environment on the metabolite composition of maize grain.J. Agric. Food Chem.2010,58, 3600−3610.
(60) Zhou, J.; Harrigan, G. G.; Berman, K. H.; Webb, E. G.; Klusmeyer, T. H.; Nemeth, M. A. Stability of the compositional equivalence of grain from insect-protected corn and seed from herbicide-tolerant soybean over multiple seasons, locations and breeding germplasms.J. Agric. Food Chem.2010,59, 8822−8828.
(61) Reynolds, T. L.; Nemeth, M. A.; Glenn, K. C.; Ridley, W. P.; Astwood, J. D. Natural variability of metabolites in maize grain: differences due to genetic background.J. Agric. Food Chem.2005,53, 10061−10067.
(62) Asiago, V.; Hazebroek, J.; Harp, T.; Zhong, C. Effect of genetics and environment on the metabolome of commercial maize hybrids: a multisite study.J. Agric. Food Chem.2012,60, 11498−11508.
(63) Catchpole, G. S.; Beckmann, M.; Enot, D. P.; Mondhe, M.; Zywicki, B.; Taylor, J.; Hardy, N.; Smith, A.; King, R. D.; Kell, D. B.; Fiehn, O.; Draper, J. Hierarchical metabolomics demonstrates substantial compositional similarity between genetically modified and conventional potato crops. Proc. Natl. Acad. Sci. U.S.A. 2005, 102, 14458−14462.
(64) Goodacre, R.; Vaidyanathan, S.; Dunn, W. R.; Harrigan, G. G.; Kell, D. B. Metabolomics by numbers−acquiring and understanding
global metabolite data.Trends Biotechnol.2004,22, 245−252.
(65) Rischer, H.; Oksman-Caldentey, K.-M. Unintended effects in genetically modified crops: revealed by metabolomics? Trends
Biotechnol.2006,24, 102−104.
(66) Kusano, M.; Redestig, H.; Hirai, T.; Oikawa, A.; Matsuda, F.; Fukushima, A.; Arita, M.; Watanabe, S.; Yano, M.; Hiwasa-Tanase, K.; Ezura, H.; Saito, K. Covering chemical diversity of genetically-modified tomatoes using metabolomics for objective substantial equivalence assessment.PLoS One2011,6, e16989.
(67) Goodman, S. A dirty dozen: twelve p-value misconceptions.
Semin. Hematol.2008,45, 135−140.
(68) Codex Alimentarius. Guideline for the conduct of food safety assessment of foods derived from recombinant-DNA plants; http:// www.codexalimentarius.net/input/download/standards/10021/ CXG_045e.pdf (accessed March 4, 2013).