Asset Quality Misrepresentation by Financial
Intermediaries: Evidence from the RMBS Market
TOMASZ PISKORSKI, AMIT SERU, and JAMES WITKIN∗
ABSTRACT
We document that contractual disclosures by intermediaries during the sale of mort-gages contained false information about the borrower’s housing equity in 7–14% of loans. The rate of misrepresented loan default was 70% higher than for similar loans. These misrepresentations likely occurred late in the intermediation and ex-ist among securities sold by all reputable intermediaries. Investors—including large institutions—holding securities with misrepresented collateral suffered severe losses due to loan defaults, price declines, and ratings downgrades. Pools with misrepresen-tations were not issued at a discount. Misrepresentation on another easy-to-quantify dimension shows that these effects are a conservative lower bound.
MARKET RULES AND REGULATIONSthat require disclosure of information and pro-hibit misleading statements on the financial products being manufactured by intermediaries play an important role in the functioning of capital markets (Akerlof (1970)). However, the nature of intermediation has changed dramati-cally over the past decade, with the introduction of more agents in the supply chain of credit (Loutskina and Strahan (2009), Keys et al. (2013), Nadauld and Sherlund (2013)) potentially weakening the ability of existing market ar-rangements and regulatory oversight to ensure truthful disclosure of asset quality. This concern has gained momentum in the aftermath of the recent crisis, which witnessed a precipitous decline in the value of supposedly safe
∗Tomasz Piskorski is at Columbia Business School, Amit Seru is at the University of Chicago and the National Bureau of Economics Research, and James Witkin is at Columbia Business School. Piskorski thanks the Paul Milstein Center for Real Estate at Columbia Business School and the NSF (Grant 1124188) for financial support. Seru thanks the Initiative on Global Markets at Booth for financial support. Witkin thanks the Paul milstein Center for Real Estate at Columbia Busi-ness School for financial support. We thank Gene Amromin, Charlie Calomiris, John Cochrane, Gene Fama, John Griffin, Chris Mayer, Lasse Pedersen, Tyler Shumway, Ken Singleton, Richard Stanton, Phil Strahan, Amir Sufi, and Luigi Zingales, two anonymous referees, as well as seminar and conference participants at AQR, Columbia Business School, Purdue, Rice, Rutgers, Stockholm University, the Securities and Exchange Commission, the University of Illinois, Global Justice Fo-rum, National Bank of Poland, NBER Economics of Real Estate summer meeting, AFA, AREUEA, NUS-IRES Symposium, Red Rock Finance conference, Summer Real Estate Symposium, and UC Berkeley Conference on Fraud and Misconduct for valuable comments. We are grateful to Equifax and BlackBox Logic for their data. We also thank Ing-Haw Cheng, Andrew Ellul, and Taylor Nadauld for sharing their data. We are indebted to Vivek Sampathkumar and Zach Wade for outstanding research assistance.
DOI: 10.1111/jofi.12271
securities as well as large investor losses (Acharya, Schnabl, and Suarez (2013)).1 This paper adds to the debate by quantifying the extent to which buyers may have received false information about the true quality of assets by the sellers of the securities, investigating where in the supply chain of credit these misrepresentations likely occurred, and examining the economic conse-quences of such misrepresentations.
We focus on misrepresentation of the asset quality of securities collateralized by residential mortgages originated without government guarantees, that is, nonagency residential mortgage-backed securities (RMBS), a $2 trillion mar-ket in 2007 (Keys et al. (2013)). These misrepresentations are not instances of the usual asymmetric information problem in which buyers know less than the seller. Rather, we argue that they are instances in which sellers provided buyers false information on asset characteristics during the contractual disclo-sure process. In the first part of the paper we focus on detecting such instances and where in the supply chain of credit these might have occurred. In the sec-ond part, we focus on understanding whether these misrepresentations were costly for buyers. The null hypothesis is that these misrepresentations, even if present, did not have a meaningful impact, either because they did not mat-ter for performance or because investors were able to differentiate pools with versus without misrepresented assets.
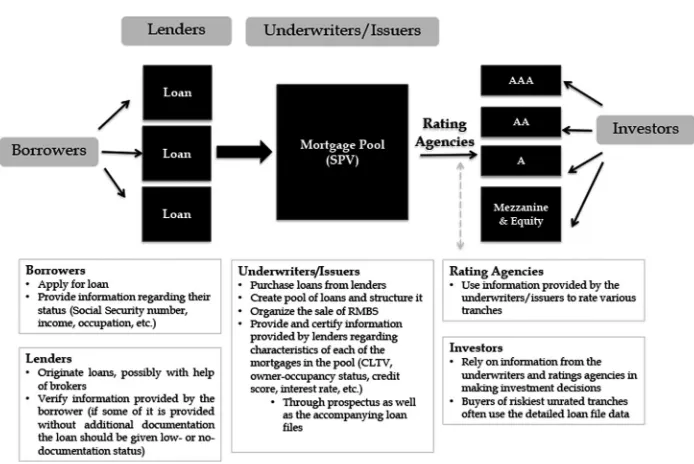
As we discuss in SectionI, the RMBS securitization process involves aggre-gating mortgages into loan trusts, either through direct origination or indirect acquisition, and using their underlying cash flows to issue securities. The sale of these securities is organized by underwriters who, as part of this process, collect, verify, and certify information regarding the quality of the underlying collateral backing these securities. The underwriters in this market are large, reputable financial intermediaries, which are considered more sophisticated than the buyers in this market, which are typically institutional investors such as pension funds, mutual funds, and insurance companies. The underly-ing collateral data collected durunderly-ing mortgage origination are made available to investors of these securities, both in aggregated form in prospectuses as well as in the form of detailed loan files obtained from originators (lenders).
Our analysis focuses on an easy-to-quantify dimension of asset quality mis-representation during the sale of mortgages: loans that are reported as having no other lien when in fact the properties backing the first (senior) securitized mortgage were also financed with a simultaneously originated second (junior) mortgage. The consequence of this type of misrepresentation is that the re-portedcombined loan-to-value ratio (CLTV) at origination is materially lower than theactualCLTV of the loan. Since the true equity stake of the borrower on such a loan is lower than the reported one, these loans carry significantly higher default risk. As we show, a loan’s CLTV is one of the most fundamental
1Critics of imposing more regulation argue that reputational concerns of large, well-established
metrics that market participants take into account when assessing the value and risk of mortgage securities. Thus, misrepresentation on this dimension implies that RMBS investors took on more risk than was implied by the con-tractual disclosure.
We identify second lien misrepresentation by comparing the characteristics of mortgages disclosed to investors at the time of sale with those in a data set provided by a credit bureau. Specifically, as we discuss in Section II, we use a data set provided by a credit bureau that matches loan-level data on mortgages disclosed to investors (BlackBox) with highly accurate data on these loans from consumer credit files at the same bureau (Equifax). A high-quality matched data set is critical for constructing measures of misrepresentation. Several pieces of evidence reported in SectionIIIconvincingly demonstrate the quality of the match.
In SectionIV, we show that a significant degree of misrepresentation of col-lateral quality exists across nonagency RMBS pools. More than 7% of loans (13.6% using a broader definition) reported to investors as not having a junior lien did have a second lien. On average these loan files understate the true CLTV by about 20 percentage points. The misrepresentations are concentrated among loans used to purchase properties where more than 14% of loans re-ported to investors as not having a junior lien are misrepresented. Moreover, misrepresentations are not confined to loans with reported low documentation status.
The second-lien misrepresentation captures economically meaningful infor-mation about asset quality. Loans with a misrepresented higher lien, which we find are often fully documented, have about 10 percentage points higher like-lihood of default compared to loans with similar characteristics but no higher lien. This estimate is large, implying about 70% higher mean default rate of misrepresented loans relative to loans without higher liens. Lenders charged somewhat higher interest rates on loans with misrepresented second liens rel-ative to similar loans with no such lien. However, the interest rate markups on the misrepresented loans were much smaller relative to loans with similar or lower default risk, that is, those that truthfully disclosed a higher lien.
In Section V, we investigate which entities—the borrower, lender, and underwriter—might have been aware of misrepresentation more systemati-cally. To do so, we exploit an internal database of a large subprime lender, which allows us to observe the data that the lender collected during origina-tion. Comparing this information with that disclosed to the investors, we find that the lender knew second liens were present in almost all cases of second-lien misrepresentation, which implies that the misreporting occurred later in the supply chain of credit (i.e., within the boundaries of the financial industry). This evidence is not particular to one large lender; we confirm these findings in a broader sample of lenders using the registry of deeds that records the legal titles to the properties. Almost all mortgages that we identify as having a misreported second lien have such liens recorded in the registry of deeds. Notably, virtually all of the misreported second-lien loans are originated by the
significant cases of second-lien misrepresentation, the lender and the under-writer associated with the loan are thesame institution. Thus, lenders were aware of second-lien loans that were misrepresented and at least in some cases the underwriters could have easily accessed this information, as their own lend-ing arms originated the loans. Further, though there is heterogeneity in the extent of misrepresentations among securities sold by reputable underwriters, a significant amount exists across all of them.
In SectionVI, we investigate the impact of second-lien misrepresentation on the RMBS market and present several important findings. First, confirming our loan-level evidence, we show that pools with a larger share of loans with misrepresented second liens suffer significantly higher losses.
Second, using tranche-level information, we show that these losses were not confined to only the most junior tranches (the riskiest securities that are hit first when the pool backing these securities suffers a loss) in misrepre-sented pools. Rather, even the most senior and safest tranches appear to suffer significant losses if the fraction of misrepresented loans in a pool is large. The evidence on tranche-level losses is also reflected in larger subsequent price declines and ratings downgrades of tranches backed by misrepresented pools.
Third, using measures of pricing employed by prior literature we show that there is no relation between the share of misreported assets in a pool and its pricing. Specifically, there is no evidence that pools with a larger share of misrepresentations—those carrying significantly higher default risk and suf-fering large subsequent losses and price declines—were sold at a discount at issuance, relative to pools with few misrepresentations. Further, the rat-ing of pools at issuance did not reflect the variation in the share of misrep-resented loans across pools. More importantly, however, we show that pool pricing did reflect disclosed information to investors—pools with higher dis-closed cumulative debt (i.e., second lien) were sold at a discount. Thus, secu-rities backed by misrepresented collateral were sold for more than what their price would have been had their characteristics been truthfully reported to investors.
in junior tranches, or if some losses were also borne by sellers of these securi-ties that may have kept some of the unsold tranches backed by misrepresented collateral on their balance sheet. However, anecdotes and public testimonies indicate that prior to the crisis, sellers of mortgage securities succeeded in sell-ing most of the RMBS tranches, includsell-ing the most junior tranches. Thus, it is likely that investors and not sellers bore the losses due to misrepresentation of collateral that backed RMBS.
Our analysis rejects the hypothesis that these misrepresentations did not have large material economic consequences. Investors bought misrepresented assets that proved to be ex post significantly more risky relative to what would be assessed based on the contractual disclosure. Moreover, investors were un-able to distinguish pools with a large amount of misrepresented assets from those that had few misrepresentations.2These assets, at least in part, seem to have been misrepresented by financial intermediaries, and could meaningfully impact investors’ short-term profits. Notably, as we show in SectionVII, there are other types of easy-to-quantify misrepresentation beyond the second-lien one. Our estimates are thus a conservative lower bound on the extent and consequences of misrepresentation in the RMBS market.
Overall, as we discuss in SectionVII, our results suggest that the current market arrangements, based on reputational concerns and explicit incentives, may have been insufficient to prevent misrepresentations of asset quality in a large capital market. Our findings are in line with studies that suggest the existing regulatory framework may have been insufficient to prevent such behavior (see Keys et al. (2009)).
The remainder of this paper is organized as follows. Section Idescribes in-formation disclosure in the nonagency RMBS market. SectionIIdescribes our data. In SectionIIIwe construct and validate the second-lien misrepresenta-tion measure. In Secmisrepresenta-tionIVwe use this measure to quantify the extent of asset quality misrepresentation and study its impact on loan performance and pric-ing. In SectionVwe investigate at which stage of the financial intermediation chain the misrepresentations likely occurred. In SectionVIwe investigate the impact of second-lien misrepresentation on losses and pricing of mortgage se-curities. Finally, in SectionVIIwe discuss broader implications of our findings and their relation to the relevant literature.
2It is important to note that we are not taking a stand on the extent to which the average level
Figure 1. Key players involved in the creation and sale of RMBS.This figure presents a simple schematic of key players involved in the creation and sale of assets in this market. We also discuss the associated information flow.
I. Nonagency RMBS Market and Information Disclosure
The vast majority of mortgages originated in the United States are not held by the banks that originated them, but are instead securitized and sold as secu-rities to investors. In this paper we focus on RMBS collateralized by mortgage loans originated without government guarantees, that is, nonagency RMBS. This sector was a significant portion of the overall mortgage market, reaching more than $2 trillion of securities outstanding in 2007 (Keys et al. (2013)). We discuss two aspects of this market below. First, we discuss the key players in-volved in loan origination and selling. Second, we discuss the information sets of the different players, which are critical in identifying misrepresentations at the time of sale.
securities or sell the loans to financial intermediaries who do the pooling and creation of such securities.
The structuring and sale of these securities are organized by the underwrit-ers, which are typically large and reputable financial institutions that often also originate mortgages. The underwriters disclose and certify information re-garding the loans underlying the mortgage-backed securities that was collected during the origination process preceding their sale. The pool characteristics are commonly disclosed in the prospectus in the section related to “representations and warranties.” This disclosure summarizes information about variables rel-evant for assessing the risk-return of the pool, such as loan-to-value ratios of loans in the pool, their interest rates, borrowers’ credit scores, and the occu-pancy status and location of the properties backing the mortgages. Each pool is also accompanied by a loan-level data file that contains detailed information regarding each mortgage in a given pool. In addition to prospective investors, this information can be used by rating agencies to rate the pool. Prior to the crisis, underwriters managed to sell the vast majority of mortgage securities. This includes the riskiest (equity-like) tranches, as according to the 2010 report of the Board of Governors to Congress, financial intermediaries “ . . . generally sold the equity tranche, but they sometimes retained it temporarily after clos-ing because of the difficulty in sellclos-ing this tranche. However, securitizers often ultimately succeeded in selling this piece to other market participants.”
The buyers of mortgage-backed securities are typically institutions, such as pension funds, that are generally considered less financially sophisticated than underwriters, especially in the case of highly rated senior tranches, which com-prise more than 80% of the value of the pool. These buyers rely to a large extent on the certification of these securities’ quality by the underwriters and ratings agencies. There are also some sophisticated buyers, such as hedge funds, that demand risky junior tranches. These institutions (and rating agencies) often use the detailed loan characteristics disclosed by the sellers as an input in their pricing models.
Since the information disclosed to investors by the underwriters plays an im-portant role in assessing the value of mortgage-backed securities, underwriters are contractually responsible for guaranteeing that the underlying collateral in a pool is accurately represented. Of particular relevance are contractual obligations that force the lender or underwriter to repurchase the loan from the securitization trust.3 These obligations may lead buyers of these securi-ties to neglect performing an independent review of the accuracy of disclosed information.4
As we explain in detail in SectionIII, we identify instances of misrepresen-tation by comparing characteristics of loans that weredisclosedto investors in
3For instance, the prospectus supplement for Series OOMC 2005-HE6 states that “If the seller
or the originator fails to cure a material breach of its representations and warranties with respect to any mortgage loan in a timely manner, then the seller or the originator would be required to repurchase or substitute the defective mortgage loan.”
4While repurchase clauses were common during 2005 to 2006, their enforcement was not as
the detailed loan-level data at the time of sale with characteristics of the same loans at the same time in a proprietary matched data set by a credit bureau. As we discuss in detail below, the latter data set contains highly accurate in-formation on the characteristics of these loans. We therefore identify a loan as misrepresented if the characteristic of the loan at the time of sale that is dis-closed to investors differs from that available in the credit bureau–generated data set. In running this analysis we take the perspective of an investor who used the detailed loan-level information available from the underwriter at the time of sale.
We focus on misrepresentation of the collateral backing the RMBS that our data enable us to identify. The loan characteristic of interest is the to-tal debt backing the property, which serves as collateral for the mortgage sold to investors. In particular, we identify a loan as misreported if the loan is re-ported to investors as backed by property that has no associated higher liens, when the credit bureau data show that the property backing the first (senior) mortgage is also financed with a simultaneously originated second (junior) mortgage. Prospectus supplements commonly make statements regarding the total value of all liens on the collateralized property. For instance, the prospec-tus’s supplement of Series 2006-FF15 underwritten by Lehman Brothers states that the “Original full Combined to-Value Ratio reflects the original Loan-to-Value Ratio, including any subordinate liens, whether or not such subordi-nate liens are owned by the Trust Fund.”
It is worth reiterating that the information contractually disclosed to in-vestors by underwriters allows inin-vestors to assess the risk of the security. In particular, previous research shows that mortgages with a higher CLTV are often associated with greater default risk (see Mayer, Pence, and Sherlund (2009)). Thus, the misrepresentations we focus on—omitting information on the junior mortgage on a property—can understate the true risk associated with the pool collateral. This may imply that RMBS investors took on more risk than indicated by the contractual disclosure. These assertions can be tested against the null hypothesis that these misrepresentations, if present, did not have a meaningful impact, either because they did not matter for performance or because investors were able to differentiate pools that misrepresented assets from those that did not.
II. Data
Our primary data set links two databases that allow us to construct our measures of asset collateral misrepresentation: (i) loan-level mortgage data collected by BlackBox Logic and (ii) borrower-level credit report information collected by Equifax.
information taken at the time of origination, such as the mortgage origination date and amount, borrower FICO credit score,5 servicer name, interest rate, term, interest rate type, CLTV, and borrower occupancy status. The Black-Box data also include dynamic data on monthly payments, mortgage balances, and delinquency status. Importantly, this database collects information from trustees of mortgage pools concerning characteristics of mortgages in the pool that were disclosed to investors at the time the pool was sold. In other words, these data contain the loan-level data file, that is, detailed information on orig-ination characteristics of each mortgage in a given pool, provided to investors. The other data set that we use is from Equifax—a major credit reporting agency that collects information from various sources and provides monthly data on borrowers’ current credit scores, payments, and balances on mort-gage and installment debt as well as revolving debt (such as credit cards and home-equity lines of credit (HELOCs)). The banking industry critically relies on data from credit bureaus for assessing the creditworthiness of borrowers. A large body of research concludes that such data have strong predictive power in making such an assessment (e.g., Piskorski, Seru, and Vig (2010)). Conse-quently, lenders have strong incentives to correctly report the characteristics of borrowers and their loans to credit bureaus. In addition, credit bureaus of-ten cross-validate the records using other sources, limiting the occurrence of reporting errors. Thus, the credit bureau data are generally believed to contain highly accurate information. Importantly, the RMBS investors did not have access to mortgage records in these data at the time of sale.
Equifax recently linked its credit information data to the BlackBox data using a proprietary match algorithm that merges on more than 25 variables (see the Internet Appendix for more details).6We use the merged data provided by Equifax to identify whether information in credit bureau data at the time of sale differs from that disclosed to investors as captured through the BlackBox sample.
Two comments are in order about the merged data. First, Equifax reports a merge confidence indicator that ranges from low to high confidence. Low confidence implies that a given record could have multiple matches, while high confidence implies that the match is close to perfect. Not surprisingly, as the degree of confidence increases, the sample available for analysis becomes smaller. In our analysis we restrict the sample to loans that have the highest Equifax merge confidence level. While this restriction reduces the sample size, it ensures that the misrepresentations we identify are not due to merging errors. We note that our analysis is limited to loans originated between 2005 and 2007, years for which Equifax provides us this high-confidence merge sample. Second, we limit attention to those loans disclosed to investors as first liens. After imposing these restrictions, we obtain a base sample of 1.9 million
5The FICO credit score ranges from 350 to 850, with a higher score indicating a more
credit-worthy borrower.
loans. The Internet Appendix shows that this base sample has slightly higher quality observables than those in the overall data.
III. Constructing and Validating the Second-Lien Misrepresentation Measure
A. Constructing the Second-Lien Misrepresentation Measure
Our measure of misrepresentation identifies instances in which a first-lien loan is reported to investors as backed by property that has no associated higher liens when the credit bureau data show that the property backing the first mortgage is also financed with a simultaneously originated second mortgage. To construct this measure, we use the CLTV for all liens on the property at the time of loan origination that was disclosed to investors as part of the loan-level information (a majority of loan files do report CLTV). If the lender is unable to ascertain this value or is not willing to disclose this information, the loan is usually given a missing CLTV. While it is possible that some missing CLTV values could be due to asset misrepresentation, it is hard to know this with certainty. We thus take a conservative approach and do not consider loans with missing CLTV values as having been misrepresented. Instead, we restrict our sample to loans with nonmissing CLTV, where the reported CLTV is within 1% of the loan’s loan to value ratio (LTV),7 as we can be confident that the securitized first mortgage (senior loan) for these loans was reported to the trustee of RMBS as having only one lien on the property. This yields a sample of 854,959 loan files that report no second liens to investors.
Using this sample, we construct the misreported second-lien measure based on the observation that the credit bureau (Equifax) data include information about other mortgages held by each borrower. In particular, we can examine whether loans reported to RMBS investors as having no simultaneous second liens do in fact have a second lien reported in the credit bureau data.8If this is the case, we classify the loan file as having amisreported second lien. Because we focus on data with the highest merge quality, we are confident that such instances represent second liens that were misreported to RMBS investors.
7We have also verified that loans reported to investors as having second liens do indeed have
such mortgages reported in the credit bureau data. In the vast majority of cases (more than 90%), loans that report origination CLTV greater than LTV have a simultaneous second-lien loan present in the Equifax database. The remainder likely represents cases in which lenders have not promptly reported their records to the credit bureau, which we confirmed with the data vendor. If anything, this makes our measure of misrepresentation a conservative estimate since we may not detect some misreported second liens.
8We take a conservative approach and, throughout most of our analysis, do not consider loans
In applying this measure we make a judgment call in identifying second liens as either simultaneously or subsequently originated. We classify simultaneous second liens as those that appear in the credit bureau data with an origination date within 45 days of that of the first lien. A loan is classified as having a misreported second lien if it is reported to investors as having no second lien but shows such a lien in the credit bureau data within this time window. The 45-day window allows for small differences in the recording of dates.9 It is quite unlikely that a borrower would obtain a subsequent second lien on a mortgage within this time period without the lender of the first lien having that information when reporting to investors. Our results are not sensitive, however, to changes in the length of this window.
B. Validating the Quality of the Second-Lien Misrepresentation Measure
Our misrepresentation measure relies on Equifax data being correctly matched with BlackBox data. In this section we consider whether the match between the two data sets, done by the credit bureau, is of high quality.
As we discuss above, we restrict our sample to loans that have the highest merge confidence level assigned by the credit bureau. Independent analysis of the quality of this data confirms that the merge is of very high quality. In particular, we cross-check fields such as dynamic payment history, origi-nation balance, and origiorigi-nation date across the two data sets. The Internet Appendix shows that the vast majority of these fields are the same across the two databases for the matched sample. For example, the match between payment histories increases monotonically with Equifax’s confidence measure, with only 0.3% of the loans with the highest merge confidence level having a different payment status.
Further validation of the match quality comes from analysis that assesses delinquency rates on misrepresented loans. Evidence in the literature indicates that loans with second liens have higher delinquency rates (see Mayer, Pence, and Sherlund (2009)). Hence, if our measures correctly identify misrepresen-tations, we would expect such loans to have ahigherdefault pattern compared with loans that are not misrepresented. Analysis in SectionIVshows that ex post delinquencies of loans that we identify as misrepresented are significantly higher compared with otherwise similar loans. This evidence supports the view that our identification procedure capturesactual misrepresentations of asset quality instead of incorrectly merged records.
This argument finds additional support from a placebo test that shows incor-rectly merged records should not have a strong directional relationship with subsequent loan performance. In particular, in the Internet Appendix we fo-cus on the few records in our database for which the loan balance of the first mortgage does not exactly match across the two databases. The balance of the
9Allowing for such a window is quantitatively unimportant as the vast majority of loans that
securitized first mortgage is unlikely to be misreported to investors because servicers verify and report the outstanding loan amount and payments on a monthly basis to the securitization trust. Hence, differences in such records between the two data sets likely indicate incorrectly merged loans across the two databases. We find that these incorrectly matched loans are not associ-ated with subsequent adverse performance as is the case for misrepresented loans.
Finally, if our sample consists of correctly merged records, we should be able to directly identify whether a given loan has an undisclosed second lien. As we discuss in SectionV, we are able to cross-validate the merge quality of our databases using an internal database from a large subprime lender in which almost all loans (more than 93%) that we identify as having misreported second liens do indeed have such liens reported in the bank’s internal data. In addition, we verify that almost all loans that we identify as having misreported second liens do have such liens in a sample of our data merged with the registry of deeds (more than 93%). This exercise provides an independent verification of our methodology and of the accuracy of Equifax data.10
C. Lower Bound
It is important to note that our estimate of misrepresentation in the RMBS market is likely to be a lower bound, which should bias against finding that misrepresented loans have higher ex post delinquencies relative to otherwise identical loans for two reasons. First, we consider only one dimension of misrep-resentation due to lack of data that would allow us to construct other objective measures of misrepresentation. Of course, many other types of misrepresenta-tion are possible, such as manipulamisrepresenta-tion of owner occupancy status of a home, credit scores, income, assets, value of the home, etc. Second, we do not identify misrepresentations on loans for which second liens exist but are not reported to Equifax by lenders. We return to this issue in SectionVIIwhen we discuss the broader implications of our findings.
10Our methodology treats the records in Equifax as an accurate representation of the
IV. Extent of Second-Lien Misrepresentation, Loan Performance, and Pricing
In this section we use the measure discussed above to quantify the extent of second-lien misrepresentation, and its relation with both ex post delinquency on loans and mortgage pricing by lenders.
A. Overall Level of Second-Lien Misrepresentation
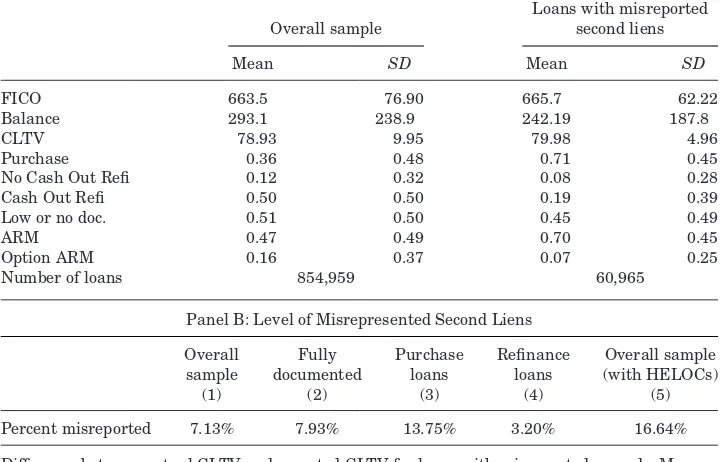
We start our analysis by quantifying the extent of second-lien misrepresenta-tion. TableIreports statistics for loans that we identify as misreporting second liens to RMBS investors. To facilitate interpretation of our results, Panel A reports the summary statistics for the overall sample of loans that report no second liens to investors as well as for the subset of these loans that are mis-represented on the dimension of second lien. Panel B reports the percentage of misrepresented loans in various subsamples of our data.
As we observe from Panel B, about 7.1% of mortgages that do not report second liens to investors are misrepresented, since these loans have a simulta-neous second lien in the credit bureau data. The misrepresented loans overstate the borrower’s housing equity significantly. In particular, misrepresented loans report an initial CLTV of about 80 percentage points on average, which is on average about 19.5 percentage points lower than its true value (with a standard deviation of about eight percentage points). This implies that, contrary to the information given to investors, borrowers with misreported second liens had very little equity left in their homes. It is also worth noting that, if we treat the presence of HELOCs as equivalent to the presence of second liens—as in many prospectuses disclosed to investors—the overall level of misreported second liens is almost twice as large: 16.64% of loans that report no second lien actu-ally have a closed-end second mortgage or a HELOC with positive outstanding balance originated at the same time as a first mortgage.
One may expect that asset misrepresentation, and, more broadly, lower reported data quality, was signaled to investors through the low- or no-documentation status of loans. However, we find a significant extent of mis-representation even when we focus on fully documented loans. About 7.93% of fully documented loans stating that a second lien is not present actually had such a second lien. We return to this fact in SectionV.
Table I
Descriptive Statistics and Average Second-Lien Misrepresentation Level
Panel A presents summary statistics of key variables for mortgages reported as having no simul-taneous second liens to the RMBS trustee (loans reported as such in the BlackBox data set). The sample comprises these loans merged with a high level of confidence with the credit bureau data. Panel A also shows summary statistics for the subsample of these mortgages that consists of loans with misreported second liens.FICOis the borrower’s FICO credit score at loan origination. Bal-anceis the initial loan balance (in thousands of dollars).CLTVis the loan’s origination combined loan-to-value ratio in percentage terms reported to investors.No Cash Out RefiandCash Out Refiare dummies that take a value of one if the loan purpose was a no-cash-out refinancing or cash-out refinancing, respectively, and zero otherwise.Low or No Doc.is a dummy that takes a value of one if the loan was originated with no or limited documentation, and zero otherwise.ARM
andOption ARMare dummies that take a value of one if the loan type was an ARM or option ARM, respectively, and zero otherwise. Panel B presents the percent of loans reported as having no simultaneous second liens that are misrepresented (loans identified as having simultaneous second liens based on our method). Column (1) shows results for the overall sample, column (2) for the subsample of fully documented loans, column (3) for the subsample of loans used to purchase homes, and column (4) for the subsample of loans used to refinance existing mortgages, while column (5) shows results when we expand the definition of simultaneous second liens to HELOCs originated simultaneously with the first-lien mortgage.
Panel A: Descriptive Statistics for Mortgages Reported as Having No Simultaneous Second Liens
Loans with misreported
Overall sample second liens
Mean SD Mean SD
FICO 663.5 76.90 665.7 62.22
Balance 293.1 238.9 242.19 187.8
CLTV 78.93 9.95 79.98 4.96
Purchase 0.36 0.48 0.71 0.45
No Cash Out Refi 0.12 0.32 0.08 0.28
Cash Out Refi 0.50 0.50 0.19 0.39
Low or no doc. 0.51 0.50 0.45 0.49
ARM 0.47 0.49 0.70 0.45
Option ARM 0.16 0.37 0.07 0.25
Number of loans 854,959 60,965
Panel B: Level of Misrepresented Second Liens
Overall Fully Purchase Refinance Overall sample sample documented loans loans (with HELOCs)
(1) (2) (3) (4) (5)
Percent misreported 7.13% 7.93% 13.75% 3.20% 16.64%
will refinance outstanding first and second liens with one loan, eliminating the possibility of second-lien misrepresentation in refinancing. Indeed, in our data about 37.4% of purchases are financed with simultaneous second liens compared with only 14.2% of refinance transactions.
Finally, we note that loan misrepresentation does not concentrate in specific geographic areas. In particular, while there is significant regional variation in the prevalence of misrepresentation across the United States, a sizable degree of misrepresentation exists in loans originated in the vast majority of U.S. states. We return to this issue in SectionVII.E.
Next, we investigate the degree to which asset misrepresentation varies with observable characteristics over time. To do so, we estimate loan-level regressions of the following form:
Yi=α+βXi+γ×Misreported Secondi+εi, (1)
where the key dependent variable,Misreported Second,is a dummy variable that takes a value of one if loanistates to investors that it has no simultaneous second lien but our procedure indicates that there is such a lien, and zero otherwise. Because we are interested in how asset misrepresentation is related to observable loan characteristics, we include a vector Xi that consists of loan-level observable characteristics such as credit score and CLTV.
We present the results in TableII. Column (1) presents results including a set of basic controls.11 Column (2) adds half-year fixed effects capturing the loan origination date, which allows us to track the evolution of asset misrepre-sentation over time. Column (3) adds controls for the location of the property backing the loan, column (4) adds fixed effects capturing the identity of the underwriter that sold a loan and column (5) standard errors clustered at the state level.
Our results reveal that loans with misreported second liens tend to have higher credit scores, smaller origination balances, and lower reported CLTV ratios. Moreover, these loans are more likely to be fully documented as indi-cated by the negative and significant coefficients for low- and no-documentation status. Consistent with our earlier results (TableI), misrepresentation of sec-ond liens is more common among purchase loans, as evidenced by significant and negative coefficients on refinance dummies. In addition, these loans are less likely to be option adjustable-rate mortgages (ARMs).12 These features broadly depict patterns expected of typical loanswith second liens. This evi-dence also suggests that the lenders originating the first-lien loans may have been aware of the presence of second liens—given that they were more likely
11Throughout the paper we estimate our specifications using OLS despite the binary nature
of several of the dependent variables. Our OLS specification with flexible controls to capture nonlinearity allows us to estimate our coefficients consistently even with multiple fixed effects (Johnston and DiNardo (1997)). As we illustrate in the Internet Appendix, our inferences are very similar using a nonlinear specification (probit) instead.
12See Piskorski and Tchistyi (2010) and Amromin et al. (2011) for a discussion of option
Table II
Second-Lien Misrepresentation across Borrower and Loan Characteristics
This table presents OLS estimates from regressions in which the dependent variable takes a value of one if the loan isMisreported Second Lienand zero otherwise. The controls represent the values reported to investors (the corresponding values in the BlackBox database). Column (2) adds fixed effects corresponding to the loan origination time, with 2005 being the omitted category. Column (3) adds fixed effects corresponding to the location of the property backing the loan. Column (4) adds fixed effects capturing the identity of the underwater that sold a loan. Column (5) reports standard errors clustered at the state level. All estimates are in percentage terms; standard errors are in parentheses. *p<0.10, **p<0.05, and ***p<0.01. Variables are defined in TableI.
(1) (2) (3) (4) (5)
FICO 0.00449*** 0.00523*** 0.00454*** 0.00670*** 0.00670*** (0.000467) (0.000471) (0.000472) (0.000481) (0.00135) Balance −0.00810*** −0.00773*** −0.00751*** −0.00769*** −0.00769***
(0.000123) (0.000124) (0.000131) (0.000131) (0.000783) CLTV −0.163*** −0.161*** −0.165*** −0.161*** −0.161**
(0.00305) (0.00305) (0.00308) (0.00307) (0.0643) No Cash Out Refi −8.202*** −7.990*** −8.176*** −7.827*** −7.827***
(0.0917) (0.0920) (0.0924) (0.0919) (0.713) Cash Out Refi −12.03*** −11.93*** −11.71*** −11.37*** −11.37***
(0.0646) (0.0646) (0.0653) (0.0651) (0.755) Low or no doc. −1.501*** −1.504*** −1.373*** −1.023*** −1.023***
(0.0593) (0.0593) (0.0596) (0.0596) (0.285)
ARM 6.406*** 6.397*** 6.439*** 5.140*** 5.140***
(0.0641) (0.0640) (0.0645) (0.0670) (0.337) Option ARM −2.797*** −2.630*** −2.358*** −1.373*** −1.373
(0.120) (0.125) (0.125) (0.128) (1.114) Originated in 2006H1 2.213*** 2.256*** 2.030*** 2.030***
(0.0745) (0.0744) (0.0764) (0.233) Originated in 2006H2 −0.444*** −0.422*** −0.538*** −0.538* (0.0796) (0.0796) (0.0810) (0.321) Originated in 2007H1 −1.820*** −1.861*** −2.252*** −2.252***
(0.0978) (0.0978) (0.101) (0.418) Originated in 2007H2 −3.993*** −4.028*** −4.048*** −4.048***
(0.262) (0.262) (0.262) (0.406)
State fixed effects No No Yes Yes Yes
Underwriter fixed effects No No No Yes Yes
SEs clustered by state No No No No Yes
Number of loans 854,959 854,959 854,959 854,959 854,959 Percent misrepresented 7.131 7.131 7.131 7.131 7.131
R2 0.0646 0.0668 0.0712 0.0861 0.0861
to collect fully documented information on assets, income, and employment of borrowers when granting the first mortgage—and that information regarding the second lien was indeed misrepresented to investors. We investigate this hypothesis further in SectionV.
effects themselves point to an interesting trend. These coefficients should be interpreted relative to the mean asset misrepresentation in 2005 (the omitted category). Our results show a growing pattern of loans with misrepresented second liens through the boom until about the first half of 2006. Thereafter, the prevalence decreased with time, with small negative fixed effects beginning in the second half of 2006. These time-series patterns are consistent with mod-els in Povel, Singh, and Winton (2007) and Hartman-Glaser (2013), who pre-dict that misrepresentations are most likely to occur in relatively good times and can grow over time. Our findings also suggest that tightening of credit standards just before the collapse of the nonagency market may have led to increased scrutiny.
Overall, misreported second-lien loans have characteristics broadly expected of similar loans with truthful reporting. As we show in the next section, even after accounting for characteristics reported to investors, there are signifi-cant differences in the performance of misrepresented loans relative to similar loans with no misrepresentation. This indicates that reported characteristics of mortgages, including interest rates on mortgages, might not have fully ac-counted for the riskiness induced by misrepresentation. We discuss this issue in Section IV.C.
B. Economic Impact: Second-Lien Misrepresentation and Loan Performance
Having established a significant extent of second-lien misrepresentation, we next investigate whether misrepresented mortgages were of worse credit quality than implied by the disclosed information. To do so we examine the re-lationship between misrepresentations and subsequent defaults on mortgages, accounting for characteristics disclosed to RMBS investors.
Specifically, we estimate a loan-level specification similar to (1) where now the dependent variable is a dummy that takes a value of one if the mortgage goes 90 days past due on payments during the first two years since origination and is zero otherwise. As before, the key explanatory variable, Misreported Second Lien, is a dummy that takes a value of one if loan i misrepresents a second lien and zero otherwise.
Table III
Second-Lien Misrepresentation, Loan Default, and Mortgage Interest Rate
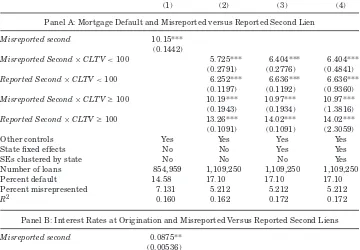
Panel A presents OLS estimates from regressions in which the dependent variable takes a value of one if the mortgage ever defaults (ever goes 90 days past due on payments) in the first two years since origination, and zero otherwise. Panel B presents OLS estimates from regressions in which the dependent variable is the mortgage’s interest rate at origination. Column (1) shows the results withMisreported Second Lienas a control variable. The sample used in these regressions consists of loans that reported to investors no presence of second lines. Columns (2) to (4) show the results when we extend the sample to include loans that reported second liens to investors. These specifications useMisreported Second×CLTVࣙ100,Misreported Second×CLTV<100,Reported Second×CLTVࣙ100, andReported Second×CLTV<100 as control variables, where the excluded category comprises loans that truthfully reported no second liens. TheCLTVterm (computed from credit bureau data) in these interactions takes a value of one if the loan has a CLTV ratio in the appropriate range, and zero otherwise. “Other Controls” include origination variables reported to investors used in Table III such as FICO, interest rates, LTV ratios, and the origination time fixed effects. Squared and cubed terms for FICO and LTV ratios are also included to account for potential nonlinear effects. The estimates are in percentage terms; standard errors are in parentheses. *p<0.10, **p<0.05, and ***p<0.01.
(1) (2) (3) (4)
Panel A: Mortgage Default and Misreported versus Reported Second Lien
Misreported second 10.15*** (0.1442)
Misreported Second×CLTV<100 5.725*** 6.404*** 6.404*** (0.2791) (0.2776) (0.4841)
Reported Second×CLTV<100 6.252*** 6.636*** 6.636*** (0.1197) (0.1192) (0.9360)
Misreported Second×CLTVࣙ100 10.19*** 10.97*** 10.97*** (0.1943) (0.1934) (1.3816)
Reported Second×CLTVࣙ100 13.26*** 14.02*** 14.02*** (0.1091) (0.1091) (2.3059)
Other controls Yes Yes Yes Yes
State fixed effects No No Yes Yes
SEs clustered by state No No No Yes
Number of loans 854,959 1,109,250 1,109,250 1,109,250
Percent default 14.58 17.10 17.10 17.10
Percent misrepresented 7.131 5.212 5.212 5.212
R2 0.160 0.162 0.172 0.172
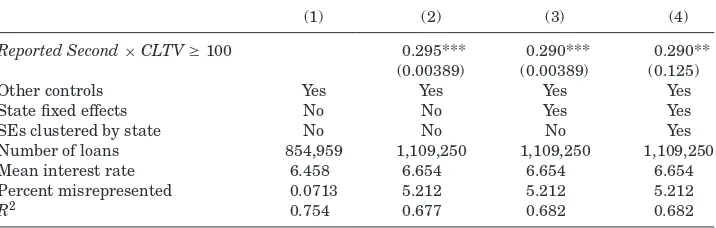
Panel B: Interest Rates at Origination and Misreported Versus Reported Second Liens
Misreported second 0.0875** (0.00536)
Misreported Second×CLTV<100 −0.00237 −0.00358 −0.00358 (0.00988) (0.00994) (0.0325)
Reported Second×CLTV<100 0.121*** 0.124*** 0.124*** (0.00427) (0.00426) (0.0392)
Misreported Second×CLTVࣙ100 0.0956*** 0.0882*** 0.0882 (0.00693) (0.00689) (0.0848)
Table III—Continued
Panel B: Interest Rates at Origination and Misreported Versus Reported Second Liens
(1) (2) (3) (4)
Reported Second×CLTVࣙ100 0.295*** 0.290*** 0.290** (0.00389) (0.00389) (0.125)
Other controls Yes Yes Yes Yes
State fixed effects No No Yes Yes
SEs clustered by state No No No Yes
Number of loans 854,959 1,109,250 1,109,250 1,109,250
Mean interest rate 6.458 6.654 6.654 6.654
Percent misrepresented 0.0713 5.212 5.212 5.212
R2 0.754 0.677 0.682 0.682
So far we show that mortgage defaults on loans with misreported second liens are significantly higher than on similar loans that are truthfully disclosed as not having such liens. We now run another comparison—we compare mortgage defaults on loans with misreported second liens to similar loans with truthful reports on the presence of such liens. To this end we extend our sample to include loans that reported second liens to investors and examine the relation-ship between subsequent delinquency of a loan and whether the loan has a truthfully reported second lien, a misreported second lien, or no second lien.
Given the well-established nonlinearity in the relationship between debt and defaults, we need to not only control for the presence of a misreported second lien but also its size. For loans with a reported second lien, we already know the CLTV. For misreported second liens, we construct the correct CLTV by using the original balance of the first mortgage reported to BlackBox, the second lien balance reported to Equifax, and the original home value. We then consider the differential impact of a higher level of debt on default by constructing four dummy interaction variables: Misreported Second × CLTV > = 100, which takes a value of one if the loan has a misreported second lien and a CLTV greater than or equal to 100, and zero otherwise;Misreported Second×CLTV
<100, which takes the value of one if the loan has a misreported second lien and a CLTV less than 100, and zero otherwise; andReported Second×CLTVࣙ
100 (Reported Second×CLTV<100), which takes a value of one for loans with a truthfully reported second lien and CLTV greater than or equal to (less than) 100. The next three columns in Table III, Panel A repeat the analysis with these four interaction terms as our variables of interest. Relative to the first column, we expand the sample to include loans backed by properties reported as having a second lien. The specifications differ in whether we include state fixed effects (column (3)), and clustering of standard errors at the state level (column (4)).
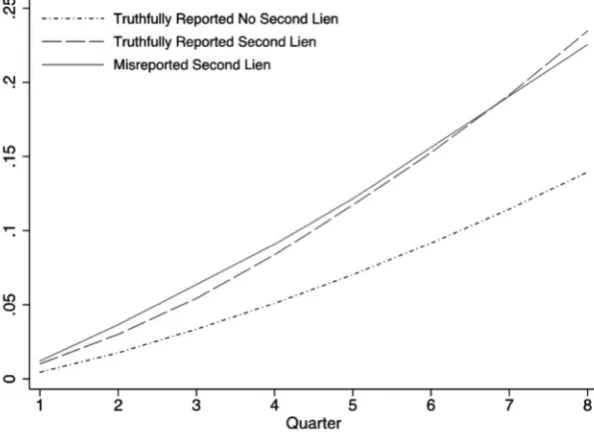
Figure 2. Misrepresentation and loan cumulative default rates.This figure shows the es-timated cumulative default rates in the first two years since origination at the loan level based on second-lien status, holding constant at their overall sample mean all other observables used in TableIIsuch as FICO. They-axis is the cumulative percentage of loans that were 90 days past due at least once.
than or equal to 100. More important for our purpose, we find similar patterns for loans with misrepresented second liens as well. In particular, loans with misrepresented second liens are significantly more likely to default relative to loans with no second liens (i.e., loans that misrepresented loans are pretending to be). This effect is again about twice as large when the CLTV is greater than or equal to 100.
The results reported so far give us a static picture of the nature of subse-quent defaults on misrepresented loans. We now investigate how the impact of misreported second-lien status on default varies over a loan’s lifetime. We use monthly data to estimate the transition probability that a given loan goes 90 days past due on its payments in its first two years since origination. We include a set of fixed effects representing the first eight quarters of a loan’s life, which allows us to estimate the dynamic pattern of defaults. Figure 2
C. Second-Lien Misrepresentation and Mortgage Rates
Above we have shown that, holding all characteristics reported to investors equal, misrepresented loans are more likely to default ex post when compared to similar loans with no misrepresentation. We now investigate whether lenders might have been aware of these misrepresentations and accordingly charged a higher interest rate to compensate for the higher default risk of misrepresented loans.
In TableIII, Panel B, we examine the relationship between misrepresented second liens and mortgage interest rates using a specification similar to equa-tion (1), but now the dependent variable is the mortgage interest rate. The covariates used in the regression include variables known to be related to the risk of the loan, such asFICO,LTV, and whether the loan is an ARM.13Relative to the first column, the last three columns expand the sample to include loans backed by properties reported as having a second lien. The difference across the last three specifications results from whether we also include state fixed effects (column (3)), and cluster standard errors at the state level (column (4)). The results in column (1) show that loans with misreported second liens have interest rates that are only slightly higher than loans with truthfully reported no second liens. Moreover, columns (2) to (4) show that the interest rates on misreported second liens are significantly lower than those that are truthfully disclosed as having a second lien. This holds for both loans with CLTV <100 (12 bps higher for loans with truthfully reported second liens versus almost the same rate as loans with no second liens for misreported loans) and for loans with CLTVࣙ100 (29 bps higher for loans with truthfully reported second liens
versus only nine bps higher for loans with misreported second liens).
Recall from Section IV.B that default rates on loans with misreported second liens are significantly higher than on loans with no such liens, while similar to loans with truthfully reported second liens. Thus, taken together the evidence in Table III and the results in Section IV.B suggest that, though loans with misrepresented second liens had higher interest rates than loans with no sec-ond liens, this interest rate markup was lower relative to loans with similar default risk, that is, loans with correctly reported second liens.14Overall, the evidence suggests that lenders were at least partly aware of the higher risk of misrepresented loans because they charged higher interest rates on these
13The other covariates have the expected signs (e.g., indicators associated with higher risk,
such as low or no documentation, were correlated with higher interest rates). Regardless of the controls and type of specification, the qualitative and quantitative nature of the results reported in the table remains the same.
14To give an alternative perspective on these results, we also analyze the distribution of
loans. This raises the question of where in the securitization process did these misrepresentations occur. We investigate this question next.
V. Where Did Misrepresentations Occur?
The data do not allow us to directly investigate where in the supply chain of credit (i.e., borrower, lender, and/or underwriter) misrepresentations took place. However, results in SectionIVsuggest that lenders were at least partly aware of the higher default risk of misrepresented loans, since they charged higher interest rates on misrepresented loans and these loans were often fully documented. We shed more light on this issue by investigating more directly if lenders were aware of the second-lien misrepresentations.
A. Evidence from New Century Loan Files
We start by using internal bank-level data from one of the largest sub-prime mortgage lenders during the housing boom (New Century Financial). These data are provided by IP Recovery, which, as part of the New Century bankruptcy proceedings, purchased a comprehensive collection of New Century data records. The advantage of this data set is that it contains loan characteris-tics that wereinternally recordedby the lender at loan origination. These data are unlikely to have been manipulated since New Century entered bankruptcy quite quickly at the start of the crisis and this data set was sold during the bankruptcy process by an independent trustee. The data allow us to assess whether New Century was aware of second liens for loans that were misrepre-sented on this dimension to investors.
To conduct this analysis, we merge the subset of New Century data with the BlackBox-Equifax data set. This matching is done using numeric loan identifi-cation numbers, which are identical across the two databases.15TableIV, Panel A displays the reports from this merge. As we observe, more than 93% of New Century loan files that misrepresented second liens to investors have simul-taneous second liens recorded in the bank’s internal database, in other words, New Century was aware of the existence of almostallsecond liens that ended up being misrepresented to RMBS investors as loans with no such liens. To the extent that practices in New Century are representative of other lenders in sub-prime market, these results suggest that lenders were aware that loans were being misrepresented on the dimension of second liens. Of course, though New Century was one of the largest subprime lenders, one might wonder whether these findings generalize. We turn to this question next.
15The matching between the New Century data and the BlackBox-Equifax data set is perfect.
Table IV
Where Did Misrepresentation Occur? Evidence from New Century Loans and the Registry of Deeds
This table examines a sample of internal banking records for New Century and the Los Angeles County deeds records merged with records from the Black Box-Equifax database. The first row of Panel A examines the sample of New Century loans identified as having a misreported second lien and shows the percentage of these loans for which the second lien is correctly reported in the New Century internal data. The second and third rows of Panel A examine a sample of loans originated in L.A. County that misreported second liens to investors and show, respectively, the percentage of these loans that have a second lien reported in the deeds records and the percentage of these loans that have the same lender responsible for the first and second liens. Panel B shows the top three underwriters associated with the main lenders responsible for the misreported second lien loans in L.A. County. These lenders account for around 80% of lending in Los Angeles County. The numbers in parentheses show what percentage of loans of a given lender was sold by a given underwriter.
Panel A: Misrepresentations in the New Century Internal Database and L.A. County Registry of Deeds
Percentage Count
Loans with misreported second lien being reported as having a second lien in New Century data set
93.70% 1,279
Loans with misreported second lien being reported as having a second lien in the L.A. county deeds records
93.70% 2,978
Loan with misreported second lien has the same lender responsible for first and second liens
99.67% 2,978
Panel B: Lenders and Underwriters Associated with Misreported Second Lien Loans in Los Angeles County
Lenders Top 3 Underwriters
Countrywide Countrywide (40.3%); Bear Stearns (8.9%); UBS (8.5%)
WMC Merrill Lynch (51.8%); Bank of America (29.8%); Morgan Stanley (16%) Lehman Brothers Lehman Brothers (98.6%); Merrill Lynch (0.6%); Barclays (0.3%) New Century Lehman Brothers (42.9%); Citigroup (25%); Goldman Sachs (15.2%) First Franklin Lehman Brothers (94.6%); Bear Stearns (1.34%); HSBC (1.34%) MortgageIT Lehman Brothers (84%); Bear Stearns (1.9%); Morgan Stanley (1.9%) DB Home Lending Deutsche Bank (100%)
Peoples Choice Lehman Brothers (100%)
B. Evidence from Deed Records
We next investigative if the findings in the previous section generalize be-yond New Century. To do so, we merge the BlackBox-Equifax data set with the registry of deeds provided by First American.16Deeds records, which are main-tained by the local counties, document information every time a property is sold or a new mortgage is taken out by an owner using the property as collateral. The advantage of the deeds records data is that they include information on all of the loans for a given property that were legally recorded by the lenders as well as the lender’s name for each of these loans. This allows us to investigate whether the lenders were aware of the presence of second liens associated with misrepresented first-lien loans that they originated. We focus on Los Angeles County, the largest county in terms of the number of mortgages in our data.
Table IV, Panel A displays the results from this merge. Consistent with evidence from New Century, more than 93% of loans that we identify as misre-porting second liens have such liens present in the registry of deeds. Of these loans, 99.7% have thesamelender responsible for both liens.
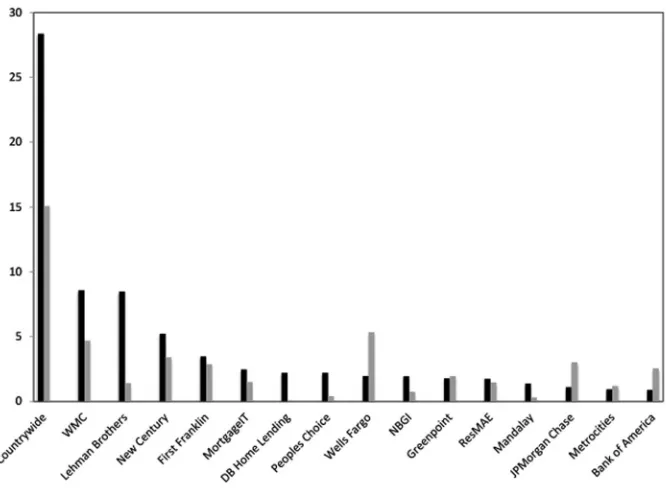
The deeds data also allow us to assess the relative role played by lenders and underwriters in second-lien misrepresentation. Figure3plots the distribution of misreported second-lien loans among the main lenders in Los Angeles County and the corresponding market share of these lenders in the second-lien mort-gage originations in this county. As can be seen, notorious subprime lenders such as Countrywide and New Century not only account for a substantial part of misrepresented second liens, but also have high market shares. For example, loans originated by Countrywide represent about 28% of misreported second-lien loans in our sample, while they account for about 15% of second second-liens in Los Angeles County. Finally, we observe misrepresentations among loans orig-inated by commercial banks such as Wells Fargo, Bank of America, and JP Morgan Chase, though their propensity to originate misrepresented loans is smaller relative to their market share. Thus, Figure3suggests that both the lender and the underwriter may play a role in accounting for the propensity to misreport second liens.
Table IV, Panel B shows the top three underwriters associated with each of the lenders displayed in Figure3. Loans with misreported second liens are associated with a diverse pool of underwriters, including Lehman Brothers, Countrywide, Citigroup, Deutsche Bank, Merrill Lynch, Morgan Stanley, Bank of America, Bear Stearns, and Goldman Sachs. Moreover, most of the dominant originators of misreported second liens are associated with multiple underwrit-ers. For example, New Century loans in our sample were predominantly sold in pools underwritten by Lehman Brothers, Merrill Lynch, and Goldman Sachs. Finally, Figure3and TableIV, Panel B also imply that, for more than 20% of misreported second-lien loans in the Los Angeles County sample, the lender
16The deeds records were restricted to purchase mortgages originated between 2005 and 2007
Figure 3. Second-lien misrepresentation across lenders in the Los Angeles county sam-ple.The black bars present the distribution of misreported second-lien loans (in percent) among main lenders in the sample of misreported second lien loans originated in Los Angeles County. The sample is based on Black Box-Equifax data provided by the credit bureau, merged with Los Angeles County deeds records. The gray bars show the overall distribution of second-lien loans among 16 lenders in the Los Angeles County deeds records during 2005 and 2006.
and the underwriter are thesame institution. This concerns loans originated and sold by Countrywide, Lehman Brothers, JP Morgan, and Bank of America. In such cases, it is hard to argue that these underwriters could not easily have accessed information on second liens that was, as we have shown, available at their own lending arms.
Overall, the evidence in this section confirms that the lenders of the first-lien loans were likely aware of the presence of simultaneous second liens since they themselves originated most of these second-lien loans.17In addition, at least in some cases, the underwriters were likely aware of these misrepresentations since they could have easily accessed such information. Similar inferences, using a different method, are obtained inGriffin and Maturana (forthcoming).
17Our results in Section IV.C indicate that loans with associated misreported second liens have
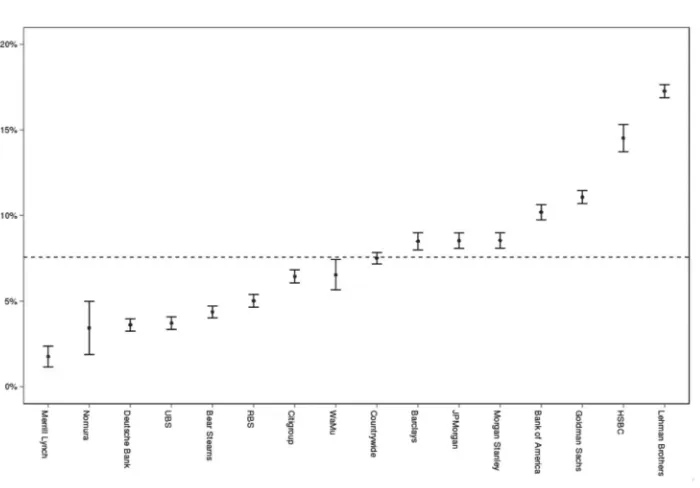
Figure 4. Misrepresentations across underwriters.This figure plots the percentage of loans with misreported second liens by underwriter along with a 95% confidence interval. Coefficients result from adding underwriter fixed effects to the specifications in TableII. These levels are obtained by adding each underwriter fixed effect to the level of misrepresentation for the omitted category (Credit Suisse) with other covariates at their means. The dashed straight line shows the mean misrepresentation level.
C. Heterogeneity across Underwriters
The results in Section V.B suggest that the identity of underwriters is im-portant in accounting for misreporting propensity. We next investigate more systematically the heterogeneity across underwriters in their propensity to sell securities with misrepresented assets. We use specifications as in column (5) of TableIIwithMisreported Second Lienas the dependent variable and with underwriter fixed effects in addition to the control variables. In Figure4, we plot the estimated level of underwriter misrepresentation, calculated using the underwriter fixed effects obtained from this regression and fixing other controls at their means, along with the 95% confidence interval. The omitted category in this figure is Credit Suisse, with 3.37% of loans in pools it underwrote having misreported second liens.
misrepresentation levels. These findings suggest that the identity of the un-derwriter helps account for significant variation in the extent of misrepresen-tation.
Importantly, our analysis also indicates that all underwriters had misrep-resentation levels significantly greater than zero. While it is hard to pinpoint whether underwriters knew about all of the misrepresentations in the pools they underwrote, information to uncover misrepresentations could have been collected—easily in many instances, as we show in Section V.B—by the under-writers during the acquisition and certification of mortgages.
VI. Second Lien Misrepresentation, RMBS Losses, and Pricing
So far we analyze asset misrepresentation at the loan level. We now turn our attention to the impact of second-lien misrepresentations on the RMBS market including the losses suffered by investors who invested in securities backed by such misrepresented collateral.
To perform our pool-level analysis, we restrict our sample to pools with at least 25% of loans for which we can compute whether the loan was misrep-resented. Moreover, we focus on pools for which both FICO and CLTV are nonmissing for at least 95% of included loans and reliable coupon data at is-suance are available in the ABSNet database, which yields a sample of 333 pools containing 669,462 loans. We note that on average 4.3% of loans in a pool have second-lien misrepresentation in this sample. We experiment with the thresholds above and find that our qualitative inferences below are similar.18 For each of the mortgage securities associated with these pools, we collect data from Bloomberg (as of 2014Q1) on their initial subordination levels, cumula-tive losses, subsequent ratings downgrades, and price changes. This allows us to analyze the relation between misrepresentation, losses, and the price of mortgage securities.
A. Second-Lien Misrepresentation and RMBS Losses
We start our analysis by verifying that, consistent with our loan-level re-sults, pools with a larger share of misrepresented loans suffer larger losses. We estimate a series of pool-level regressions in TableV, Panel A of the following form:
Yi =α+βXi+γ×Percent Misreported Secondi+εi. (2)
The dependent variable in the first two columns of the table is the pool’s cumulative loss in percentage terms. The pool cumulative loss data are from Bloomberg and reflect losses up to the first quarter of 2014. The coefficient of interest is onPercent Misreported Second, the percentage of loans in a pool with
18Consistent with our loan-level analysis, misrepresentations of second-lien status are
Table V
Impact on RMBS Market: Second-Lien Misrepresentation, Losses, and Pricing
Panel A presents OLS estimates from regressions in which the dependent variable is (i) the pool’s cumulative loss, defined as the initial balance weighted average cumulative loss of pool tranches (columns (1) and (2)); (ii) the pool’s issuance yield spread in percentage terms (columns (3) and (4)); and (iii) the pool’s AAA subordination level in percentage terms, defined as the lowest subordination level given to a tranche in the pool that received a credit rating of AAA (columns (5) and (6)). Panel B presents OLS estimates from regressions from the sample of 333 pools in which the dependent variable is (i) the pool cumulative loss on tranches with below-AAA initial rating by Standard & Poor’s; (ii) the pool cumulative loss on tranches with below-AAA initial rating by Standard & Poor’s; (ii) the pool cumulative loss on tranches with below-A initial rating by Standard & Poors; (iii) the pool cumulative loss on tranches with AAA initial rating by Standard & Poors; (iv) the ratings downgrades of AAA tranches in notches in the sample of 2,553 tranches (the more negative the number, the larger the downgrade), and (v) the change in the price of AAA tranches in percentage terms in the sample of 1,706 tranches for which Bloomberg reports these data.Percent Misreported Secondis the percentage of loans in the pool identified as having a second-lien misrepresentation.
Reported CLTVis the average reported CLTV of loans in the pool disclosed to investors. Other controls include the pool-level means of origination variables such as the credit score (FICO) of borrowers or the fraction of loans with low documentation, as well as the overcollateralization percentage of the pool. Data on RMBS losses, downgrades, and price changes come from Bloomberg (as of 2014Q1). The results are presented for specifications with and without underwriter fixed effects for the top six underwriters in our sample. Standard errors are in parentheses. *p<0.10, **p<0.05, and ***p<0.01.
Panel A: Pool Level Analysis: Second-Lien Misrepresentation, Losses, and Pricing
Losses Yield spread Subordination level
(1) (2) (3) (4) (5) (6)
Percent misreported 0.284*** 0.246*** 0.00415 0.00344 0.0306 0.0205 Second (0.057) (0.0599) (0.00446) (0.00471) (0.0222) (0.023) Reported CLTV 0.687*** 0.724*** 0.0320*** 0.0323*** 0.158** 0.165***
(0.1394) (0.1428) (0.011) (0.0113) (0.0622) (0.0623)
Underwriter FE No Yes No Yes No Yes
Other controls Yes Yes Yes Yes Yes Yes
Number of pools 333 333 333 333 333 333
Mean 8.922 8.922 0.833 0.833 8.564 8.564
R2 0.515 0.522 0.268 0.274 0.908 0.910
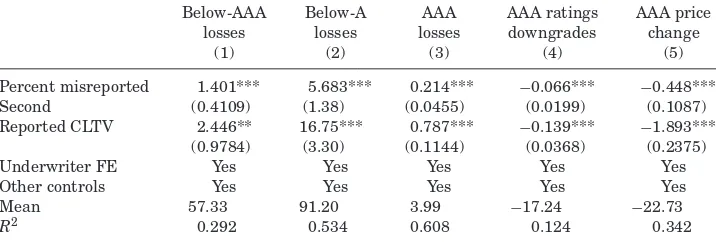
Panel B: Second-Lien Misrepresentation and Losses for Junior and Senior RMBS Tranches
Below-AAA Below-A AAA AAA ratings AAA price losses losses losses downgrades change
(1) (2) (3) (4) (5)
Percent misreported 1.401*** 5.683*** 0.214*** −0.066*** −0.448***
Second (0.4109) (1.38) (0.0455) (0.0199) (0.1087)
Reported CLTV 2.446** 16.75*** 0.787*** −0.139*** −1.893*** (0.9784) (3.30) (0.1144) (0.0368) (0.2375)
Underwriter FE Yes Yes Yes Yes Yes
Other controls Yes Yes Yes Yes Yes
Mean 57.33 91.20 3.99 −17.24 −22.73