The Analysis of Concrete Fracture by the Numerical
Method
The M
ӧ
hr-Coulomb versus the Kupfer-Hilsdorf-Rusch Failure Criteria
Han Ay Lie Civil Engineering Department
Diponegoro University Semarang, Indonesia [email protected]
Sukamta
Structural and Material Laboratory Diponegoro University
Semarang, Indonesia [email protected]
Bobby Rio Indriyantho Master Program in Civil Engineering
Diponegoro University Semarang, Indonesia [email protected]
Abstract—Concrete is a heterogeneous material consisting of aggregates embedded in a cement-sand matrix (mortar). The compression behavior of the aggregate is linear up till failure and the mortar is a brittle-linear material, with a reversible deformation up to its limit, followed by a sudden failure. The resulting concrete demonstrates a quasi-ductile behavior with a progressive decrease in load bearing capacity under incremental monotonic loading. The fracture mechanism of plain concrete on the other hand, is highly influenced by the bond strength in the interface and the tensile strength of the mortar. A Finite Element Model (FEM) was developed for analyzing the fracture characteristic of concrete in flexure. Two failure criteria were evaluated, the Mӧhr-Coulomb envelope and the Kupfer-Hilsdorf-Rusch criteria. The program was validated by experimentally tested specimens, and proven to be accurate. Further, this program served as tool to analyze the fracture response of a range of concrete strengths. This research work was conducted at the Structural and Material Laboratory, Diponegoro University in Semarang, Indonesia.
Keywords-component; fracture, tensile strength, FEM, failure criteria
I. INTRODUCTION
The failure mechanism of concrete is distinguished as either by crushing or cracking, depending on the principal stresses and strains acting on the element under consideration. Crushing occur when both principal stresses are in compression, while cracking or fracture is a tension phenomenon. Two combinations of tension failure are considered, the first when both principal strains are in tension, and the second when the element undergoes a combination of tension and compression strains. The later will, at the end, result in crushing of the material in the direction perpendicular to the principal compression strains.
A failure envelope defines the boundaries at which the concrete is considered to fail. Most failure envelopes are developed based on the results of laboratory tested specimens, and are approach numerically, to construct the boundaries of the envelope. The various formulation for these failure envelope was extensively studied, and resulted in a range of approaches, such as among others; the criteria developed by
von Mises, Mӧhr-Coulomb, Drucker-Prager, Bresler-Pister,
Willam-Warnke and Kupfer-Hilsdorf-Rusch. This study is
based on the criteria of Mӧhr-Coulomb and
Kupfer-Hilsdorf-Rusch.
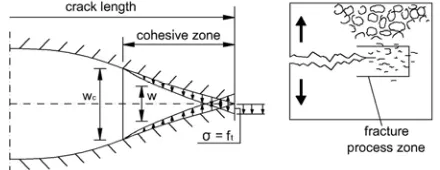
The fracture mechanism of concrete is highly influenced by the bond strength of the interface between the aggregate and mortar, and the tensile strength of the mortar. The determination of its magnitude is based on the measurement of their fracture parameters such as the fracture energy and toughness. Fig. 1 shows the visualization of crack propagation based on the approach of Hillerborget al. [5] and Baźant and Oh[10].
Although it is generally assumed that the stress-strain behavior of plain concrete in tension is linear, as early as in 1968 it was shown that the behavior is highly non-linear, and that a post-peak curve exist. The assumption of linearity is thus incorrect and will lead to a deviation in the outcome of advanced stress analysis in concrete. This study is aimed to construct a mathematical model based on the finite element analysis (FEA) that can generate the stress-strain fracture behavior of plain concrete up till failure. A program written in the Visual Basic (Microsoft VB) language was constructed, generating the load-displacement response of a plain concrete structure under pure bending. This load-displacement response was validated by identical laboratory tested specimens, having the exact same material properties and geometric dimensions.
The test model is a plain concrete beam sized 100 x 176 mm with a length of 1 meter. The beam is loaded longitudinally with a two-point loading system 640 mm apart to ensure a pure bending behavior. The beam was simply supported and supports were located at a distance of 40 mm from the beam end (Fig. 2).
Figure 2. Beam fracture testing at the laboratory
As the developed FEM program was proven to be accurate and correct, it further served as a versatile tool to obtain the concrete fracture versus compression strength relationship (fMR - f'c) for a range of cylindrical compression strengths f'c. The
acquired program was also used to evaluate the exactitude of the both failure criteria under consideration.
II. CONCRETE BEHAVIOR AND THE FAILURE CRITERIA
A. Material Behavior
Since the non-linear FEA is based on the adjustment of the stiffness matrix, the material matrix [C] is up-dated as a function of increasing load. Since tensile behavior is highly sensitive, assuming an isotropic behavior resulted in a substantial divergence from the actual test results. The orthotropic approach therefore offers a more accurate approximation to represent the material under bi-axial stresses. The material constitutive matrix as proposed by Chen and Saleeb [1] was then incorporated into the model. The formulations of which is as following:
(1)
With:
(2)
E1 and E2 are respectively the modulus of elasticity in the
major and minor principal strain direction for a given Gauss point under consideration. This model has the advantage that post peak behavior can be accommodated, since the model facilitates a negative stiffness modulus. This characteristic is particularly useful when the tangent stiffness, rather than the secant stiffness method is accessed. The lower-right-hand term of the matrix represents the shear behavior which is, in lieu of the lack in experimental evident, obtained such that the 1/G factor remains invariant with respect to the rotation of coordinate axes θ. The material matrix [C] is transformed to the global coordinate system for stiffness matrix assembling purpose, using a transformation matrix.
The initial tangent stiffness E0 is calculated from the first
derivative of the material stress-strain diagram in uni-axial compression, for ε =0. At early loading stages the material is considered as isotropic, since E1 = E2 = E0. At advanced loading stages, non-linearity is introduced by the use of a non-linearity index β (Ottosen, [8]). The values for E and υ are expressed as a function of the actual state and level of strain and stress.
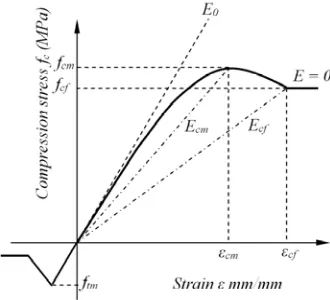
The stress-strain relationship of the material is based on the CEB-FIB 2010 Code [2] for programming purposes (Fig. 3).
Figure 3. Stress - strain constitutive relationship
B. Failure Criteria
In the Kupfer-Hilsdorf-Rusch failure envelope (Fig. 4) crushing will occur in the third quadrant, when all principal stresses are in compression. The first quadrant is fracture due to tension, while the remaining quadrants characterize the tension-compression failure. In this area the principal tensile strain will initiate cracking of the material, and at further stages, the material in compression will undergo a strain increase, terminating in crushing. This approach is adopted by the CEB-FIB 2008 Code [9]. Fracture of a Gauss point under a certain loading increment, will influence the stiffness of its element through the [C] matrix, and a reduction in the structural stiffness matrix will be resulted. Progressive loading will lead to failure of one or more Gauss point up till collapse of the element as a whole.
The compression-tension bi-axial condition is the most sensitive in the analysis. Due to the shape of the failure envelope, cracking in the principal tensile direction is initiated at levels lower than the tensile strength. Cracking of concrete in the principal tensile direction under combined tensile and compression strains, becomes the most prominent failure mode.
Figure 4. Kupfer-Hilsdorf-Rusch failure envelope
Within the limits of the envelope, the assumption that the material behavior is isotropic can still be sustained, especially since stress and strain levels in this region are very low. The isotropic constitutive material model with the initial tangent stiffness modulus E0, therefore gives a good representation to the actual behavior. When cracks start to propagate, this occurs as soon as the bi-axial stress combination exceeds the failure envelope boundaries, the orthotropic model is accessed. The major principal tensile strain ε1 has a positive sign convention,
and the minor principal strain ε2 has a negative sign. The
concrete in the direction of the compression strain can sustain a much higher stress level. When stress levels increase, the compression boundaries will be exceeded, and concrete in the principal compression strain direction starts to fail due to crushing of the material.
Mӧhr-Coulomb failure criterion was formally developed to
explain the brittle fracture of rocks, but was proven to be ultimately suitable to picture the failure boundaries of concrete. Coulomb (1736-1806) found a criterion that forms the boundary for the states of stress at which a given rock under loading is at the verge of failure. More in-depth details can be found in the reference by Fossen [3]. The stresses at this state
are called the critical stresses. Three centuries later Mӧhr introduces the circles in the Mӧhr-space, the Coulomb criterion could now be easily interpreted as a straight line in this space (Fig. 5). The formulation of the Mӧhr-Coulomb failure criteria is written as:
(3)
Figure 5. Mӧhr-Coulomb failure envelope
Where σn and σs are the critical normal and shear stresses
respectively, and ϕis the angle of internal friction.
This study attempts to compare the effectiveness and accuracy of the both failure envelopes in predicting the fracture behavior of concrete. The principal stresses at each loading stages were analyzed based on the two criteria, and the resulting strain levels were used to adjust the material stiffness matrix [C] for the next loading increment.
III. PROGRAMMING AND VALIDATION
A. Non-linear FEM Program
The Non-linear Finite Element program is constructed as a
Main Program and multiple subroutines. The Main Program
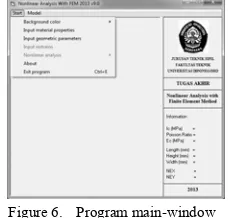
operates the analysis of the displacement due to incremental loading; calculates the stresses and strains at Gauss points, performs the required matrix calculations for the Finite Element analysis, and produces the load-displacement data of the structure, at every convergent loading stage. The program also enables visual displaying of the failed Gauss points (Fig. 6).
Figure 6. Program main-window
parameters and boundary conditions and shear deformation, and the subroutine for the non-linear arc-length iterations. The program accommodates various options and is design in standard Visual Basic Window format.
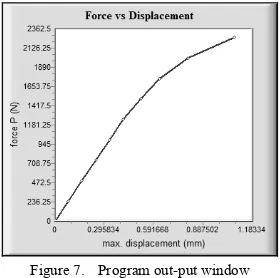
The load-displacement response is presented graphically (Fig. 7) and can be exported to spreadsheet format.
Figure 7. Program out-put window
The basic isoparametric quadrilateral element, having two by two Gauss points, was chosen. Upon reaching failure of any particular Gauss point, the material stiffness matrix [C] for this point is set to a very small value, approaching zero. However, the corresponding nodes of this element remain in the structural matrix, since the other surrounding Gauss points will contribute to the stiffness matrix of that specific element. Upon loading increase, the number of failed Gauss points will accumulate. The operation of the structural stiffness matrix, however, will still be operable due to the assignment of a very small value for the stiffness modulus at failure, to ensure a non-zero determinant (Han and Purnomo, [4]). The model is constructed two-dimensional.
The failed Gauss point propagation will give a picture of the element state, when loading progresses. When all four Gauss point within a particular element exceeded the failure envelope, the element has failed. This element will physically leave a gap in the structure. The subroutine memorizes the Gauss points that failed and send an indicator to the Main
Program. With finer meshing, the failure progress of Gauss
points and elements can be observed closely. To produce a smooth load-displacement curve, the load increments should be adjusted to the current stiffness of the structure.
B. Experimental Testing
The compression behavior of the concrete was obtained from cylindrical specimens size 150 x 300 mm in accordance to ASTM C469 / C469M - 10 Standard Test Method for Static Modulus of Elasticity and Poisson's Ratio of Concrete in
Compression. All specimens were casted and vibrated to
obtain a good compression density. The specimens were de-molded after 24 hours and submerged in water to cure. The cylinders were tested at the age of 28 days.
To measure the Poisson’s Ratio of concrete, cross plane lead wire - integrated polyester resin-backing, type PLC-60-11
strain gauges with a length and width of 60 by 1 mm were used. The gauge has a backing length and width of 74 mm and
a resistance of 120 Ω. The two gauges were placed perpendicular to each other at the centre of the specimen.
The modulus of elasticity was measured using a load cell type CLC-500 kNA with a capacity of 500 kN and a sensitivity of 1.5mv/v and three LVDT’s type CDP-25M having a rated output of 10000x10-6 strain and a sensitivity of 2000x10-6 strain/mm. All strain gauges, LVDT’s and the load cell were connected to the data logger type TDS-303. Incremental load and displacements were measured using the TDS-7130
software. All measuring equipments are products of Tokyo
Sokki Kenkyujo, Japan.
The stress–strain behavior of specimens was recorded by
the Hung Ta, HT-8391PC Computer-Controlled Servo
Hydraulic compression apparatus with a capacity of 2000 kN.
To diminish the restraining effect between the compression apparatus loading plates and the specimens, a double layer of
100 μm Teflon (PFTE or polytetrafluorethylene) separated
with a layer of bearing greased, was placed on the top and bottom of the cylinders. The loading rate was set to 0.25 MPa/s in accordance to ASTM 339/ C 39M-05. The strain response of the Teflon sheets were measured separately, and used to correct the strain response of concrete specimens.
The test specimens for validating purpose, were constructed to compare the load-displacement curves obtained from these specimens, to the FEM results. These specimens are identical to the structural model in the finite element analysis. The mold was constructed from teak wood (jati) and made leak proof using a sealant at the seams. Further, the cast was covered with a thin layer of bearing grease to ensure waterproofing and to prevent the concrete from attaching to the mold. The specimens were taken out of the mold after 24 hours, and cured by submerging in water.
Before testing, the specimens were dried and leveled to obtain a smooth, flat and leveled surface using a spirit/bubble
level. The load – displacement response was recorded by the
Hung Ta, HT-8391PC Computer-Controlled Servo Hydraulic
compression apparatus (Fig. 8). Two identical specimens A1 and A2 were prepared and tested in accordance to ASTM C78-02. The material properties and dimensions and boundary conditions were used as input for the FEM.
C. Validation
The developed FEM Program is validated to ensure its accuracy and correctness. Whenever possible, the subroutine programs are validated indirectly by evaluation of the results to the outcome of spreadsheet calculation. This technique was made possible since the algorithms for the material are mathematically straight forward and can be hand-calculated with the help of spreadsheets. The subroutines were proven to be accurate even to the tenth digit. However, due to its complexity, direct calculation of stresses and strains at Gauss point were not only time consuming but also very difficult. Therefore, the comparison technique to validate the Main
Program is chosen. For this purpose, load-displacement curves
generated by the FEM program with identical structural dimension and material properties are compared to their laboratory experimental specimens. The validation process is conducted in stages, to avoid accumulation of errors in the algorithms and programming (Indriyanto and Pamungkas, [6]).
Fig. 9a and 9b show the proposed FE model, and its complimentary tested specimen. The tested concrete has a cylindrical compressive strength of 38 MPa.
Figure 9. Validation specimen and FE model
The load-displacement curves produced by the FEM program using the two different failure criteria are compared to the experimental data, the result of which can be seen in Fig. 10.
Figure 10. Load-displacement response in fracture
The recorded data from the experimental beams A1 and A2 are scattered in the close vicinity of the load-displacement curves generated by the program. It is shown that the developed program can accurately predict the fracture response of plain concrete. The experimental data are closely approached by the response as predicted by the model. It is also demonstrated that the Mӧhr-Coulomb and the
Kupfer-Hilsdorf-Rusch failure envelopes yield in an identical curves. This
proved that both the criteria are highly suitable to model the fracture behavior of concrete.
Since the program can also trace the crack propagation of nodes, the cracking pattern predicted by the FEM was compared to the resulting crack formation of the laboratory tested beams. It was found that cracking started at the most extreme fibers in tension, and procreated along a line perpendicular to the principal tensile stresses (Fig. 11).
Figure 11. Cracking propagation comparisson
IV. FRACTURE STRENGTH
The FE program was further utilized to analyze the modulus of rupture (fMR) as a function of the cylindrical
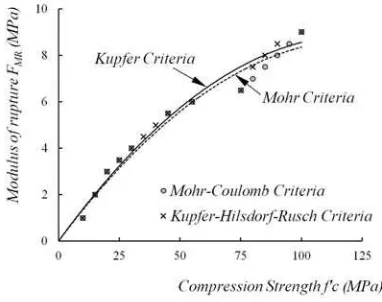
compression strength (f'c). For this purpose the program was run for a set of compression concrete strengths ranging from 20 MPa to 100 MPa. The ultimate load obtained by the program was converted to the modulus of rupture by simple mechanical analysis, and the data recorded (Fig. 12).
Figure 12. Modulus of rupture fMRrelationship to f’c
It can be seen that the modulus of rupture increases as a function of the concrete compression strength. The relationship is closely represented by quadratic function to the
a. FE beam under incremental loading
second degree. It is interesting to see, however, that for higher strength concretes, the Kupfer-Hilsdorf-Rusch failure envelope predicts a slightly higher value, when compared to the Mӧ
hr-Coulomb failure criteria. The reason for this could be
originated from the fact that the Kupfer-Hilsdorf-Rusch
envelope accommodates the confinement under bi-axial compression up till a 20%. For high strength concrete, this could substantially increase the point at which the beam starts to fail, since the beam part in compression itself will provide additional confinement to the structure.
Evaluating the program, it can be seen that the post-peak of the load-displacement curve was not constructed. This is caused due to the use of a uniform load increment, leading to a less accurate outcome of the ultimate load. Reaching the ultimate point, the increment should be refined as a function of the deceasing structural stiffness, and additional algorithms to construct the post-peak behavior, should be implemented. However, the work conducted at The Structural and Material
Laboratory of The Diponegoro University, in Semarang
resulted in a sophisticated tool that can be expanded and will serve as a useful instrument for predicting the fracture behavior of concrete.
V. REFERENCES
[1] Chen, W. F. and Saleeb, A. F., “Constitutive equations for engineering material, Vol. 1: Elasticity and modeling”, 1982, John Wiley and Sons, IBN 0-471-09149-9, in press.
[2] FIB Bulletin Nr. 55 and 56, 2010, “Model Code 2010”, First Complete Draft, Vol. 1 and 2, ISBN 978-2-88394-095-3/6, Federal Institute of Technology, Lausanne, Switzerland, in press.
[3] Fossen, H., "Structural geology", 2010, Cambridge University Press, ISBN 978-0-521-51664-8, in press.
[4] Han, A. L. and Purnomo, J., “Finite element modeling incorporating non-linearity of material behavior based on the FIB Model Code 2010”, 2011, 1st
Indonesia Structural Engineering and Material Symposium (ISEMS), Department of Civil Engineering, Parahyangan Catholic University, Bandung, Indonesia. In press.
[5] Hillerborg, A., Modéer, M. and Petersson, P. E., “Analysis of crack formation and crack growth in concrete by means of fracture mechanics znd finite elements”, Cement and Concrete Research, 1976, Vol. 6, No. 6, pp. 773-782., in press
[6] Indriyantho, B. R. and Pamungkas, A. S., "Study of rupture behavior by numerical simulation", Thesis, 2013, Civil Engineering Department, Diponegoro University, Semarang-Indonesia, unpublished.
[7] Kupfer, H., Hilsdorf, H. K. and Rusch, H., “Behavior of concrete under biaxial stresses”, American Concrete Institute Journal Proceedings, Vol. 66, No. 8, August 1969, pp. 656-666 in press.
[8] Ottosen, N. S., “Constitutive model for short-time loading of concrete”, ASCE Journal of the Engineering Mechanics Division, 1979, Vol. 105, No. EM1, pp. 127-141, in press.
[9] Task Group 8.2, CEB-FIB, State-of-art report on “Constitutive modelling of high strength/high performance concrete”, 2008, International Federation for Structural Concrete, Switzerland, in press. [10] Bazant, Z. P. and Oh, B. H., " Deformation of progressively cracking
reinforced concrete beams", ACI Journal Proceedings, 1984, Vol. 81, No. 3, pp. 268-278, in press.
.