www.elsevier.comrlocateratmos
Comparative measurements of the atmospheric
electric space charge density made with the
filtration and Faraday cage techniques
S.D. Pawar
), A.K. Kamra
Indian Institute of Tropical Meteorology, Pune 411008, IndiaReceived 6 September 1998; accepted 10 January 2000
Abstract
Close-to-ground measurements of the atmospheric space charge density simultaneously made with the direct filtration and Faraday cage techniques are reported. The data obtained on fair-weather days show that the measured values from the two techniques are small and agree with each other within the limits of experimental error during windy and turbulent conditions in the afternoon hours, but are large and vastly different, both in magnitude and polarity, during the calm and stable conditions at nighttime. The disagreement between the data obtained from the two techniques is explained due to the nonfulfillment of the requirement of maintenance of the entire Faraday cage in a region of uniform space charge density. It is concluded that the selection of a measuring technique for space charge in a study should be based on the requirements of the problem to be studied.q2000 Elsevier Science B.V. All rights reserved.
Keywords: Atmospheric electric space charge density; Filtration; Faraday cage
1. Introduction
Two different techniques available for the measurement of the atmospheric space
Ž .
charge density are the direct filtration technique first used by Obolensky 1926 and
Ž . Ž .
subsequently developed by Vonnegut and Moore 1958 , Moore et al. 1961 and Bent
Ž1964 and the Faraday cage technique used by Vonnegut and Moore 1958 . In the. Ž .
filtration technique, a known volume of air is sucked through an absolute filter and the net charge in it is collected and measured. In the Faraday cage technique, the potential
)Corresponding author. Tel.:q91-5893600; fax:q91-5893825.
0169-8095r00r$ - see front matterq2000 Elsevier Science B.V. All rights reserved. Ž .
inside a cage is measured and then related to the charge density by Poisson’s equation. Both techniques have some advantages and inherent sources of error. The filter apparatus, though simple and portable, requires an independent verification by passing a
Ž .
volume of air with known space charge density through it, as done by Bent 1964 to demonstrate the validity of measurements. This technique cannot be used under the rain
Ž .
and fog conditions. Further, as pointed out by Anderson and Bailey 1991 , a filter apparatus placed at a height above the ground is likely to have some error due to non-equalization of potentials at its intake with respect to the surrounding. On the other hand, the Faraday cage technique can be used in the rain and fog conditions. However, it suffers because of the possible modification of the space charge conditions inside the cage due to ions produced by the water dropper or radioactive collector when they are used as the potential measuring devices. Even when used with passive techniques to measure the electrostatic potential at the center of the cage, it has the unknown effect of the measuring system upon the cage geometry. Also, the diffusion of ions to the wire-mesh sides of the cage is another source of error in the Faraday cage technique
ŽAnderson, 1966 . Another factor that can cause error in the measurement of space.
charge in both techniques is the presence of large metal cage or filter apparatus when these are installed above the ground. These structures distort the local atmospheric electric field which creates a layer of charge at the upper surface of the apparatus during the periods of low winds. As a result, each apparatus may have different charge populations to measure, especially during the night-time periods with stable air and low winds. No attempt was made in our measurements to correct for these sources of error. The third method for measurement of space charge near the ground is by measuring
Ž .
the electric field profile either with a double field mill device Gathman, 1968 or with a
Ž .
tethered balloon mounted field meter Gathman, 1972 . The divergence of electric field between two levels gives a measure of the total space charge that is present between the two levels. So, similar to the Faraday cage technique, to infer the space charge density at a particular height between the two levels of measurements, one has to assume that the total space charge is uniformly distributed between the two levels of measurement.
Ž .
Anderson 1966 measured the atmospheric space charge density simultaneously with the filtration and Faraday cage techniques and found that the data from the two instruments agree within the limits of experimental error. However, reliable data for good agreement between the two techniques could be observed only on three occasions of less than 2-h duration in his measurements from several attempts in daytime. As
Ž .
pointed out by Anderson 1966 , one reason for the disagreement between the data observed on other occasions may be the nonfulfillment of the assumption of the entire cage being located in a region of uniform space charge density. It is necessary to make this assumption for a valid calculation of space charge density from a measurement of
Ž .
potential in the Faraday cage technique. In comparing the two techniques, Reiter 1994 also points out that in case of Faraday cage technique, it must be presumed that the cage is uniformly filled with charged particles.
measurements of atmospheric electric field, conductivity, dry and wet-bulb temperatures and wind speed and direction are also made. The data have been used to compare the values of space charge density obtained by the two techniques under different meteoro-logical conditions.
2. Instrumentation
A cubical Faraday cage of 3.6 m side is erected at the Atmospheric Electricity
Ž X X
.
Observatory at Pune 18832 N, 73851 E, 559 m above sea level , India, using a galvanised iron wire mesh having 5 meshes per centimeter and made of 0.5 mm thick
Ž . Ž . Ž .
wire and angle iron Fig. 1 . Earlier, Vonnegut and Moore 1958 and Anderson 1966 have used such a wire mesh to construct Faraday cages for their measurements. Any loss of ions entering the cage by attachment at the screen will be discussed in the next section. The cage has a small screened access door on one of its side. All sides of the cage are interconnected and earthed. A small a.c. field-mill using a 92 W motor operating at 4000 rpm is fabricated and suspended in the center of the cage with a 3.2 cm diameter iron pipe through the top of the cage. The field-mill measures the potential
Ž
created at the center of the cage by the space charge inside the cage Vonnegut and
.
Moore, 1958 . The mechanical design and the electronics used to process the signal of field-mill is carefully designed to achieve a sensitivity of 0.2 Vrm and is found to be stable even after a continuous operation of several hours. Various factors, such as a large
2.
effective aera"201 cm of the sensing stators, using a high speed motor to drive the rotors, grounding the shaft of the motor through a carbon brush, using the electronic components with low temperature drift and sharply tuned amplifiers, combine to give the desired sensitivity, resolution and stability of the field-mill. The field-mill can sense a field of 0.2 Vrm and has low noise-to-signal ratio. The zero-shift is observed to be less than 0.3 Vrm even after continuous operation of several hours. Potential, V , at thec
Ž
center of a cubical cage is related to space charge density by Vonnegut and Moore,
.
1958; Vonnegut et al., 1961
Ns780Vcrl2
Ž .
1where N is the space charge density in elementary chargesrcm3 and l is the length of the side of cage in meters. Therefore, a potential of 0.2 V at the center of the cage
3 Ž 3.
corresponds to 12 elementary chargesrcm 1.92 pCrm .
To ensure that the wire-mesh used to construct Faraday cage is fine enough to adequately shield the volume of the air inside the cage from the outside electric fields, the variations in electric field observed inside the cage are compared to those observed outside the cage measured with another field-mill kept flush with the ground and located 20 m away from the cage. These observations show that the two fields are not directly correlated, thus confirming that Faraday cage provides adequate shielding to the field mill suspended inside it from the outside electric field and that it measures the potential created only by the space charge inside the cage.
Ž .
Two identical filter apparatuses similar to that of Moore et al. 1961 , each enclosing a 10=10=15 cm absolute filter and a steelwool pre-filter in a shielding but insulated galvanised iron tube, as shown in Fig. 2, are fabricated. An absolute filter is a glass-wool filter with fibers ranging from 0.5 to 3 mm in diameter. All-glass filter
medium is formed into closely pleated package with aluminium separators in a metallic frame. The filter used in our apparatus has a collection efficiency of greater than 99.9% for 3 mm particles. Each tube has a Teflon cone that insulates the electrostatic shield from the filter and prefilter assembly and extends to about 1 cm at its intake. Each tube
Ž .
also has a separate high-impedance amplifier AD 311K fitted outside the tube. The air intake constructed of Teflon avoids generation of point discharge under conditions of
Ž .
high electric field Moore et al., 1961 . It also serves the purpose of reducing the area of intake and thus reduces the non-uniformity of the rate of suction of air due to gustiness
Ž .
of the wind Bent, 1961 . Signal from the filter is fed to the amplifier. Air through each filter apparatus is drawn at a rate of 2 lrs with a separate blower. Flow-rate is measured with a rotameter. The combination of the use of Teflon ring at the intake, providing more effective shielding of the filter from outside electrical effects by making the tube inlet narrow, using a carbon coated Teflon coaxial cable for input connections, using the minimum length of this cable by mounting the amplifier on the tube itself, using the
Ž .
operational amplifiers with low temperature drift 10 mVr8C helps to achieve the desired accuracy and stability of the apparatus. Each apparatus is found to sense a space
3 Ž 3.
charge density of 16 elementary chargesrcm 2.56 pCrm and is found to have low noise-to-signal ratio. The zero-shift is found to be less than 4 pCrm3even after several hours of continuous operation.
To check the identity of the two filter apparatus, both are first kept at 1-m height with their intakes close to each other. The flowrate through each apparatus is adjusted to be equal to 2 lrs and the gains of the amplifiers in both apparatus are adjusted to be the same. The outputs of the two apparatus are observed to be within 4% of each other with such arrangements.
The two filter apparatuses are placed — one at 0.1 m and other at 1 m above the ground — at a distance of 14 m from the Faraday cage. Outputs of both filter apparatuses and the field-mill are fed to a data-logger which recorded 1-min average values. All the three instruments are run continuously for several weeks. Zero-shifts in all three sets of apparatus are checked by switching off the power to the blowerrmotor and is corrected at least thrice daily. As the time at which the zero-shift first appears is not exactly known, the data for the periods when zero-shift in any apparatus is found to be appreciable, are not considered.
Simultaneous measurements are also made of the atmospheric electric field with an a.c. field-mill kept flush with the ground in a pit 20 m away from Faraday cage and the electric conductivity of both polarities with two Gerdien’s condensers kept 1 m above the ground close to the two filter apparatus. Outputs of these apparatuses are also fed to the same data-logger.
Atmospheric temperatures and wind speed and direction are recorded with a weather monitor installed 50 m away from the Faraday cage.
3. Results
Measurements are made on about 50 days during December 1995 to February 1996 and on some days during the same period in 1993 and 1994. Typical diurnal variations of the space charge density and electric field observed on 3 days during this period are presented below. Trends of diurnal variations of these parameters on other days during winter season are generally observed to be similar except under some windy conditions at nighttime.
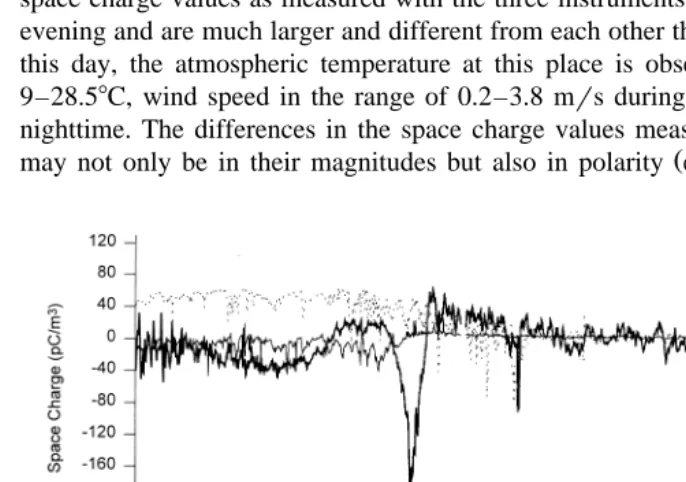
Fig. 3 shows typical diurnal variations of the atmospheric electric field and space charge densities as measured by the two filter apparatuses and Faraday cage on 14 January 1996. It also shows diurnal variation of the wind speed drawn from its half-hourly instantaneous values. In the afternoon hours, the space charge density measured by all the three instruments show fluctuating and small positive values that are generally within 4 pCrm3 of each other and are less than 8 pCrm3. Quite often, as
Ž .
observed by Anderson 1966 in his data during the afternoon hours, our data from all the three instruments agree with each other within the limits of experimental error. The space charge values as measured with the three instruments dramatically increase in the evening and are much larger and different from each other throughout the night time. On this day, the atmospheric temperature at this place is observed to be in the range of 9–28.58C, wind speed in the range of 0.2–3.8 mrs during daytime and -0.2 mrs at nighttime. The differences in the space charge values measured with three apparatuses
Ž .
may not only be in their magnitudes but also in polarity e.g. see Figs. 4 and 5 . The
space charge values measured with both the filters decrease more steeply with height towards the evening and attain much larger magnitudes, frequently by more than an order of magnitude, at nighttime. The space charge density observed even by the two filter apparatuses may differ from each other both in magnitude and polarity. Quite often, as on this particular day, the space charge density measured with a filter apparatus does not show any change in polarity during nighttime. On the contrary, the nighttime space charge values as measured on this day by Faraday cage are comparatively smaller and undergo large amplitude fluctuations and frequently change polarities. The spikes of negative space charge sometimes observed in Faraday cage technique in calm conditions at night are most likely due to the diffusion of positive ions to the screens of cage under
Ž .
fair weather electric field. Anderson 1966 has shown that the loss of ions to the screens may be as much as 14% or 22% when the wind speeds are 0.1 or 0.05 mrs, respectively. Our instruments can measure wind speeds )0.2 mrs only and only instantaneous values at 3-h interval are recorded. However, small movements of air close to the cage walls may be enough to keep the error caused by diffusion of ions to the cage walls to a reasonably low level. Therefore, the Faraday cage values of space charge averaged over a few minutes may not be much influenced by this source of error. In the morning, the space charge values measured by the filter apparatus steeply
decrease and give a negative peak before settling to normal daytime small values. The negative peak in the morning is particularly very large in case of the filter apparatus at 0.1 m height. Large values of space charge density as measured by the filter apparatus have been observed at nighttime almost throughout the winter season from November to February, when the stability of the lower atmosphere is good, nocturnal inversions are
Ž .
very low and winds are generally calm. Earlier, Kamra 1982 and Deshpande and
Ž .
Kamra 1992 have discussed the space charge distributions in the lowest 2 m of the atmosphere at this station.
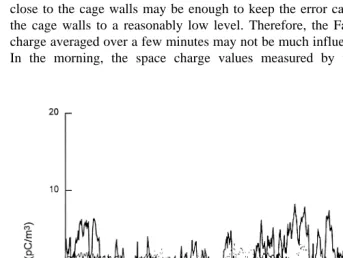
Variations in atmospheric electric field and space charge density in Figs. 3–5 do not show any consistent parallel trend. However, space charge density at these levels undergoes large variations at the time of the morning maximum in electric field. Also, the magnitude of electric field is comparatively very low when very large negative space
Ž .
charge persists close to ground at nighttime e.g. see Fig. 4 . Conductivity at this station
Ž y1 3 .
shows very large values )4=10 Srm at nighttime. Unfortunately, these high values saturated the range of our conductivity apparatus throughout the nighttime. Daytime values of conductivity showed normal values -2=10y1 4 Srm.
The agreement between the three space charge records during daytime exists even for shorter time scales. For example, Fig. 6 shows a record of the space charge density as measured by the three instruments when observations are taken at the rate of 10 samples per second and averaged for each second in the afternoon of January 23, 1996 when the atmosphere is well mixed and winds are moderate. The three values are comparable to each other within the range of experimental error of the instruments.
4. Discussion
The stability conditions of the lower atmosphere at this place are grossly different between the daytime and nighttime periods throughout the winter months. Measurements
Ž .
of Shaha and Ananthakrishnan 1976 , made earlier at Pune, show that the lapse rate reversals occuring almost regularly in the morning and evening hours in this season clearly show the changeover from the stable to unstable atmosphere in the morning hours and from the unstable to stable atmosphere in the evening hours. So, here we will limit our discussion only to the differences observed in the vertical space charge distributions between the daytime and nightime observations during winter months. No attempt will be made to interpret the space charge fluctuations of shorter periods, say on the time-scales of seconds or minutes or to assess the vertical fluxes and the accumula-tion of space charge in the surface layer. Simultaneous micro-meteorological measure-ments of the atmosphere stability need be used for such studies.
variations parallel to that of the electric field. Secondly, the magnitude of the electric field in calm conditions at nighttime when the error due to this factor should maximize are relatively low and the differences in the measured space charge values by different techniques are large. On the contrary, there is a very small difference in the space charge values when the electric field is the maximum at the time of the morning maxima. Lastly, while the polarity of the fair weather field is always negative, the polarity of the measured space charges with the two techniques can be of either polarity. Therefore, the error caused due to this factor is not likely to significantly affect our results.
The accumulations of radioactive emanations from the ground and aerosol particles below inversions at nighttime cause large gradients of conductivity and space charge
Ž
close to the Earth’s surface e.g. Crozier, 1963; Hoppel and Gathman, 1971; Willett,
. Ž .
1978; Kamra, 1982 . For example, in low wind conditions, Crozier’s 1965 measure-ments of the electric field and space charge density profiles show the presence of positive space charge, sometimes as high as 750 pCrm3close to the Earth’s surface due
to electrode effect. Above this layer of positive space charge, Crozier’s observations show also a layer of negative space charge. Manifestation of this layer of negative space charge is known as the reverse electrode effect. These high values of space charge density and the reverse electrode effect under low wind conditions have been attributed to the increased ionisation due to the accumulation of radioactive gases and their decay products in the shallow layer close to the Earth’s surface. The theoretical calculations of
Ž . Ž .
Hoppel 1969 using the observed ionisation profile of Crozier and Biles 1966 , also show that the reverse electrode effect is observed under nonturbulent conditions if the layer of high ionization is present near to the Earth’s surface. It has been estimated that the lower positive space charge layer may be confined to only about 1–2 m above the ground in the nighttime low wind conditions as is clearly shown in the first 4 h of data in Fig. 4. Above this positive space charge layer the negative space charge layer under the reverse electrode effect may prevail in many tens of meters in height. Turbulent conditions during daytime increase the mixing in the atmosphere and the two layers of positive and negative space charges mix-up and almost disappear to produce very low values of the net space charge density in that region.
Our measurements confirm the existence of such vastly different values of space charge under turbulent and nonturbulent conditions and also at different vertical levels in the stable and stratified atmosphere at nighttime. Elsewhere, we plan to discuss the vertical charge distribution and its dependence on the stability of the lower atmosphere. Here, it will suffice to say that at this location large vertical gradients of space charge density exist near the earth’s surface at nighttime. Under such conditions, therefore, the selection of the technique adopted to measure the space charge density becomes crucial for studying its vertical distribution near the Earth’s surface.
apparatus. On the other hand, the Faraday cage technique gives a measurement of the averaged value of space charge in a volume of the air enclosed inside the cage. In our measurements, this volume extends to a height of 3.6 m in the vertical. Within this height, our nighttime observations in stable atmosphere show large variations in space charge density both in its magnitude and polarity. In such a situation the cage is not uniformly filled with charged particles and the assumption to maintain the entire cage in a region of uniform charge density to obtain a valid measurement of space charge density from the Faraday cage technique, cannot be fulfilled.
There is a third method for measurement of space charge near the ground by
Ž
measuring the electric field profile either with a double field mill device Gathman,
. Ž .
1968 or with a tethered balloon mounted field meter Gathman, 1972 . The divergence of electric field between two levels gives a measure of the total space charge that is present between the two levels. So, similar to the Faraday cage technique, to infer the space charge density at a particular height between the two levels of measurements, one has to assume that the total space charge is uniformly distributed between the two levels of measurement.
5. Conclusions
In spite of the accurate measurements by the two measuring techniques, the close-to-ground measurements of the space charge density made with a filter apparatus and Faraday cage may be vastly different from each other due to the basic difference in the principles of measurement of the two techniques and the prevailing meteorological conditions. Measurements made by the two techniques are identical in unstable and well mixed lower atmosphere, but drastically differ in a stable atmosphere. At this location, such stable meteorological conditions prevail almost for the whole night during 4–5 months in a year. Consequently, the daytime and nighttime space charge values measured by the two techniques drastically differ from each other during this period. Therefore, both the experimental technique and the prevailing meteorological conditions under which the measurements of space charge are made, need be described in detail while reporting the results of any study of space charge distribution. Furthermore, the experimental technique selected to measure the space charge density in a particular study should be decided on the basis of the requirements of the problem to be studied.
References
Anderson, R.V., 1966. Absolute measurement of atmospheric charge density. J. Geophys. Res. 71, 5809–5814. Anderson, R.V., Bailey, J.C., 1991. Errors in the Gerdien measurement of atmospheric electric conductivity.
Meteorol. Atmos. Phys. 46, 101–112.
Bent, R.B., 1964. The testing of apparatus for ground fair weather space charge measurement. J. Atmos. Terr. Phys. 26, 313–318.
Crozier, W.D., 1963. Electrode effect during neighttime low wind period. J. Geophys. Res. 68, 3451–3458. Crozier, W.D., 1965. Atmospheric electrical profile below three meters. J. Geophys. Res. 70, 2785–2792.
Ž .
Deshpande, C.G., Kamra, A.K., 1992. Short time variations in the atmospheric electrical parameters. J. Atmos. Terr. Phys. 54, 1413–1420.
Gathman, S., 1968. Guarded double field meter. Rev. Sci. Instrum. 39, 43–47.
Gathman, S., 1972. A field mill for tethered balloons. Rev. Sci. Instrum. 43, 1751–1754.
Ž .
Hoppel, W.A., 1969. In: Coroniti, S., Hughes, J. Eds. , Electrode effect: comparison of theory and measurement, Planetory electrodynamics Vol. 2 Gordan Breach, NY.
Hoppel, W.A., Gathman, S.G., 1971. Determination of eddy diffusion coefficients from atmospheric electrical measurements. J. Geophys. Res. 76, 1467–1477.
Kamra, A.K., 1982. Fair weather space charge distribution in the lowest two meters of the atmosphere. J. Geophys. Res. 87, 4257–4263.
Moore, C.B., Vonnegut, B., Mallahan, F.J., 1961. Air-borne filters for measurement of atmospheric space charge. J. Geophys. Res. 66, 3219–3226.
Obolensky, W., 1926. Uber elektrische Ladungen in der Atmosphare. Ann. Phys., 644–666.
Reiter, R., 1994. Charge on particles of different size from bubbles of Mediterranean sea surface and from
Ž .
waterfalls. J. Geophys. Res. 99 10 , 807–10812.
Shaha, S.K., Ananthakrishnan, R., 1976. Diurnal and seasonal variation of the thermal stability of the atmosphere close to the surface at Poona in relation to air pollution. Indian J. Meteorol. Hydrol. Geophys. 27, 333–334.
Vonnegut, B., and Moore, C.B., 1958. A study of techniques for measuring the concentration of space charge in the lower atmosphere. Final Report Air Force Cambridge Res. Lab. Bedford, Mass.
Vonnegut, B., Moore, C.B., Harris, C.K., 1961. Agrimeter for measurement of atmospheric electrical potential gradient. J. Geophys. Res. 18, 812–815.