GEOMETRIC FEATURES AND THEIR RELEVANCE FOR 3D POINT CLOUD
CLASSIFICATION
Ma. Weinmanna, B. Jutzia, C. Malletb, Mi. Weinmannc
a
Institute of Photogrammetry and Remote Sensing, Karlsruhe Institute of Technology (KIT), Englerstr. 7, D-76131 Karlsruhe, Germany - (martin.weinmann, boris.jutzi)@kit.edu
bUniv. Paris-Est, LASTIG MATIS, IGN, ENSG,
F-94160 Saint-Mande, France - [email protected] c
Institute of Computer Science II, University of Bonn,
Friedrich-Ebert-Allee 144, D-53113 Bonn, Germany - [email protected]
Commission II, WG II/4
KEY WORDS:3D, Point Cloud, Feature Extraction, Classification, Feature Relevance Assessment
ABSTRACT:
In this paper, we focus on the automatic interpretation of 3D point cloud data in terms of associating a class label to each 3D point. While much effort has recently been spent on this research topic, little attention has been paid to the influencing factors that affect the quality of the derived classification results. For this reason, we investigate fundamental influencing factors making geometric features more or less relevant with respect to the classification task. We present a framework which consists of five components addressing point sampling, neighborhood recovery, feature extraction, classification and feature relevance assessment. To analyze the impact of the main influencing factors which are represented by the given point sampling and the selected neighborhood type, we present the results derived with different configurations of our framework for a commonly used benchmark dataset for which a reference labeling with respect to three structural classes (linear structures,planar structuresandvolumetric structures) as well as a reference labeling with respect to five semantic classes (Wire,Pole/Trunk,Fac¸ade,GroundandVegetation) is available.
1. INTRODUCTION
Modern scanning devices allow acquiring 3D data in the form of densely sampled point clouds comprising millions of 3D points. Based on such point clouds, a variety of tasks can be performed of which many rely on an initial point cloud interpretation. Such an initial interpretation is often derived via point cloud classifi-cation where the objective consists in automatically labeling the 3D points of a given point cloud with respect to pre-defined class labels. In this regard, the main challenges are given by the irreg-ular point sampling with typically strongly varying point density, different types of objects in the scene and a high complexity of the observed scene.
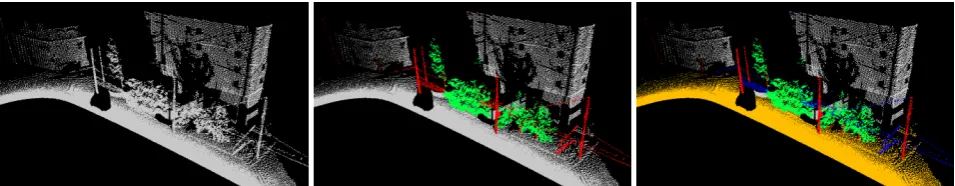
Interestingly, the visualization of the spatial arrangement of ac-quired 3D points (and thus only geometric cues) is already suf-ficient for us humans to reason about specific structures in the scene (Figure 1). For this reason, we follow a variety of investi-gations on point cloud classification and focus on the use of ge-ometric features. In this regard, the standard processing pipeline starts with the recovery of a local neighborhood for each 3D point of the given point cloud. Subsequently, geometric features are ex-tracted based on the consideration of the spatial arrangement of 3D points within the local neighborhoods, and these features are finally provided as input to a classifier that has been trained on representative training data and is therefore able to generalize to unseen data. Such a standard processing pipeline already reveals that the derived classification results might strongly depend on the given point sampling, the selected neighborhood type, the ex-tracted geometric features themselves and the involved classifier.
This paper is dedicated to a detailed analysis of fundamental in-fluencing factors regarding point cloud classification and feature
relevance with respect to the classification task. In contrast to pre-vious work, we aim at quantifying the impact of the given point sampling and the selected neighborhood type on geometric fea-tures and their relevance with respect to the classification task. For this purpose, we consider
• the original point sampling and a point sampling derived via voxel-grid filtering,
• four conceptually different neighborhood types (a spherical neighborhood with a radius of1m, a cylindrical neighbor-hood with a radius of1m, a spherical neighborhood formed by the50nearest neighbors and a spherical neighborhood formed by the “optimal” number of nearest neighbors), • a set of18low-level geometric 3D and 2D features, • a classification with respect to structural classes and a
clas-sification with respect to semantic classes,
• three classifiers relying on different learning principles (instance-based learning, probabilistic learning and ensem-ble learning), and
• a classifier-independent relevance metric taking into account seven different intrinsic properties of the given training data.
For performance evaluation, we use a benchmark dataset for which reference labelings with respect to three structural classes (linear structures, planar structures andvolumetric structures) and five semantic classes (Wire,Pole/Trunk,Fac¸ade,Groundand Vegetation) are available as shown in Figure 1.
After briefly summarizing related work (Section 2), we present the proposed framework for 3D point cloud classification and fea-ture relevance assessment (Section 3). We demonstrate the per-formance of this framework on a benchmark dataset (Section 4)
This contribution has been peer-reviewed. The double-blind peer-review was conducted on the basis of the full paper.
Figure 1. Visualization of a point cloud (left) and two reference labelings: the labeling in the center refers to three structural classes that are represented bylinear structures(red),planar structures(gray) andvolumetric structures(green); the labeling on the right refers to five semantic classes that are represented byWire(blue),Pole/Trunk(red),Fac¸ade(gray),Ground(orange) andVegetation(green).
and discuss the derived results with respect to different aspects (Section 5). Finally, we provide concluding remarks and sugges-tions for future work (Section 6).
2. RELATED WORK
In the following, we briefly summarize related work and thereby address a typical processing pipeline for point cloud classification that involves the steps of neighborhood recovery (Section 2.1), feature extraction (Section 2.2) and classification (Section 2.3). In addition, we address previous work on feature relevance as-sessment (Section 2.4).
2.1 Neighborhood Recovery
In general, different strategies may be applied to recover local neighborhoods for the points of a 3D point cloud. In particular, those neighborhood types in the form of a spherical neighborhood parameterized by a radius (Lee and Schenk, 2002), a cylindrical neighborhood parameterized by a radius (Filin and Pfeifer, 2005), a spherical neighborhood parameterized by the number of near-est neighbors with respect to the Euclidean distance in 3D space (Linsen and Prautzsch, 2001) or a cylindrical neighborhood pa-rameterized by the number of nearest neighbors with respect to the Euclidean distance in 2D space (Niemeyer et al., 2014) are commonly used. These neighborhood types are parameterized with a single scale parameter which is represented by either a radius or the number of nearest neighbors, and they allow de-scribing the local 3D structure at a specific scale. To select an ap-propriate value for the scale parameter, prior knowledge about the scene and/or the data is typically involved. Furthermore, identical values for the scale parameter are typically selected for all points of the 3D point cloud. Recent investigations however revealed that structures related with different classes may favor a different neighborhood size (Weinmann et al., 2015a; Weinmann, 2016) and therefore it seems favorable to allow for more variability by using data-driven approaches for optimal neighborhood size se-lection (Mitra and Nguyen, 2003; Lalonde et al., 2005; Demantk´e et al., 2011; Weinmann et al., 2015a).
Instead of using a single neighborhood to describe the local 3D structure at a specific scale, multiple neighborhoods can be used to describe the local 3D structure at different scales and thus also take into account how the local 3D geometry behaves across these scales. The commonly used multi-scale neighborhoods typ-ically focus on the combination of spherical neighborhoods with different radii (Brodu and Lague, 2012) or the combination of cylindrical neighborhoods with different radii (Niemeyer et al., 2014; Schmidt et al., 2014). Furthermore, it has been proposed to use multi-type neighborhoods by combining neighborhoods based on different entities such as voxels, blocks and pillars (Hu
et al., 2013), or multi-scale, multi-type neighborhoods which re-sult from a combination of both spherical and cylindrical neigh-borhoods with different scale parameters (Blomley et al., 2016).
In the scope of this work, we intend to analyze the impact of the neighborhood type on the derived classification results and on the relevance of single features with respect to the classification task. Accordingly, we integrate several of the commonly used single-scale neighborhood types into our framework.
2.2 Feature Extraction
After the recovery of local neighborhoods, geometric features can be extracted by considering the spatial arrangement of ing points. In this regard, the spatial coordinates of neighbor-ing points are often used to derive the 3D structure tensor whose eigenvalues can be used to detect specific shape primitives (Jutzi and Gross, 2009). The eigenvalues of the 3D structure tensor can also be used to derive the local 3D shape features (West et al., 2004; Pauly et al., 2003) which allow a rather intuitive descrip-tion of the local 3D structure with one value per feature and are therefore widely used for point cloud classification. In addition to these local 3D shape features, other features can be used to ac-count for further characteristics of the local 3D structure, e.g. an-gular characteristics (Munoz et al., 2009), height and plane char-acteristics (Mallet et al., 2011), a variety of low-level geometric 3D and 2D features (Weinmann et al., 2015a; Weinmann, 2016), moments and height features (Hackel et al., 2016), or specific de-scriptors addressing surface properties, slope, height characteris-tics, vertical profiles and 2D projections (Guo et al., 2015). For the sake of clarity, we also mention that there are more complex features, e.g. sampled features in the form of spin images (John-son and Hebert, 1999), shape distributions (Osada et al., 2002; Blomley et al., 2016), or point feature histograms (Rusu et al., 2009).
In the scope of this work, we do not intend to address feature design or feature learning. Instead, we aim at generally evalu-ating the relevance of standard features with respect to the clas-sification task. Hence, we focus on the extraction of geometric features that are rather intuitive and represented by a single value per feature. The features presented in (Weinmann et al., 2015a; Weinmann, 2016) satisfy these constraints and are therefore used.
2.3 Classification
2011) or Bayesian Discriminant Analysis classifiers (Khoshel-ham and Oude Elberink, 2012) can be used which are easy-to-use and meanwhile available in a variety of software tools. A recent comparison of several respective classifiers relying on different learning principles reveals that a Random Forest classifier pro-vides a good trade-off between classification accuracy and com-putational efficiency (Weinmann et al., 2015a; Weinmann, 2016). On the other hand, it might be desirable to avoid a “noisy” be-havior of the derived labeling due to treating each point individu-ally and therefore use a classifier that enforces a spatiindividu-ally regular labeling. In this regard, statistical models of context are typi-cally involved, e.g. in the form of Associative Markov Networks (Munoz et al., 2009), non-Associative Markov Networks (Shapo-valov et al., 2010), or Conditional Random Fields (Niemeyer et al., 2014; Schmidt et al., 2014; Weinmann et al., 2015b).
In the scope of this work, we intend to consider the classification results derived with a standard classifier in order to evaluate the relevance of features with respect to the classification task. To be able to draw more general conclusions, we involve respective classifiers relying on different learning principles. Involving con-textual information to derive a spatially regular labeling would also have an impact on the derived results, but it would be hard to have a decoupled conclusion about the impact of the involved features and the impact of contextual information.
2.4 Feature Relevance Assessment
Due to a lack of knowledge about the scene and/or the data, of-ten as many features as possible are defined and provided as in-put to a classifier. However, some features may be more rele-vant, whereas others may be less suitable or even irrelevant. Al-though, in theory, many classifiers are considered to be insensi-tive to the given dimensionality, redundant or irrelevant informa-tion has been proven to influence their performance in practice. In particular for high-dimensional data representations, the Hughes phenomenon (Hughes, 1968) can often be observed according to which an increase of the number of features over a certain thresh-old results in a decrease in classification accuracy, given a con-stant number of training examples. As a consequence, attention has been paid to feature selection with the objectives of gaining predictive accuracy, improving computational efficiency with re-spect to both time and memory consumption, and retaining mean-ingful features (Guyon and Elisseeff, 2003). Some feature selec-tion methods allow assessing the relevance of single features and thus ranking these features according to their relevance with re-spect to the classification task. In the context of point cloud clas-sification, it has for instance been proposed to use an embedded method in the form of a Random Forest classifier which internally evaluates feature relevance (Chehata et al., 2009). Furthermore, wrapper-based methods interacting with a classifier and perform-ing either sequential forward selection or sequential backward elimination have been used (Mallet et al., 2011; Khoshelham and Oude Elberink, 2012). However, both embedded methods and wrapper-based methods evaluate feature relevance with respect to the involved classifier, thus introducing a dependency on a classifier and its settings (e.g., for the case of a Random Forest classifier the number of involved weak learners, their type and the (ideally high) number of considered choices per variable). In contrast, filter-based methods are classifier-independent and only exploit a score function directly based on the training data which, in turn, results in simplicity and efficiency (Weinmann, 2016).
In the scope of this work, we intend to evaluate the relevance of single features with respect to the classification task. For this
pur-pose, we use a filter-based method taking into account different characteristics of the given training data via a general relevance metric presented in (Weinmann, 2016). Instead of using the fea-ture ranking for a sequential forward selection coupled with clas-sification, we consider the ranking itself with respect to different reference labelings to draw general conclusions about generally relevant features, generally irrelevant features and features that vary in their relevance with respect to the classification task.
3. METHODOLOGY
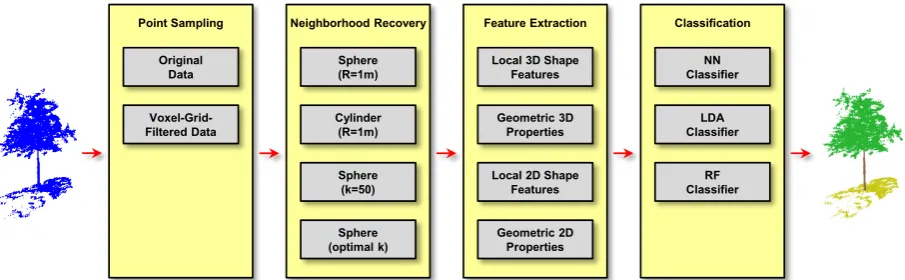
The proposed framework for point cloud classification and fea-ture relevance assessment comprises five components address-ing point sampladdress-ing (Section 3.1), neighborhood recovery tion 3.2), feature extraction (Section 3.3), classification (Sec-tion 3.4) and feature relevance assessment (Sec(Sec-tion 3.5). An overview on the different components is provided in Figure 2.
3.1 Point Sampling
To investigate the influence of the point sampling on point cloud classification and feature relevance assessment, we take into ac-count two different options for the point sampling. On the one hand, we consider the original point cloud. On the other hand, we consider a downsampling of the original point cloud via a voxel-grid filter (Theiler et al., 2014; Hackel et al., 2016) to roughly even out a varying point density as e.g. expected when using ter-restrial or mobile laser scanning systems for data acquisition.
3.2 Neighborhood Recovery
A crucial prerequisite for the extraction of geometric features is represented by an appropriate neighborhood definition. As we intend to investigate the impact of the neighborhood type on the classification results and on the relevance of single features, we integrate different options to recover the local neighborhood of each considered pointXiinto our framework:
• a spherical neighborhoodNs,1m, where the sphere is cen-tered atXiand has a radius of1m,
• a cylindrical neighborhood Nc,1m, where the cylinder is centered at Xi, has a radius of1m and is oriented along
the vertical direction,
• a spherical neighborhoodNk=50 comprising thek = 50 nearest neighbors ofXiwith respect to the Euclidean
dis-tance in 3D space, and
• a spherical neighborhood Nkopt comprising the optimal numberkopt,iof nearest neighbors ofXiwith respect to the
Euclidean distance in 3D space, wherebykopt,iis selected
for each 3D point individually via eigenentropy-based scale selection (Weinmann et al., 2015a; Weinmann, 2016).
3.3 Feature Extraction
For each neighborhood type, we extract a set of geometric fea-tures describing the spatial arrangement of points within the local neighborhood of each considered pointXi. More specifically,
we calculate the features presented in (Weinmann et al., 2015a; Weinmann, 2016) as these features are rather intuitive and repre-sented by only a single value per feature. This feature set com-prises14geometric 3D features and four geometric 2D features.
Among the 3D features, some are represented by the local 3D shape featuresthat rely on the eigenvaluesλjwithj = 1,2,3
This contribution has been peer-reviewed. The double-blind peer-review was conducted on the basis of the full paper.
Sphere
Figure 2. Overview on the proposed methodology: the original point cloud is either kept or downsampled via voxel-grid filtering; local neighborhoods are subsequently recovered to extract geometric features which are provided as input to a classifier; the training data is furthermore used to assess feature relevance with respect to the given classification task.
of the 3D structure tensor derived fromXi and its neighboring
points. These features are given by linearityLλ, planarityPλ, sphericity Sλ, omnivariance Oλ, anisotropyAλ, eigenentropy
Eλ, sum of eigenvaluesΣλand change of curvatureCλ(West
et al., 2004; Pauly et al., 2003). Other 3D features are defined in terms ofgeometric 3D propertiesthat are represented by the heightH ofXi, the distanceD3DbetweenXiand the farthest
point in the local neighborhood, the local point densityρ3D, the verticalityV, and the maximum difference∆H as well as the standard deviationσHof the height values corresponding to those points within the local neighborhood.
The additional use of 2D features is motivated by the fact that spe-cific assumptions about the point distribution can be made. Ur-ban areas are for instance characterized by a variety of man-made objects of which many are characterized by almost perfectly ver-tical structures. To encode such characteristics with geometric features, a 2D projection ofXiand all other points within the
local neighborhood onto a horizontally oriented plane is intro-duced. Based on these projections,local 2D shape featuresare defined by the sumΣξand the ratioRξof the eigenvaluesξjwith j= 1,2of the 2D structure tensor. Furthermore,geometric 2D propertiesare defined by the distanceD2Dbetween the projec-tion ofXiand the farthest point in the local 2D neighborhood
and the local point densityρ2Din 2D space.
3.4 Classification
To be able to draw more general conclusions, we integrate three different classifiers into our framework: a Nearest Neighbor (NN) classifier relying on instance-based learning, a Linear Discrimi-nant Analysis (LDA) classifier relying on probabilistic learning and a Random Forest (RF) classifier (Breiman, 2001) relying on ensemble learning. Whereas the NN classifier (with respect to Euclidean distances in the feature space) and the LDA classifier do not involve a classifier-specific setting, the RF classifier in-volves several parameters that have to be selected appropriately based on the given training data via parameter tuning on a suit-able subspace spanned by the considered parameters.
3.5 Feature Relevance Assessment
Among a variety of techniques for feature selection as for in-stance reviewed in (Saeys et al., 2007), filter-based feature se-lection methods have the advantage that they are classifier-independent and therefore relatively simple and efficient. More specifically, such methods evaluate relations between features
and classes to identify relevant features and partially also rela-tions among features to identify and discard redundant features (Weinmann, 2016). This is done based on the given training data by concatenating the values of a feature for all considered data points to a vector and comparing that vector with the vector con-taining the corresponding class labels. Thereby, the comparison is typically performed with a metric that delivers a single value as a score, thus allowing us to rank features with respect to their rel-evance to the considered classification task. Such metrics can eas-ily be implemented, but some of them are also available in soft-ware packages (Zhao et al., 2010). As different metrics may ad-dress different intrinsic properties of the given training data (e.g. correlation, information, dependence or consistency), a common consideration of several metrics seems to be desirable. For this reason, we focus on a two-step approach for feature ranking. In the first step, different metrics are applied to derive separate rank-ings for the featuresfiwithi= 1, . . . , Nf(andNf = 18for the considered set of low-level geometric features) with respect to different criteria (Weinmann, 2016):
• The degree to which a feature is correlated with the class labels is described with Pearson’s correlation coefficient (Pearson, 1896).
• A statistical measure of dispersion and thus an inequality measure quantifying a feature’s ability to distinguish be-tween classes is given by the Gini Index (Gini, 1912).
• The ratio between inter-class and intra-class variance is rep-resented by the Fisher score (Fisher, 1936).
• The dependence between a feature and the class labels is described with the Information Gain (Quinlan, 1986).
• To derive the contribution of a feature to the separation of samples from different classes, the ReliefF measure (Kononenko, 1994) is used.
• To assess whether a class label is independent of a particular feature, aχ2-test is used.
• To analyze the effectivity of a feature regarding the separa-tion of classes, at-test on each feature is used.
¯
wherer(fi|mj)indicates the rank of a featurefigiven the metric
mjand hencer(fi|mj)∈[1, Nf]. Finally, we map the derived average ranks to the interval[0,1]in order to interpret the result as relevanceRof the featurefi(Weinmann, 2016):
R(fi) = 1−¯r(fi)−1
Nf−1 (2)
4. EXPERIMENTAL RESULTS
In the following, we first describe the dataset used for our experi-ments (Section 4.1). Subsequently, we focus on the impact of the selected neighborhood type on feature extraction (Section 4.2), before we present the derived classification results (Section 4.3) and the results of feature relevance assessment (Section 4.4).
4.1 Dataset
For our experiments, we use theOakland 3D Point Cloud Dataset (Munoz et al., 2009). This dataset has been acquired with a mo-bile laser scanning system in the vicinity of the CMU campus in Oakland, USA. According to the provided specifications (Munoz et al., 2008; Munoz et al., 2009), the mobile laser scanning sys-tem was represented by a vehicle equipped with a side-looking Sick laser scanner used in push-broom mode, and the vehicle drove in an urban environment with a speed of up to20km/h. Accordingly, significant variations in point density can be ex-pected. To evaluate the performance of an approach for point cloud classification on this dataset, a split of the dataset into a training set comprising about36.9k points, a validation set com-prising about91.5k points and a test set comprising about1.3M points is provided. For each point, a reference labeling with re-spect to three structural classes represented bylinear structures, planar structuresandvolumetric structuresis available as well as a reference labeling with respect to five semantic classes rep-resented byWire, Pole/Trunk, Fac¸ade, Ground andVegetation. Both reference labelings are visualized in Figure 1 for the valida-tion set. To distinguish between the two classificavalida-tion tasks, we refer toOakland-3CandOakland-5C, respectively.
4.2 Impact of Neighborhood Type on Geometric Features
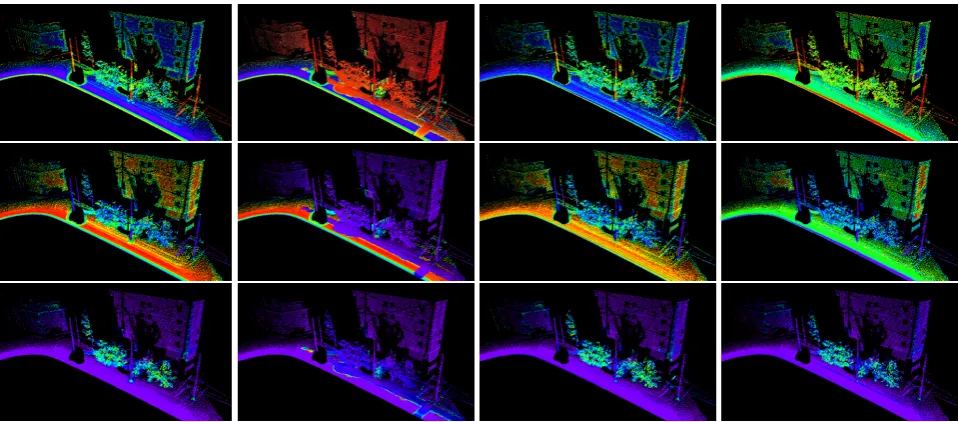
It can be expected that low-level geometric features reveal a dif-ferent structural behavior for the difdif-ferent neighborhood types. Indeed, this can also be observed in our experiments for the in-volved geometric features. In Figure 3, we exemplarily consider the behavior of the three dimensionality features of linearityLλ, planarityPλand sphericitySλ. A visualization of the number of considered points within the local neighborhood is provided in Figure 4 and indicates different characteristics as well. The neighborhoodsNs,1m andNc,1mtend towards a larger number of points within the local neighborhood, whereas the number of neighboring points is by definition constant forNk=50 and the neighborhoodNkopt tends towards a smaller number of points within the local neighborhood.
4.3 Classification Results
Due to their significantly different impact on feature extraction, it may be expected that the different neighborhood types will also
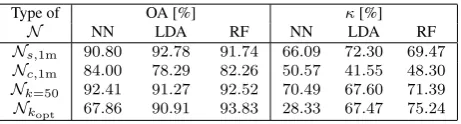
Type of OA [%] κ[%]
Table 1. Classification results obtained forOakland-3Cwhen us-ing the original point cloud, four different neighborhood types and three different classifiers.
Table 2. Classification results obtained forOakland-5Cwhen us-ing the original point cloud, four different neighborhood types and three different classifiers.
significantly differ in their suitability with respect to the classi-fication task. To verify this, we use each of the four presented neighborhood typesNs,1m,Nc,1m,Nk=50andNkoptto extract the18geometric features which, in turn, are provided as input to three classifiers relying on different learning principles. Thereby, we take into account that the number of training examples per class varies significantly which might have a detrimental effect on the classification results (Criminisi and Shotton, 2013). To avoid such issues, we reduce the training data by randomly sampling an identical number of1,000training examples per class, i.e. the reduced training set comprises3k training samples for Oakland-3Cand5k training samples forOakland-5C, respectively. Once a respective classifier has been trained on the reduced training data, we perform a prediction of the labels for the validation data and we compare the derived labeling to the reference labeling on a per-point basis. Thereby, we consider the global evaluation metrics represented by overall accuracy (OA) and Cohen’s kappa coefficient (κ). Note that considering OA as the only indicator might not be sufficient if the number of examples per class is very inhomogeneous. For this reason, we also consider theκ -value which allows judging about the separability of classes.
First, we consider the classification of the original point cloud. ForOakland-3C, the derived classification results are provided in Table 1. The overall accuracy is between67% and94%, while theκ-value is between28% and76%. ForOakland-5C, the de-rived classification results are provided in Table 2. The overall accuracy is between68% and96%, while theκ-value is between 49% and90%. For the results obtained with the Random Forest classifier forOakland-3CandOakland-5C, a visualization of the derived labeling is depicted in Figure 5.
Furthermore, we consider the classification of the point cloud that results from a downsampling of the original point cloud with a voxel-grid filter. Thereby, the side length of the voxel is exem-plarily selected as10cm, and all points inside a voxel are replaced by their centroid. For the considered validation data, only59,787 of91,515points (i.e. 65.33%) are kept for a subsequent neigh-borhood recovery, feature extraction and classification. Finally, the derived labeling is transferred back to the original point cloud by associating each point of the original point cloud with the la-bel derived for the closest point in the downsampled point cloud. The respective classification results corresponding to the com-plete validation data are provided in Table 3 forOakland-3Cand in Table 4 forOakland-5C, respectively.
This contribution has been peer-reviewed. The double-blind peer-review was conducted on the basis of the full paper.
Figure 3. Behavior of the three dimensionality features of linearityLλ(top row), planarityPλ(center row) and sphericitySλ(bottom row) for the neighborhood typesNs,1m,Nc,1m,Nk=50andNkopt(from left to right): the color encoding indicates high values close to1in red and reaches via yellow, green, cyan and blue to violet for low values close to0.
Figure 4. Number of points within the local neighborhood when using the neighborhood typesNs,1m,Nc,1m,Nk=50andNkopt(from left to right): the color encoding indicates neighborhoods with10or less points in red and reaches via yellow, green, cyan and blue to violet for100and more points.
Figure 5. Classification results obtained forOakland-3C(top row) andOakland-5C(bottom row) when using the original point cloud, the neighborhood typesNs,1m,Nc,1m,Nk=50andNkopt(from left to right) and a Random Forest classifier.
Type of OA [%] κ[%]
N NN LDA RF NN LDA RF Ns,1m 76.66 93.20 92.60 40.45 73.65 71.51
Nc,1m 85.24 82.10 83.07 53.11 47.84 49.62
Nk=50 92.96 92.37 93.92 72.18 70.91 75.04
Nk
opt 78.38 93.63 94.45 41.70 75.12 77.06
Table 3. Classification results obtained forOakland-3Cwhen us-ing the downsampled point cloud, four different neighborhood types and three different classifiers.
4.4 Feature Relevance Assessment
To assess feature relevance with respect to a given classification task, we evaluate the general relevance metric based on the
re-Type of OA [%] κ[%]
N NN LDA RF NN LDA RF Ns,1m 91.11 95.70 94.00 80.91 90.08 86.26
Nc,1m 86.05 86.32 85.58 71.59 72.05 70.71
Nk=50 92.59 93.99 94.95 83.58 86.27 88.29
Nk
opt 76.76 95.11 94.24 58.85 88.81 86.85
Table 4. Classification results obtained forOakland-5Cwhen us-ing the downsampled point cloud, four different neighborhood types and three different classifiers.
Oakland-5C when using different neighborhood types, and the respective result of feature relevance assessment based on a sub-set of the voxel-grid-filtered training data is provided in Figure 7.
5. DISCUSSION
The derived results reveal that, in comparison to the classification of the original point cloud (Tables 1 and 2), the classification of a voxel-grid-filtered point cloud and a subsequent transfer of the classification results to the original point cloud seem to be able to better cope with the varying point density (Tables 3 and 4). Fur-thermore, it can be seen that different neighborhood types have a different impact on geometric features (Figure 3). This might also be due to their different behavior, since the spherical and cylindrical neighborhood types parameterized by a radius tend to a larger number of points within the local neighborhood, whereas the neighborhoods derived via eigenentropy-based scale selection tend to be comparably small (Figure 4). As the latter neighbor-hood type provides a data-driven neighborneighbor-hood size selection for each individual point of a point cloud, this neighborhood type takes into account that structures related to different classes might favor a different neighborhood size. This is not taken into account with the other neighborhood types which rely on a heuristically selected value for the scale parameter that is kept identical for all points of the point cloud. The derived classification results (Tables 1-4, Figure 5) also reveal that the cylindrical neighbor-hood type is not that suitable for classifying terrestrial or mobile laser scanning data, whereas using the other neighborhood types yields appropriate classification results for almost all cases. For classification, the LDA classifier and the RF classifier outperform the NN classifier. Due to the simplifying assumption of Gaussian distributions in the feature space – which cannot be guaranteed for the acquired data – the LDA classifier has a conceptual limi-tation. Hence, we consider the RF classifier as favorable option for classification. Finally, as expected, it becomes obvious that the relevance of single features varies depending on the classi-fication task, the point sampling and the selected neighborhood type (Figures 6 and 7). In this regard, the most relevant features are represented byOλ,Eλ,Cλ,∆H,σHandRξ.
6. CONCLUSIONS
In this paper, we have presented a framework for point cloud classification which consists of five components addressing point sampling, neighborhood recovery, feature extraction, classifica-tion and feature relevance assessment. Using different config-urations of the framework, i.e. different methods for some of its components, we have analyzed influencing factors regarding point cloud classification and feature relevance with respect to two different classification tasks. Concerning the point sampling, the downsampling of a point cloud via a voxel-grid filter, a subse-quent classification and the transfer of the classification results to the original data tend to slightly improve the quality of the derived classification results in comparison to performing a classification on the original data. Among the considered neighborhood types, the cylindrical neighborhood type clearly reveals less suitability for classifying terrestrial or mobile laser scanning data, whereas the spherical neighborhoods (parameterized by either a radius or the number of nearest neighbors) have proven to be favorable. For classification, the LDA classifier and the RF classifier have delivered appropriate classification results. Furthermore, the rel-evance of features varies depending on the classification task, the point sampling and the selected neighborhood type. Among the most relevant features are the omnivarianceOλ, the eigenentropy
Eλ, the change of curvatureCλ, the maximum difference∆Has well as the standard deviationσHof height values, and the ratio
Rξof the eigenvalues of the 2D structure tensor.
In future work, a more comprehensive analysis of influencing factors regarding point cloud classification and feature relevance with respect to the classification task is desirable. This certainly includes other types of features, but also a consideration of the behavior of multi-scale neighborhoods. The latter considerably increase the computational burden with respect to both process-ing time and memory consumption, so that more sophisticated approaches are required when dealing with larger datasets. A re-spective approach towards data-intensive processing has recently been presented and relies on a scale pyramid that is created by repeatedly downsampling a given point cloud via a voxel-grid fil-ter (Hackel et al., 2016). Furthermore, it seems worth analyzing different approaches to impose spatial regularity on the derived classification results, e.g. via statistical models of context.
REFERENCES
Blomley, R., Jutzi, B. and Weinmann, M., 2016. Classification of air-borne laser scanning data using geometric multi-scale features and
dif-ferent neighbourhood types. In: ISPRS Annals of the Photogrammetry,
Remote Sensing and Spatial Information Sciences, Prague, Czech Repub-lic, Vol. III-3, pp. 169–176.
Breiman, L., 2001. Random forests.Machine Learning45(1), pp. 5–32.
Brodu, N. and Lague, D., 2012. 3D terrestrial lidar data classification of complex natural scenes using a multi-scale dimensionality criterion:
applications in geomorphology. ISPRS Journal of Photogrammetry and
Remote Sensing68, pp. 121–134.
Chehata, N., Guo, L. and Mallet, C., 2009. Airborne lidar feature
selec-tion for urban classificaselec-tion using random forests. In:The International
Archives of the Photogrammetry, Remote Sensing and Spatial Informa-tion Sciences, Paris, France, Vol. XXXVIII-3/W8, pp. 207–212.
Criminisi, A. and Shotton, J., 2013.Decision forests for computer vision
and medical image analysis. Advances in Computer Vision and Pattern Recognition, Springer, London, UK.
Demantk´e, J., Mallet, C., David, N. and Vallet, B., 2011.
Dimensional-ity based scale selection in 3D lidar point clouds. In:The International
Archives of the Photogrammetry, Remote Sensing and Spatial Informa-tion Sciences, Calgary, Canada, Vol. XXXVIII-5/W12, pp. 97–102. Filin, S. and Pfeifer, N., 2005. Neighborhood systems for airborne laser
data. Photogrammetric Engineering & Remote Sensing71(6), pp. 743–
755.
Fisher, R. A., 1936. The use of multiple measurements in taxonomic
problems.Annals of Eugenics7(2), pp. 179–188.
Gini, C., 1912. Variabilite e mutabilita. Memorie di metodologia
statis-tica.
Guo, B., Huang, X., Zhang, F. and Sohn, G., 2015. Classification of
airborne laser scanning data using JointBoost. ISPRS Journal of
Pho-togrammetry and Remote Sensing100, pp. 71–83.
Guyon, I. and Elisseeff, A., 2003. An introduction to variable and feature
selection.Journal of Machine Learning Research3, pp. 1157–1182.
Hackel, T., Wegner, J. D. and Schindler, K., 2016. Fast semantic
seg-mentation of 3D point clouds with strongly varying density. In:ISPRS
Annals of the Photogrammetry, Remote Sensing and Spatial Information Sciences, Prague, Czech Republic, Vol. III-3, pp. 177–184.
Hu, H., Munoz, D., Bagnell, J. A. and Hebert, M., 2013. Efficient 3-D
scene analysis from streaming data. In:Proceedings of the IEEE
Inter-national Conference on Robotics and Automation, Karlsruhe, Germany, pp. 2297–2304.
Hughes, G. F., 1968. On the mean accuracy of statistical pattern
recog-nizers.IEEE Transactions on Information Theory14(1), pp. 55–63.
Johnson, A. E. and Hebert, M., 1999. Using spin images for efficient
object recognition in cluttered 3D scenes.IEEE Transactions on Pattern
Analysis and Machine Intelligence21(5), pp. 433–449.
Jutzi, B. and Gross, H., 2009. Nearest neighbour classification on laser
point clouds to gain object structures from buildings. In: The
Interna-tional Archives of the Photogrammetry, Remote Sensing and Spatial In-formation Sciences, Hannover, Germany, Vol. XXXVIII-1-4-7/W5.
This contribution has been peer-reviewed. The double-blind peer-review was conducted on the basis of the full paper.
Lλ Pλ Sλ Oλ Aλ Eλ Σλ Cλ H D3D ρ3D V ∆H σH D2D ρ2D Σξ Rξ
Figure 6. Feature relevance forOakland-3C(top) andOakland-5C(bottom) when using the reduced version of the original training data (1,000examples per class) and the neighborhood typesNs,1m(blue),Nc,1m(green),Nk=50(yellow) andNkopt(red).
Lλ Pλ Sλ Oλ Aλ Eλ Σλ Cλ H D3D ρ3D V ∆H σH D2D ρ2D Σξ Rξ
Figure 7. Feature relevance forOakland-3C(top) andOakland-5C(bottom) when using a reduced version of the voxel-grid-filtered training data (1,000examples per class) and the neighborhood typesNs,1m(blue),Nc,1m(green),Nk=50(yellow) andNkopt(red).
Khoshelham, K. and Oude Elberink, S. J., 2012. Role of dimensionality reduction in segment-based classification of damaged building roofs in
airborne laser scanning data. In:Proceedings of the International
Confer-ence on Geographic Object Based Image Analysis, Rio de Janeiro, Brazil, pp. 372–377.
Kononenko, I., 1994. Estimating attributes: analysis and extensions of
RELIEF. In:Proceedings of the European Conference on Machine
Learn-ing, Catania, Italy, pp. 171–182.
Lalonde, J.-F., Unnikrishnan, R., Vandapel, N. and Hebert, M., 2005.
Scale selection for classification of point-sampled 3D surfaces. In:
Pro-ceedings of the International Conference on 3-D Digital Imaging and Modeling, Ottawa, Canada, pp. 285–292.
Lee, I. and Schenk, T., 2002. Perceptual organization of 3D surface
points. In: The International Archives of the Photogrammetry, Remote
Sensing and Spatial Information Sciences, Graz, Austria, Vol. XXXIV-3A, pp. 193–198.
Linsen, L. and Prautzsch, H., 2001. Local versus global triangulations. In:Proceedings of Eurographics, Manchester, UK, pp. 257–263. Mallet, C., Bretar, F., Roux, M., Soergel, U. and Heipke, C., 2011. Rele-vance assessment of full-waveform lidar data for urban area classification.
ISPRS Journal of Photogrammetry and Remote Sensing66(6), pp. S71– S84.
Mitra, N. J. and Nguyen, A., 2003. Estimating surface normals in noisy
point cloud data. In:Proceedings of the Annual Symposium on
Compu-tational Geometry, San Diego, USA, pp. 322–328.
Munoz, D., Bagnell, J. A., Vandapel, N. and Hebert, M., 2009. Con-textual classification with functional max-margin Markov networks. In:
Proceedings of the IEEE Conference on Computer Vision and Pattern Recognition, Miami, USA, pp. 975–982.
Munoz, D., Vandapel, N. and Hebert, M., 2008. Directional associative
Markov network for 3-D point cloud classification. In: Proceedings of
the International Symposium on 3D Data Processing, Visualization and Transmission, Atlanta, USA, pp. 63–70.
Niemeyer, J., Rottensteiner, F. and Soergel, U., 2014. Contextual
classi-fication of lidar data and building object detection in urban areas.ISPRS
Journal of Photogrammetry and Remote Sensing87, pp. 152–165. Osada, R., Funkhouser, T., Chazelle, B. and Dobkin, D., 2002. Shape
distributions.ACM Transactions on Graphics21(4), pp. 807–832.
Pauly, M., Keiser, R. and Gross, M., 2003. Multi-scale feature extraction
on point-sampled surfaces.Computer Graphics Forum22(3), pp. 81–89.
Pearson, K., 1896. Mathematical contributions to the theory of evolution.
III. Regression, heredity and panmixia.Philosophical Transactions of the
Royal Society of LondonA(187), pp. 253–318.
Quinlan, J. R., 1986. Induction of decision trees.Machine Learning1(1),
pp. 81–106.
Rusu, R. B., Blodow, N. and Beetz, M., 2009. Fast point feature
his-tograms (FPFH) for 3D registration. In:Proceedings of the IEEE
Interna-tional Conference on Robotics and Automation, Kobe, Japan, pp. 3212– 3217.
Saeys, Y., Inza, I. and Larra˜naga, P., 2007. A review of feature selection
techniques in bioinformatics.Bioinformatics23(19), pp. 2507–2517.
Schmidt, A., Niemeyer, J., Rottensteiner, F. and Soergel, U., 2014.
Con-textual classification of full waveform lidar data in the Wadden Sea.IEEE
Geoscience and Remote Sensing Letters11(9), pp. 1614–1618. Shapovalov, R., Velizhev, A. and Barinova, O., 2010. Non-associative
Markov networks for 3D point cloud classification. In:The International
Archives of the Photogrammetry, Remote Sensing and Spatial Information Sciences, Saint-Mand´e, France, Vol. XXXVIII-3A, pp. 103–108. Theiler, P. W., Wegner, J. D. and Schindler, K., 2014. Keypoint-based 4-Points Congruent Sets – Automated marker-less registration of laser
scans. ISPRS Journal of Photogrammetry and Remote Sensing 96,
pp. 149–163.
Weinmann, M., 2016.Reconstruction and analysis of 3D scenes – From
irregularly distributed 3D points to object classes. Springer, Cham, Switzerland.
Weinmann, M., Jutzi, B., Hinz, S. and Mallet, C., 2015a. Semantic point cloud interpretation based on optimal neighborhoods, relevant features
and efficient classifiers. ISPRS Journal of Photogrammetry and Remote
Sensing105, pp. 286–304.
Weinmann, M., Schmidt, A., Mallet, C., Hinz, S., Rottensteiner, F. and Jutzi, B., 2015b. Contextual classification of point cloud data by
exploit-ing individual 3D neighborhoods. In:ISPRS Annals of the
Photogramme-try, Remote Sensing and Spatial Information Sciences, Munich, Germany, Vol. II-3/W4, pp. 271–278.
West, K. F., Webb, B. N., Lersch, J. R., Pothier, S., Triscari, J. M. and Iverson, A. E., 2004. Context-driven automated target detection in 3-D
data.Proceedings of SPIE5426, pp. 133–143.
Zhao, Z., Morstatter, F., Sharma, S., Alelyani, S., Anand, A. and Liu, H., 2010. Advancing feature selection research – ASU feature selection
repository.Technical Report, School of Computing, Informatics, and