OBJECT BASED AGRICULTURAL LAND COVER CLASSIFICATION MAP OF
SHADOWED AREAS FROM AERIAL IMAGE AND LIDAR DATA
USING SUPPORT VECTOR MACHINE
R. T. Alberto a, *, S. C. Serrano b, G. B. Damian c, E. E. Camaso c, A. B. Celestino c, P.J. C. Hernando c, M. F. Isip c, K. M. Orge c, M.J. C. Quinto c, and R. C. Tagaca c
a College of Agriculture, Central Luzon State University, Philippines - [email protected]
b Institute for Climate change and Environmental Management, Central Luzon State University, Philippines - [email protected] c Phil-LiDAR 2 Project, Institute for Climate change and Environmental Management, Central Luzon State University, Philippines -
(viryses10, elie.camaso7, abcelestino18, princesshernando, miguelitoisip21, kliff22, josephcalaunan, rctagaca15)@gmail.com
Commission VII, WG VII/4
KEY WORDS: Agricultural land cover, Segmentation, Support Vector Machine, Shadows, Classification accuracy
ABSTRACT
Aerial image and LiDAR data offers a great possibility for agricultural land cover mapping. Unfortunately, these images leads to shadowy pixels. Management of shadowed areas for classification without image enhancement were investigated. Image segmentation approach using three different segmentation scales were used and tested to segment the image for ground features since only the ground features are affected by shadow caused by tall features. The RGB band and intensity were the layers used for the segmentation having an equal weights. A segmentation scale of 25 was found to be the optimal scale that will best fit for the shadowed and non-shadowed area classification. The SVM using Radial Basis Function kernel was then applied to extract classes based on properties extracted from the Lidar data and orthophoto. Training points for different classes including shadowed areas were selected homogeneously from the orthophoto. Separate training points for shadowed areas were made to create additional classes to reduced misclassification. Texture classification and object-oriented classifiers have been examined to reduced heterogeneity problem. The accuracy of the land cover classification using 25 scale segmentation after accounting for the shadow detection and classification was significantly higher compared to higher scale of segmentation.
1. INTRODUCTION
Agricultural land cover classification map provides a framework to determine the range of crop grown in a certain area and it provides general strategic guidance on agricultural planners. Agricultural land cover classification map is generated from aerial image and lidar data using Support Vector Machine (SVM). Support vector machine was originally developed by Vapnik (1995), and considered as a new generation learning algorithm. SVM have several appealing characteristics for modellers, as it is statistically based models rather than loose analogies with natural learning systems, and theoretically guarantee performance (Cristianini and Scholkopf, 2002), and have been applied successfully to a range of remote sensing classification applications (Huang et al., 2002).
However, during the image capturing process, numerous influential factors hinder the quality of these images, such as the shadows due to the different angles of the sun, terrain features, and surface object occlusion (Dare 2005; Tsai 2006). Furthermore, the shadows in remote sensing images are regarded as image nuisances in numerous applications, specifically, change detection and image classification (Dare 2005; Zhou et al. 2009). It can either cause reduction or loss of information in the image. Reduction of information could potentially lead to the corruption of biophysical parameters derived from pixels values, such as vegetation indices (Leblon et al., 1996). Total loss of information could mean that the areas of the image cannot be interpreted, and value-added
products, such as digital terrain models, cannot be created (Dare, 2005) Shadowed areas have been traditionally left unclassified or simply classified as shadows (Shackelford and Davis, 2003). Shadows are created because the light source has been blocked by something. There are two types of shadows; a) Self-shadow and b) Cast shadow.A self-shadow is the shadow on a subject on the side that is not directly facing the light source. A cast shadow is the shadow of a subject falling on the surface of another subject because the former subject has blocked the light source. A cast shadow consists of two parts: the umbra and the penumbra. The umbra is created because the direct light has been completely blocked, while the penumbra is created by something partly blocking the direct light.
In this paper, we focused mainly on the shadows in the cast shadow area of the remote sensing images.Therefore, shadow management is important for improving the performance of the segmentation and identification. Thus methods were introduced in this study to enable minimum-supervision classifier to mitigate the effects of the shadows.
2. OBJECTIVES
3. DATA AND STUDY AREA
The data used in this research are from the aerial images and LiDAR data given by the Phil-Lidar1, Data Acquisition Component. The selected study site was an agricultural area (Anao: 15o46’’ 46’ N, 120 o36’’ 74’ E) in Tarlac, Philippines (Figure 1) with an area of 7.94 km2 . The agricultural land used of the site is dominated by corn and mango, some portions are rice and fallow, it also has a residential area and various non-crop trees.
Figure 1. Aerial image of the study site
4. METHODS
4.1. Generation of Derivatives
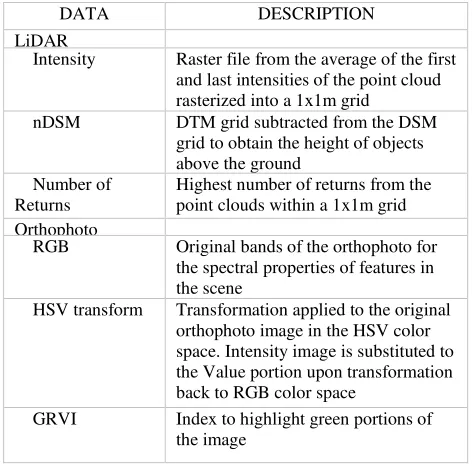
Various LiDAR derivatives were produced using Lastools, average intensity and number of returns were obtained using Lasgrid (Lastools software), while height information such as Digital Surface Model (DSM) and Digital Elevation Model (DEM) were derived using Blast2DEM (Lastools software), these height information were used to generate normalized Digital Surface Model (nDSM). The description of the layer used in the study is summarized in Table 1.
DATA DESCRIPTION
LiDAR
Intensity Raster file from the average of the first and last intensities of the point cloud rasterized into a 1x1m grid
nDSM DTM grid subtracted from the DSM grid to obtain the height of objects above the ground
Number of Returns
Highest number of returns from the point clouds within a 1x1m grid Orthophoto
RGB Original bands of the orthophoto for the spectral properties of features in the scene
HSV transform Transformation applied to the original orthophoto image in the HSV color space. Intensity image is substituted to the Value portion upon transformation back to RGB color space
GRVI Index to highlight green portions of the image
Ortho-image RGB bands with 0.5 meter resolution were used to compliment the LiDAR data. HSV (Hue, Saturation and Value) was derived by transforming the original RGB bands to HSV color space. GRVI (Green Red Vegetation Index) was also derived using the Ortho-image using band math equation, using the formula.
GRVI =Gr n−RGr n+R
4.2 Segmentation Method
A combination of image segmentation techniques were employed to achieved optimum segmentation. Creating representative image objects with image segmentation algorithm is important pre-requisite for classification/feature extraction (Dragut et al., 2014). Chessboard segmentation was first employed to segment the road, building, and water using thematic layers, since this study mainly focused on classifying agricultural land use type (LULC). eCognition® software (Trimble Geospatial Imaging) as used to carry out segmentation as well as classification. Multi-Threshold Segmentation was used to separate ground such as rice and fallow lands and non-ground feature such as trees, separation was done by creating larger scale for ground features and smaller scale for non-ground features. Multi-resolution segmentation (MRS) giving equal weights for RBG and intensity parameters as shown in Table 2 was used. In addition, equal weights were also given to the different images created in Table 3. The extraction of meaningful image objects needs to take into account the scale of the problem to be solved. Therefore the scale of resulting image objects should be free adaptable to fit to the scale of task (Baatz and Schape, 2000). Trials using 25, 50, 100 and 200 were carried out to segment ground features. In this case the optimal scale for shadowed and non-shadowed classes that will best fit for the classification was created. Scale” is one of the most important criteria in segmentation process. When the size of a growing region exceeds the threshold defined by the scale parameter, the merging process stops. Three criteria are defined in the Definiens software (formerly known as eCognition software) to constrain the pixel growing algorithm, namely: color, shape and scale, to control smoothness and compactness of image objects (Li and Shao, 2014). The subset of the study area showing segmentation for shadowed and non-shadowed classes as shown in Figure 2. The segmentation parameters used to segment the image was shown in Table 2.
SEGMENTATION
Table 2. Segmentation parameters used for the non-ground features
4.3 Sample selection
One of the important factors that affect land cover classification performance is the shadow problem whereby shadow cast by buildings and tree crowns reduces the spectral values of the true land cover under the shadows. Therefore, proper selection of training sample plots is critical for land cover classification (Lu et al, 2010). Training and validation points for different classes including shadowed areas were selected homogeneously from the orthophoto. To determine whether a particular area is shadow it has to be compare to other area in the image that are likely to be the same class. Shadowed area tend to be darker compared to its surrounding area. The shadow features are evaluated through image segmentation and suspected shadows were detected with the threshold method. Separate training points for shadowed areas were made to create additional classes to reduced misclassification due to shadow. For each of the classes, the number of training points were limited to a maximum of 18 points (Figure 3).
Figure 3. Training points used for classification are given as yellow dots while validation points are the red polygon.
4.4 Support vector machine (SVM) classification
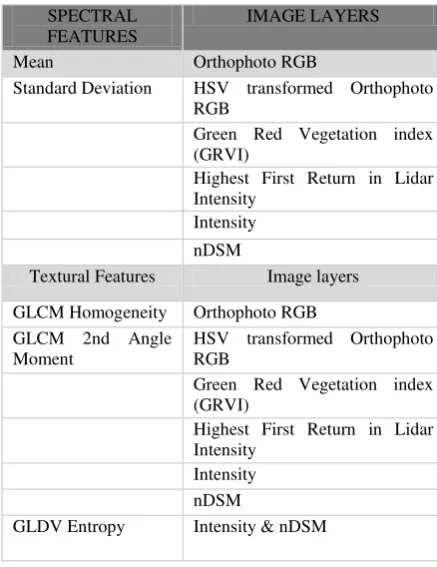
A suitable classification scheme is required before implementing a land use/land cover classification (LULC). The determination of classification scheme depends on the study area and available remote sensing data (Lu and Weng, 2007). The support vector machine (SVM) is a group of theoretically superior machine learning algorithms which was found competitive with the best available machine learning algorithms in classifying high-dimensional data sets (Huang, 2002). In this study Support Vector Machine (SVM) classification of LiDAR data and orthophoto has been applied by using Radial Basis Function kernel type in eCognition software (C parameter = 200). In order to reduce the heterogeneity problem, different methods, such as use of texture in classification and object-oriented classifiers have been examined (Shaban and Dikshit, 2001). Therefore different textural features based on the Grey Level Co-occurrence Matrix (GLCM) were used for the SVM classification. The proposed methodology is shown in Figure 4.
Table 3. List of features used for SVM Classifications SPECTRAL
FEATURES
IMAGE LAYERS
Mean Orthophoto RGB
Standard Deviation HSV transformed Orthophoto RGB
Textural Features Image layers
GLCM Homogeneity Orthophoto RGB GLCM 2nd Angle
Moment
HSV transformed Orthophoto RGB
Figure 4. Flow chart of the current methodology.
4.5 Accuracy assessment
In ecognition, the reference polygon digitized were used to create a mask for calculation of the error matrix.
5. RESULTS AND DISCUSSION
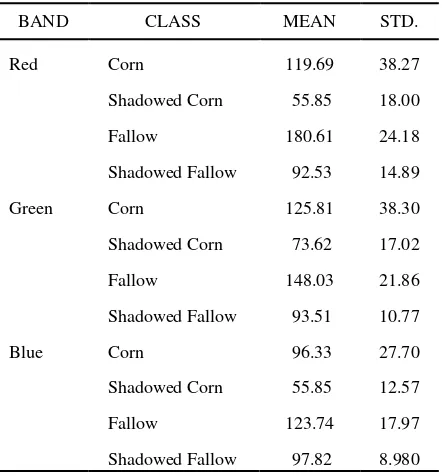
The spectral confusion among different land-covers, and the shadow problem often lead to poor classification (Lu et al, 2010). The spectral properties (mean and standard deviation) were extracted from the RGB (red, green and blue) bands of the shadow and non-shadow areas for various land cover types. Classification of object as shadow and non-shadow is significant to avoid misclassification, since they have different mean and standard deviation value. It was observed that the value of shadowed class has lower mean and standard deviation value. Table 4 shows the mean and standard deviation of the shadow and non-shadow classes for each bands.
BAND CLASS MEAN STD.
Red Corn 119.69 38.27
Shadowed Corn 55.85 18.00
Fallow 180.61 24.18
Shadowed Fallow 92.53 14.89
Green Corn 125.81 38.30
Shadowed Corn 73.62 17.02
Fallow 148.03 21.86
Shadowed Fallow 93.51 10.77
Blue Corn 96.33 27.70
Shadowed Corn 55.85 12.57
Fallow 123.74 17.97
Shadowed Fallow 97.82 8.980
Table 4. The mean and standard deviation of the shadow and non-shadow classes for each 3 Band.
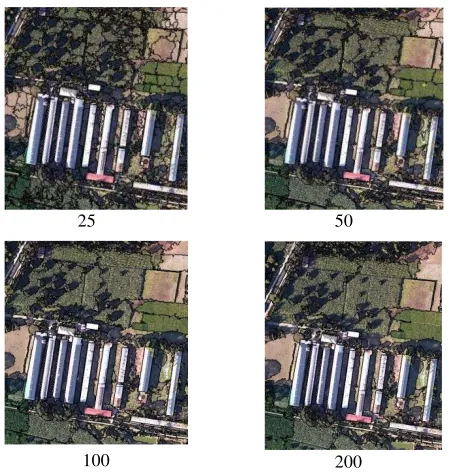
Multi-resolution segmentation algorithm was applied to all segmentation process conducted in this study. Segmentation parameter i.e scale, shape and compactness were applied to construct image objects. The effect of scale parameter on the image objects constructed through segmentation was firstly given to show impacts in terms of size and shape. A subset of the study area showing the different segmentation of the shadowed and non-shadowed area using various scales is shown in Figure 5 for a more detailed view. It can be easily seen that the segments are more distinct in scale of 25 and 50 compare to scale 100 and 200. In general, the higher the scale the larger the object obtained.
LiDAR data and Orthophoto
Generation of Derivatives
LiDAR, orthophoto and Thematic Layer
Inputs
Chessboard Segmentation (Thematic Layer usage
“YES”)
Assign class by thematic layer (water, road and
built-ups)
Multi-threshold segmentation (image object level)
Classified image Multi-resolution
segmentation (image object level)
Training samples from shp. File (shdowed and
non-shadowed class)
Support Vector Machine (SVM) Classification
Accuracy assessment
25 50
Figure 5. The different segmentation of the shadowed and non-shadowed area
The study site was classified into ten land use/cover classes, namely, built-up, roads, mango, corn, fallow, rice, shadowed corn, shadowed fallow and water.
Classification accuracy based analysis was carried out to evaluate the quality of segmentation results. Results showed that the highest classification accuracy was produced using 25 scale parameter while the lowest was produced using 200 scale parameter. The main reason for low classification accuracy are large segments comprising multiple land/use cover types. It was observed that overall accuracies of classification decreased as the values of scale parameter were increasing. In addition, when the scale parameter was set to high values, larger image objects were obtained and lower classification accuracy were obtained (Table 5).
SCALE % ACCURACY
25 98.90
50 92.10
100 92.03
200 90.09
Table 5. Classification accuracies of the four scale parameters
Figure 6 shows the result of 25 scale parameter segmentation. The test site was mainly covered by corn, mango and built-ups.
Figure 6. The result of 25 scale parameter segmentation
6. CONCLUSION
The segmentation scale parameter is one of the essential stages in the image segmentation process. Identification of scale parameter for segmentation is significant for proper classification of shadowed objects. The aim of this study was to classify the shadowed areas correctly without applying any image correction method to remove shadow in the high resolution image. Classification was performed using Support Vector Machine. Results shows that using 25 scale segmentation and incorporating suitable texture classification and object-oriented classifiers, it significantly improved the shadowed area land cover classification and have a high accuracy values as compared to other scale trials used..
The effect of the scale parameter were analyzed by varying its value for both data sets. It should be emphasized that the results obtained are valid only for the data sets considered in this study.
7. ACKNOWLEDGEMENT
We are grateful to the Philippine Council for Industry, Energy and Emerging Technology Research and Development of the Department of Science and Technology (PCIEERD-DOST) for the financial support.
8. REFERENCES
Baatz, M., Schäpe A., 2000. “Multiresolution segmentation: An optimization approach for high quality multi-scale image
segmentation,” in Proc. 12th Angewandte Geographische Informationsverarbeitung, pp. 12–23.
Dare, P.M., 2005. “Shadow analysis in high-resolution satellite imagery of urban areas.” Photogrammetric Engineering & Remote Sensing, 71(2), pp. 169–177.
25 50
Dragut, L., Csillik, O., Tiede, D., 2014. “Automated parameterization for multi-image segmentation on multiple
layers.” ISPRS Journal of Photogrammetry and Remote Sensing, 88, pp. 119-127.
Huang, C., Davis, L., Townshend, R., 2002. “An assessment of support vector machines for land cover classification.”Int. J. Remote Sensing, 23(4), pp. 725–749.
Leblon, B., Gallant, L., Granberg, H., 1996. Effects of shadowing types on ground-measured visible and near-infrared shadow reflectances, Remote Sensing of Environment, 58(3), pp. 322–328.
Li, X., Shao, G., 2014. Object-based land-cover mapping with high resolution aerial photography at a county scale in Midwestern USA.” Remote Sensing, 6(11), pp. 11372-11390.
Lu, D., Weng, Q., 2007. A survey of image classification methods and techniques for improving classification performance, International Journal of Remote Sensing, 28(5), pp. 823-873.
Lu, D., Hetrick, S., Moran, E., 2010. ”Land cover classification in a complex urban-rural landscape with QuickBird imagery.” Photogrammetric Engineering & Remote Sensing, 76(10), pp. 1159-1168.
Shaban, M. A., Dikshit, O., 2001. “Improvement of classification in urban areas by the use of textural features: the case study of Lucknow city, Uttar Pradesh.” International Journal of Remote Sensing, 22(4), pp. 565-593.
Shackelford, A. K., Davis, C.H., 2003. A combined fuzzy pixel-based and object-based approach for classification of high-resolution multispectral data over urban areas. IEEE Trans. Geosci. Remote Sensing, 41, pp. 2354–2363.
Tsai, V.U.D., 2006. “A comparative study on shadow compensation of color aerial images in invariant color models.” IEEE Transactions on Geoscience and Remote Sensing, 44(6), pp. 1661–1671.
Zhou, W., Huang, G., Troy, A., Cadenasso, M. L., 2009.
“Object based land cover classification of shaded areas in high spatial resolution imagery of urban areas: A comparison
study.”Remote Sensing of Environment, 113(8), pp. 1769– 1777.