LOD 1 VS. LOD 2 - PRELIMINARY INVESTIGATIONS INTO DIFFERENCES IN
MOBILE RENDERING PERFORMANCE
C. Ellula,∗
, J. Altenbuchnera
a
Dept. of Civil, Environmental and Geomatic Engineering, University College London, Gower Street, London, WC1E 6BT UK [email protected]
Commission II WG II/2
KEY WORDS:Level of Detail, Performance, Mobile Apps
ABSTRACT:
The increasing availability, size and detail of 3D City Model datasets has led to a challenge when rendering such data on mobile devices. Understanding the limitations to the usability of such models on these devices is particularly important given the broadening range of applications - such as pollution or noise modelling, tourism, planning, solar potential - for which these datasets and resulting visualisations can be utilized. Much 3D City Model data is created by extrusion of 2D topographic datasets, resulting in what is known as Level of Detail (LoD) 1 buildings - with flat roofs. However, in the UK the National Mapping Agency (the Ordnance Survey, OS) is now releasing test datasets to Level of Detail (LoD) 2 - i.e. including roof structures. These datasets are designed to integrate with the LoD 1 datasets provided by the OS, and provide additional detail in particular on larger buildings and in town centres. The availability of such integrated datasets at two different Levels of Detail permits investigation into the impact of the additional roof structures (and hence the display of a more realistic 3D City Model) on rendering performance on a mobile device. This paper describes preliminary work carried out to investigate this issue, for the test area of the city of Sheffield (in the UK Midlands). The data is stored in a 3D spatial database as triangles and then extracted and served as a web-based data stream which is queried by an App developed on the mobile device (using the Android environment, Java and OpenGL for graphics). Initial tests have been carried out on two dataset sizes, for the city centre and a larger area, rendering the data onto a tablet to compare results. Results of 52 seconds for rendering LoD 1 data, and 72 seconds for LoD 1 mixed with LoD 2 data, show that the impact of LoD 2 is significant.
1 INTRODUCTION
The use of 3D City Models on mobile devices (such as smart phones and tablets) underpins applications including utility in-frastructure validation (“call-before-you-dig”), planning (Batty et al., 2001, He et al., 2012, Coors et al., 2009), augmented re-ality (Chen and Chen, 2008), personalized tourist information (Schulte and Coors 2008 in (Boguslawski et al., 2011)), real es-tate sales and 3D navigation (Basanow et al., 2008). Importantly, 3D datasets are now making their way out of the research do-main and into real-life usage. For example, applications such as the identification of illegal residential buildings using heat sens-ing devices (Watson, 2013) and the use of 3D mappsens-ing to assist town planners with noise mapping (Robertson, 2013) highlight the importance of having access to 3D data and being able to in-tegrate the data with other information provided in 2D, as well as display this information in a mobile context to facilitate access when visiting the sites showing illegal dwellings or noisy envi-ronments. The prevalence of these applications is growing with the increase in availability of mobile devices - indeed, there are over 1.08 billion smartphones globally (Alexander, 2012) which compares with 1.2 billion personal computers (PCs). In particu-lar, sales of tablets are forecast to challenge those of PCs by 2017 (Arthur, 2013).
The process of extrusion 2D topographic mapping data to a given height) is an efficient method of creating the 3D datasets required for such applications, in particular where coverage should be city wide and high level of detail - e.g. roof structures - is not required. It results in flat-roofed buildings and also has the advantage of integrating 3D buildings with a 2D footprint (Kada, 2009). In-creasingly, however, more detailed (and realistic) 3D features are becoming available, including full roof structures. Whereas these used to be limited to small blocks or individual buildings result-ing from Computer Aided Design (CAD) models or terrestrial
LiDaR (Light Detection and Ranging) or other scanning, they are now being generated on a more commercial scale.
For both the flat roofs and more detailed 3D structures, the re-sulting 3D data is generally quite large in volume and complex in detail (Glander and D¨ollner, 2008) and thus potentially difficult to visualize in its entirety, in particular on a mobile device.
In order to contribute to the understanding of the performance implications of the varying levels of detail required to underpin different contexts in which 3D City Models are used, this pa-per compares the rendering pa-performance obtained when visual-isng a City Model using flat-roofed 3D buildings and those with more detailed roof structures. We make use of OpenGL ES (Open Graphics Library for Embedded Systems, a commonly used plat-form for 3D rendering in mobile devices) to develop an App for testing on a tablet Android devices.
2 BACKGROUND
2.1 Generating 3D City Models
Extrusion provides an automated method to generate a 3D model - combining 2D topographic mapping with height information de-rived from LiDaR data. This gives a rapid mechanism for gener-ating an entire City Model to LoD 1.
2.1.1 Constructing Level of Detail 2 Models For more de-tailed modelling, it is the semi-automated methods such as pho-togrammetry (Ulm 2003 and Karner 2004 in (D¨ollner et al., 2005)) or manual modeling based on CAD or 3D modeling tools that are required (D¨ollner et al., 2005) and a number of authors have de-scribed approaches for LoD 2 dataset generation: Dollner and colleagues (D¨ollner et al., 2005) describe a process to generate a “smart building” (with continual levels of detail) starting from a block model. Sengul (S¸eng¨ul, 2010) describes a process of gen-erating 3D models using photogrammetric techniques and then converting them to CityGML. A semi-automatic approach that makes use of high resolution satellite imagery is described by (Krauß et al., 2008), although the method is limited to distin-guishing between buildings with flat roofs and those with gabled roofs. The method first creates ortho-photos by combining a Dig-ital Elevation Model with imagery, and then uses a masking ap-proach to identify buildings by classifying them as “high, non-vegetation”. Prieto and colleagues (Prieto et al., 2012) make use of point cloud data captured for individual buildings, along with post-processing using tools such as Google Sketch-up to fill in the gaps that cannot be captured by the scanning process. They also propose a manual approach to associating semantic informa-tion with the resulting 3D features. Kada (Kada, 2009) show the potential of generating a 3D model by cell decomposition, where solids are decomposed into non-intersecting, typically parameter-ized primitives. They then identify roof structures by first gener-ating and then examining the normal vectors of all points inside the same cell. In all cases, these methods are semi-automated, requiring some element of manual intervention.
3 IMPROVING PERFORMANCE - EXAMINING SYSTEM ARCHITECTURE
Research that has been conducted into city modelling for mobile devices is perhaps limited due to the fact that devices have only recently become powerful enough to render 3D graphics. Indeed, mobile computation still faces various limitations, including lim-ited CPU (Central Processing Unit) and memory, the absence or limited performance of graphics accelerators, the absence or lim-ited performance of FPUs (Floating Point Units) and energy con-sumption issues (Nadalutti et al., 2006). When examining any issues related to computing performance, it is important to un-derstand the hardware and software architecture of the system. This understanding leads to the identification of potential bottle-necks in the rendering process and permits optimisation where possible.
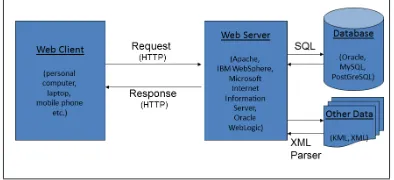
Mobile mapping is generally underpinned by a three-tier archi-tecture (Figure 1), consisting of an end-user device or “client” (which could be a smart phone or tablet) a web server (which sends data to the client and retrieves requests from the client) and a database server, which holds the map and other data to be dis-played (Mitchell, 2008). Based on this architecture, a number of considerations can be taken into account when rendering data on mobile devices: potential bottlenecks include retrieving the data from the database, transmitting the data from server to client over a mobile network (i.e. network bandwidth), and rendering the data on the device using specialist software that takes advantage of any graphics hardware. For each of these stages both hardware and software are important. In general, all through the process, it is important to minimise the amount of data in order to improve performance.
Figure 1: Mobile 3D Mapping Architecture
3.1 Hardware Improvements
Initial research carried out in order to overcome limitations of mobile rendering focussed on hardware (Nadalutti et al., 2006). For example (Woo et al., 2001) produced small graphic acceler-ator chips to allow high performance combined with low power consumption. More recently, many mobile devices have embed-ded graphics chips, increasingly powerful processing units (and multiple cores (NVIDIA Corporation, 2011)) and increased mem-ory permitting improved performance and drawing them closer to the specification of gaming consoles, although battery life re-mains an issue to be solved (Chester, 2013).
Considering the above architecture (Figure 1), and defining ren-dering as the process of taking data representing the real world (i.e. the 3D City Model) and transforming it to a 2D pixel rep-resentation on screen, two main approaches to mobile mapping (including 3D mapping) can be identified - rendering data on the server side and rendering data on the client device. The latter has been made possible by the increasing specification of mobile devices.
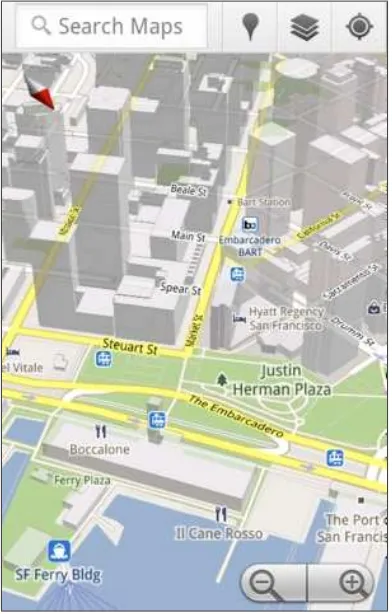
3.1.1 Server Side Rendering For server-side rendering, data processing and rendering takes place on a powerful computer (with performance enhanced by clustering servers and using graph-ics accelerators) (Lamberti et al., 2003) and only the results are sent to the mobile client (Nadalutti et al., 2006, Brachtl et al., 2001), most commonly as an image or “raster”. As with 2D map-ping, a number of providers have generated 3D raster maps for use on mobile devices (see Figure 2 which shows 3D mapping available from Google).
3.1.2 Client Side Rendering When considering architectures where the rendering is carried out on the mobile client, the aim is to keep the graphics as simple as possible in order to achieve satisfactory performance. A number of approaches can be identi-fied. (D¨ollner et al., 2005) briefly review optimization strategies such as view-frustum culling, occlusion culling, and back-face culling that operate on general graphics primitives. Additional approaches to reducing the volume of data to be rendered client-side for a 3D City Model include data compression (van Essen, 2008) and mesh simplification (Sester, 2007).
3.1.3 Combining Server Side and Client Side Approaches
(similar to a GIS, where the user can click on a point to find out information, i.e. a vector map) (Mitchell, 2008) can be achieved by making use of the client-side rendering approaches described above, with, however, the limitation imposed by the hardware on the amount of data that can be rendered, as well as on the amount of data to be downloaded over what is frequently a low bandwidth link.
Hybrid Approaches combine server-side and client-side render-ing, with the aim of limiting data to be served over the network and hence processed for rendering on the client. For example, (Prieto et al., 2012) note the importance of rendering city models on web-based platforms, and describe a process to take a detailed point cloud and transform it into a CityGML database structure. They suggest that the user can be presented with 2D map on which individual 3D buildings can be requested by clicking. The data is then presented as a single building in a customised JSON (JavaScript Object Notation) format (Prieto et al., 2012). Addi-tionally, (Quillet et al., 2006) developed a system that extracts feature lines of building facades on the server side and streams data on demand to the client. The approach forces the point of view to street level. (Ellul, 2012) describes the use of topological data structures to remove shared and hidden internal walls in a model generated by extrusion, rendering the reduced dataset on the client. (Ellul and Joubran, 2012) also tested an aggregation approach, looking at the impact of generalisation on rendering performance in Google Earth.
An additional hybrid approach is proposed in this paper, where the dataset is pre-structured (triangulated) on the server in order to avoid executing a triangulation process on the client device. Common Nodes (x, y, z points) are identified server-side and re-used in order to minimise the size of the dataset for transmission to the client. The proposed approach is described in further detail in Section 5. A hybrid approach requires additional processing overhead on the client side, but has the advantage of interactivity which in turn improves the usability of a 3D mobile application.
4 TEST DATA
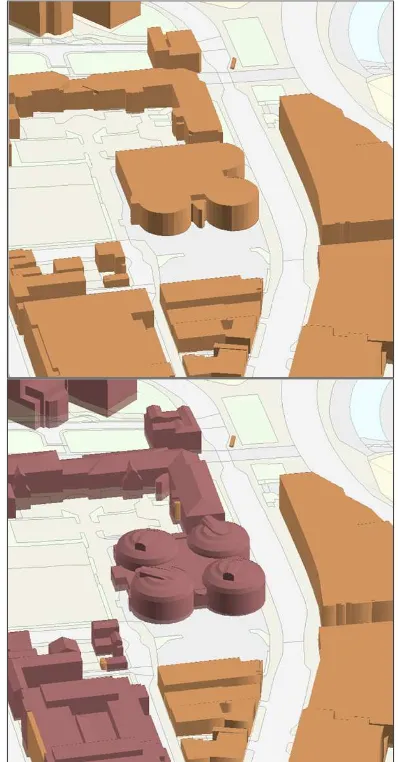
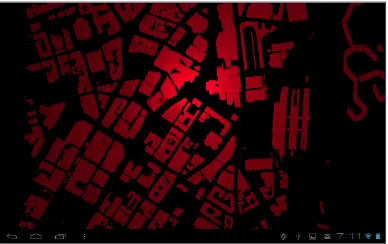
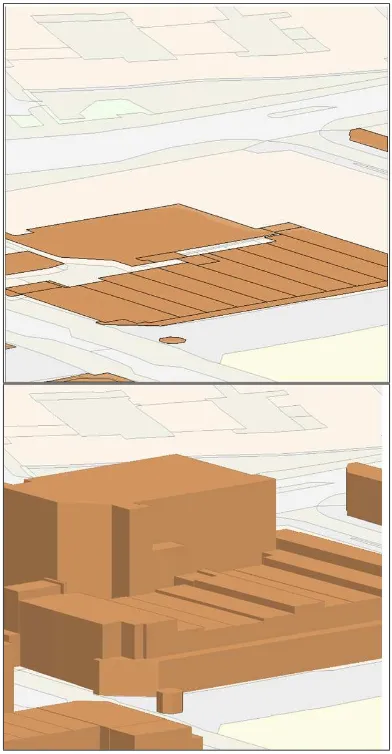
The data used for testing has been provided by the Ordnance Sur-vey (the UK National Mapping Agency) and consists of a 3D dataset for the UK city of Sheffield. The data is based on the Ordnance Survey’s 2D topographic mapping dataset, Mastermap (Ordnance Survey, 2013) and covers an area of approximately 1km by 1km square for Sheffield. Height information is available for all buildings in the city, permitting the data to be extruded to generate LoD 1 buildings. In the center of the city, additional roof details have been added bringing the structures to LoD 2. An extract of this data (showing Mastermap topographic base map-ping) is shown in Figure 3. For the area in the centre of the city shown by the darker buildings in Figure 3, LoD 2 buildings are also available. Figure 4 shows a sample of the LoD 1 and LoD 2 data.
4.1 Summary Dataset Statistics
For testing purposes, two datasets were extracted from the source data. Firstly a dataset covering the entire extent of the city was generated at LoD 1. A second dataset for this area was generated replacing the LoD 1 with LoD 2 data where this was available, again over the entire area. To further examine the impact of LoD 2 data on performance, a smaller subset of data was also created, covering an area of the city where LoD 2 data was almost fully available. Table 1 gives details of the resulting datasets.
Examining the data in more detail, it can be noted that the LoD 2 dataset includes some buildings not present in LoD 1 (Figure
Figure 2: Google’s 3D Raster Mobile Mapping source:http://www.google.co.uk/intl/en/mobile/
maps/3d/tilt.png
Dataset Details Number of Buildings Entire City - LoD 1 1560
Entire City - LoD 1 and 2 1653
Part City - LoD 1 475
Part City - LoD 1 and 21 516
Table 1: Dataset Details - Sheffield
5). In the Figure, the case illustrates a greenhouse (glass house) which was included in the specification for the LoD 2 data but as it was not included in the original LoD 1 dataset as a build-ing it was not extruded. In addition, the LoD 2 dataset has been extended slightly beyond the defined boundary to include two 3D buildings that serve as a test case for LoD 2 data extraction (Figure 3). To the South of the test area, the Moorfoot Build-ing (Wikipedia, 2013) is included - this houses many services offered by Sheffield City Council and is also built with a unique step-pyramid structure. To the North West, “Park Hill” is an un-usually shaped 3D structure and Europe’s largest Grade II listed building (i.e. a building with national conservation importance) (The Park Hill Estate - Europes Largest Grade 2 Listed Building, 2013).
5 IMPLEMENTING THE VISUALISATION ALGORITHM
Figure 3: 3D Dataset for Sheffield, showing LoD 1 data (top) and the mix of LoD 1 and LoD 2 data (bottom)
structuring). The data can then be extracted (queried) from the spatial database using a query language such as SQL, and pre-packaged for transmission as an XML dataset. The extraction and packaging operations can be implemented using a web-based pro-gramming language such as PHP. Once the data is received on the client (mobile device), the XML can then be parsed - i.e. the data elements extracted from the XML file and placed into a the re-quired structure for rendering. As described below (Section 5.2), OpenGL ES only supports data in triangulated format. A num-ber of data preparation stages are therefore required to convert the data into the appropriate format and structure it for rendering. These are described here, followed by a description of Open GL ES and of the implementation of the rendering software itself.
5.1 Dataset Structuring and Transmission
Although it is possible to triangulate the data on the fly in the App itself (Ellul and Altenbuchner, n.d.) given the quantities of data, the first step of the hybrid approach described here is to undertake the triangulation process on the server-side data.
5.1.1 Loading the Dataset into Oracle Spatial The dataset is provided in ESRI Shapefile Multi-Patch format (ESRI, 2013) and is then transformed into Oracle’s Spatial Database Format (the Oracle database is used to serve the data to the test App). As part of this transformation, the dataset is fully triangulated, as required by OpenGL ES (Whitrow, 2008). Although the Multi-Patch format does partially triangulate the data - specifically the
Figure 4: Comparing LoD 1 (top) and LoD 2 data (bottom) for the same buildling
walls of the building are triangulated - in the case of a standard extrusion process the roof and floor structure are stored as “geom-etry rings” and not suitable for rendering in OpenGL ES (ESRI, 2013). The “Feature Manipulation Engine” (FME) software from SafeSoft (SAFE Software, 2013) was used to first triangulate the data by converting it to Autodesk 3D Studio format, and then to import the resulting triangulated features into Oracle Spatial (Oracle, 2013b). Once imported into the database, the data was re-structured in preparation for visualisation.
Figure 5: An example of an LoD 2 building (a glasshouse, bot-tom) not included in the LoD 1 dataset (top)
in the example in Table 2 and Table 3. Additional tables link the individual triangles back to the buildings.
Table 4 gives a summary of the resulting triangulated datasets, providing a first insight into the impact of LoD 2 data - the num-ber of Nodes for the full LoD 1 and 2 mixed dataset is 1.4 times that for the LoD 1 dataset and for the part dataset, this rises to 1.6. The number of triangles for the full dataset at LoD 1 and 2 is 1.37 times that for the LoD 1 data, and for the smaller test dataset this rises to 1.56.
5.2 OpenGL ES Rendering
The cross-platform and cross-language graphics Application Pro-grammers Interface (API) OpenGL (Open Graphics Library) is a software interface to graphics hardware (McReynolds and Blythe, 2005). OpenGL has several specifications for various purposes. Of relevance here is OpenGL ES, which is commonly imple-mented for mobile devices . Key features were removed from
Node ID X Value Y Value Z Value
1 435713.69 387269.31 55.43
34 435731.06 387260 54.22
35 435770.31 387249.75 52.36
Table 2: Node Table Structure
Node ID Triangle ID Node Order
1 1 1
34 1 2
35 1 3
Table 3: Index Table Structure
Dataset Number of Buildings
Number of Triangles
Number of Individual Nodes
Entire City - LoD 1 1560 81236 38055 Entire City - LoD 1
and 2
1653 115937 55135
Part City - LoD 1 475 24349 11421 Part City - LoD 1
and 2 Part
516 37993 18202
Table 4: Pre-Triangulated Data Structure, Optimised for Visuali-sation
OpenGL for this implementation (Anyuru, 2012)- in particular OpenGL ES only allows triangle-based surface primitives and excludes quad, quadstrip or polygon primitives. Triangles make hardware algorithms simpler and faster, as they are always con-vex and planar (Cozzi and Ring, 2011).
Figure 6: Rendering Pipeline after (Zechner and Green, 2011)
Figure 6 (after (Zechner and Green, 2011)) shows the path of a dataset through the rendering process in OpenGL ES. For stan-dard rendering, themodellingsoftware first generates a triangle mesh, which defines the shapes of the objects, and their attributes, colours, textures. Using the hybrid approach here, this is done on the server. Once transmitted, the client-side software the collates the triangles into an OpenGL readable structure (arrays contain-ing the triangle points and index arrays describcontain-ing how these are used to describe the objects to be rendered). The data structure enables OpenGL to reuse the same vertex for several triangles, reducing memory requirements on the device.
Once the data is correctly structured into arrays, a process of translation and scaling is required to ensure the 3D City Model is visible. The dataset is also scaled to ensure that the ratio be-tween the X and Y extents matches the width:height ratio of the device (i.e. that the resulting data is not distorted). Data is then projected into a 2D coordinate system for display on screen, with an orthographic projection avoiding foreshortening (Smithwick and Verma, 2012) by disregarding the effect of vanishing points and applying a one to one correspondence between the real world units and the pixel positions on screen. This method is widely used for engineering applications (Whitrow, 2008).
again, to move from scaled real world coordinates into the screen coordinate system. The data is then ready for the final stage in the process- rasterization, which converts the data into pixels on screen (Zechner and Green, 2011).
The rendering process thus involves a number of structuring and transformation processes. It can be expected that a more com-plex, detailed, datasets will slow down performance.
5.3 The Implemented Rendering Process
The Android device selected for testing is an Acer Iconia 10-inch tablet, having a screen size of 800 by 1280 pixels, and a Dual Core, 1GHz processor, with 1GB of RAM, running Android Ver-sion 3.2.1. As described above, for the first part of the rendering process, PHP code, combined with SQL queries, is used to gen-erate three datasets, which are served to the Java Android App as tagged XML:
1. An ordered list of Nodes, containing the X, Y and Z coordi-nates for each Node
2. An ordered index list, describing how the Nodes form the triangular Faces used for rendering
3. A short list detailing the geometrical extents of the dataset -i.e. the minimum bounding volume. This is used to ensure that the resulting data is centred on the device’s screen when rendered.
Traditionally, the XML may be generated by iterating through each row of the dataset, generating the required tagged data us-ing strus-ing concatenation commands. However, Oracle offers both “XMLAGG” - which aggregates all rows of a query into one doc-ument - and the “XMLEMENT” - which wraps individual data items in XML tags - query statements to automatically generate a full XML document from a dataset without the need for iteration (Oracle, 2013a).
Once the XML data is parsed on the client device, it then passes through the OpenGL rendering pipeline described above. To trans-form the real-world coordinates (which are in British National Grid) into values appropriate for display, the initial screen coor-dinate system was set up with its origin (0,0,0) in the centre of the viewport. The real world coordinate values of the imported build-ings are then transformed into screen coordinates by finding the centre point of each axis for the dataset (e.g. (xmax + xmin)/2) and then translating the dataset by the respective distance along the negative x and y. The z-axis is shifted upwards. For the sec-ond and third steps of the rendering process, OpenGL ES uses the bounding coordinates of the dataset to project the 3D trian-gles into 2D space and to set clipping boundaries, which in the case of this project are set to the extents of the dataset. The near and far clipping planes were set to 1000 and -1000 in order to avoid clipping when the user pans the objects in the z-direction. Projection is set to be orthographic.
Time measurements are taken at various stages through the pro-cess and written to the device as a CSV file in order to permit performance comparisons.
6 RESULTS
In total ten rendering time measurements were carried out for each of the four test datasets. The results were then averaged for each dataset. Figure 7 shows the resulting rendering times, with
Figure 7: Rendering Results for All Datasets
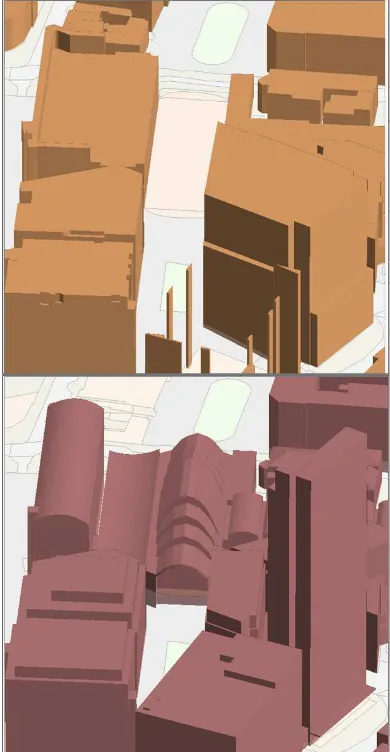
Figure 8: Sheffield - LoD 1 Dataset - Aerial View
Figure 9: Sheffield - LoD 1/2 Dataset - Aerial View
Figure 10: Sheffield - LoD 1 Dataset - City View
time (in milli-seconds) given in Table 5. Figures 8, 9, 10 and 11 show the resulting rendered datasets.
tim-Figure 11: Sheffield - LoD 1/2 Dataset - City View
Dataset Import XML
Parse XML
Setup Mesh
Total Time
LoD 1 All 8209 34127.2 10807.1 53213.3 LoD 1 and
LoD 2 All
9981.8 39714.8 21221 70967.4
LoD 1 Part 4674.9 7340.9 2195.4 14237.3 LoD 1 and
LoD 2 Part
7213.6 12156.8 3492.1 22888.2
Table 5: Results - All Times in milliseconds
ing (e.g. to change activity from download to rendering), and all times are measured in milli-seconds.
7 DISCUSSION AND FURTHER WORK
The results obtained, and in particular the overall rendering time of 52 seconds for the LoD 1 data and 72 seconds for the mixed LoD 1 and 2 data, highlight the potential of the hybrid approach for 3D City Model rendering, where part of the dataset restruc-turing is carried out as a pprepared dataset on the server, re-ducing the computational effort (and specifically the triangula-tion process) required on the mobile device. In additriangula-tion, the re-sults bring to the fore the importance of selecting an appropriate dataset for rendering and visualisation on mobile devices, with the mixed LoD 1/2 dataset covering the entire Sheffield area tak-ing 1.3 times longer to render than the LoD 1 dataset. This in-creases to 1.6 times when the smaller, mostly LoD 2, dataset is considered.
For all the four datasets, the parsing of the XML constitutes a significant proportion of the overall rendering time (between 50 and 64%). However, the significance of the dataset import time (i.e. the time to download the dataset from the server) varies -for the larger dataset, it is approximately 15% of the overall time, rising to 31% for the smaller datasets. Some of this variation may be due to varying network bandwidth, which was not measured separately and may also be a bottleneck for performance. Con-versley, mesh set-up time (i.e. the time to convert the downloaded data into the required OpenGL arrays - amounts to approximately 25% for the larger dataset, but only 15% for the smaller datasets. Considering the number of triangles, for the mixed datasets (LoD 1 and LoD 2, both full and partial) the data is represented by around 70 triangles per building. This is reduced to around 51 for the LoD 1 dataset. Figure 12 shows these ratios.
Some considerations should be made when reviewing these re-sults. As noted above, there were a number of additional build-ings included in the LoD 2 datasets that did not form part of the LoD 1 data - this will have resulted in a slightly increased overall
Figure 12: Node and Triangle to Building Count Ratios
rendering time for the LoD 1/2 tests, as well as increased num-bers of nodes and triangles. The triangulation algorithm used to prepare the datasets was that provided by Safesoft’s FME product (SAFE Software, 2013) and may have generated a larger number of triangles than would be produced using other methods.
Figure 13: An extract of the Sheffield Dataset showing that Inter-nal Walls are also Rendered
that the triangles are de-coupled from the original data, meaning that changes in the latter will not be reflected. The “Ear Clipping” triangulation algorithm is a simple and robust algorithm which works well for geospatial polygons (Cozzi and Ring, 2011). It is underpinned by an assumption that the polygons which repre-sent the building roofs in spatial datasets are “simple polygons” (i.e. do not have internal holes or self-intersections), iterating around the Nodes making up the polygon removing each trian-gular “ear” as it goes. Triggers could be developed inside the Oracle database to automatically re-triangulate the data when the underlying buildings change.
An additional dataset for the UK city of Newcastle is available and should be used to validate the results obtained for these pre-liminary tests. In addition, having access to additional data will permit further investigation into the ratios of Nodes and Triangles present in LoD 1 and LoD 2 buildings. As can be seen in Figure 3 the data is currently very much intermingled, which makes sepa-rating out the different LoD buildings difficult in a 3D context as the required spatial queries are not available due to the lack of a Spatial Reference ID for 3D British National Grid data in Oracle. Spatial queries in 2D could be used to overcome this issue.
The results do show a significant difference in rendering time with increasing level of detail - but they also highlight that ren-dering a city-wide dataset at LoD 1 can be slow - 53 seconds not being considered acceptable response time in a web-based situation (Marsh and Haklay, 2010). Further work is thus re-quired on both server-side and client-side aspects of rendering, perhaps combining the work described here with additional pre-preparation of datasets and implementation of the techniques de-scribed in Section 3 such as data compression (van Essen, 2008) and mesh simplification (Sester, 2007) over a block of buildings to test for optimal performance. Techniques to reduce the vol-ume of transmitted data and the time required to parse this data could also be considered - for example, (Crockford, 2006) pro-poses Javascript Object Notation (JSON) as a smaller footprint data transmission mechanism.
The adequacy of 3D detail, the visual impact of the resulting 3D dataset, the suitability of the response times and the overall us-ability of the 3D model is, perhaps, more subjective and will de-pend on the specific application for which the 3D City Model is to be used i.e. the context of use (Kjeldskov and Graham, n.d.). For example, definitions such as “an application should respond within 2 seconds to provide users with a feeling of interactiv-ity” cannot be applied universally and in mobile applications, 2 seconds is too long for an application that communicates with a driver (Marsh and Haklay, 2010). The scale at which the data is visualised is a second factor to consider. The source dataset contains a very high level of detail with buildings subdivided into smaller elements where roof height varies. This detail may be useful, for example, in a planning context, for large scale map-ping. However, when a larger extent of the dataset is viewed (as in Figure 8 and Figure 9 above) the detail perhaps appears to “clutter” the map and the more simple lines of an aggregated and simplified dataset could be said to be more visually appealing, without significant loss of detail or general shape of the overall city. An aggregated dataset may, therefore, be suitable for visu-alising data at a smaller scale for example, to visualise 3D air quality distribution across a city. Therefore the methods devel-oped should be extended to make better use of the web-based ap-proach to querying and downloading data, dynamically tracking the user’s interaction with the data and retrieving detailed (LoD 2) data only when the user is zoomed in.
More generally, the datasets used for this test, the multiple meth-ods used to generate 3D data, the increasing availability of
Build-ing Information Models (BIM, which go beyond LoD 4 to model a digital representation of physical and functional characteristics as a shared resource to be used throughout a building’s life-cycle (Smith, 2011), and are now becoming mandatory in large gov-ernment construction in the UK (Ngo, 2012)) and the wide range of potential applications that make use of 3D mobile mapping and City Models all highlight the fact that it is unlikely that users will be working with or require a dataset composed of a single level of detail - indeed, as discussed above the detail should be adapted to the specific application and context of use. This in turn highlights the requirement for further investigation into the specific detail and model sizes (number of Triangles and Nodes) generated when using the each of the methods described in Sec-tion 2.1.1 to generate 3D data. The potential of 3D generalisa-tion to provide more context (applicageneralisa-tion) specific data and to address performance issues on mobile devices should also be in-vestigated, to ensure that the data provided is contextually ap-propriate and presented at a scale that is relevant while meeting expected performance.
8 ACKNOWLEDGELMETNS
The authors would like to thank the Ordnance Survey for the use of both the LoD 1 dataset (Mastermap Topographic Mapping) and the LoD 2 dataset for the Sheffield and area of the UK. Additional thanks go to Safe Software for the use of FME (SAFE Software, 2013).
REFERENCES
Alexander, A., 2012. Smartphone usage statistics 2012.
Anyuru, A., 2012. Professional WebGL Programming: Develop-ing 3D Graphics for the Web. Wrox.
Arthur, C., 2013. Tablets will challenge pc sales by 2017 as an-droid passes ipad, says idc.
Basanow, J., Neis, P., Neubauer, S., Schilling, A. and Zipf, A., 2008. Towards 3d spatial data infrastructures (3d-sdi) based on open standardsexperiences, results and future issues. In: Ad-vances in 3D Geoinformation Systems, Springer, pp. 65–86.
Batty, M., Chapman, D., Evans, S., Haklay, M., Keupers, S., Shiode, N., Hudson Smith, A. and P, T., 2001. Visualising the city: Communicating urban design to planners and decision-makers. Planning Support Systems, Models and Visualisation Tools pp. 405 – 443.
Boguslawski, P., Gold, C. and Ledoux, H., 2011. Modelling and Analysing 3D Buildings with a Primal/Dual data struc-ture. ISPRS Journal of Photogrammetry and Remote Sensing 66, pp. 188–197.
Brachtl, M., ˇSlajs, J. and Slavık, P., 2001. Pda based naviga-tion system for a 3d environment. Computers & Graphics 25(4), pp. 627–634.
Chen, J. and Chen, C., 2008. Foundations of 3D Graphics Pro-gramming: Using JOGL and Java3D, 2nd Edition.
Chester, E., 2013. Next generation mobile processors will out-perform PS3 and Xbox 360.
Coors, V., H¨unlich, K. and On, G., 2009. Constraint-based generation and visualization of 3D city models. In: 3D Geo-Information Sciences, Springer, pp. 365–378.
Crockford, D., 2006. JSON: The fat-free alternative to XML.
D¨ollner, J., Buchholz, H., Brodersen, F., Glander, T., J¨utterschenke, S. and Klimetschek, A., 2005. Smart Buildings–A concept for ad-hoc creation and refinement of 3D building mod-els. In: Proceedings of the 1st International Workshop of 3D City Models, Bonn, Germany.
Ellul, C., 2012. Can Topological Pre-Culling of Faces Im-prove Rendering Performance of City Models in Google Earth? Progress and Trends in 3D GeoInformation Sciences -Lecture Notes in Geoinformation and Cartography pp. 133–154.
Ellul, C. and Altenbuchner, J., n.d. Investigating Approaches to Improving Rendering Performance of 3D City Models on Mo-bile Devices, Manuscript Under Review. GeoSpatial Information Science.
Ellul, C. and Joubran, J., 2012. Preliminary investigations into the potential of improving rendering performance of 3D datasets using 2D generalisation. In: Usage, Usability, and Utility of 3D City Models-European COST Action TU0801, Proceedings of the conference held 29-31 October, 2012 in Nantes, France. Edited by Th. Leduc, G. Moreau, and R. Billens, id. 03005, 7 pp., Vol. 1, p. 03005.
ESRI, 2013. The multipatch geometry type. http://www.
esri.com/library/whitepapers/pdfs/multipatch-geometry-type.pdf.
Glander, T. and D¨ollner, J., 2008. Techniques for generalizing building geometry of complex virtual 3d city models. In: Ad-vances in 3D Geoinformation Systems, Springer, pp. 381–400.
He, S., Moreau, G. and Martin, J.-Y., 2012. Footprint-based 3d generalization of building groups for virtual city visualization. In: GEOProcessing 2012, The Fourth International Conference on Advanced Geographic Information Systems, Applications, and Services, pp. 177–182.
Kada, M., 2009. The 3d berlin project. In: Photogrammetric week, pp. 331–340.
Kjeldskov, J. and Graham, C., n.d. A review of mobile HCI re-search methods.
Kolbe, T. H., Gr¨oger, G. and Pl¨umer, L., 2005. CityGML: In-teroperable access to 3D city models. In: Geo-information for disaster management, Springer, pp. 883–899.
Krauß, T., Lehner, M. and Reinartz, P., 2008. Generation of coarse 3D models of urban areas from high resolution stereo satellite images. The International Archives of Photogrammetry, Remote Sensing and Spatial Information Sciences 37, pp. 1091– 1098.
Lamberti, F., Zunino, C., Sanna, A., Fiume, A. and Maniezzo, M., 2003. An accelerated remote graphics architecture for pdas. In: Proceedings of the eighth international conference on 3D Web technology, ACM, pp. 55–ff.
Marsh, S. and Haklay, M., 2010. Evaluation and deployment.
McReynolds, T. and Blythe, D., 2005. Advanced graphics pro-gramming using OpenGL. Morgan Kaufmann.
Mitchell, T., 2008. Web mapping illustrated: Using Open Source GIS toolkits. O’Reilly Media.
Nadalutti, D., Chittaro, L. and Buttussi, F., 2006. Rendering of x3d content on mobile devices with opengl es. In: Proceedings of the eleventh international conference on 3D web technology, ACM, pp. 19–26.
Ngo, M. H., 2012. UK Construction Industrys responses to Government Construction Strategy BIM deadline and applications to civil engineering education. https:// workspace.imperial.ac.uk/civilengineering/Public/ technicalpapergroupA/18A-Ngo-UKConstructionInd.
ResponsestoGovernmentConstructionStrategy2.pdf.
NVIDIA Corporation, 2011. The Benefits of Quad Core CPUs in Mobile Devices. http://www.nvidia.co.uk/content/PDF/
tegra_white_papers/tegra-whitepaper-0911a.pdf.
Oracle, 2013a. Generating XML Data from the Database.
http://docs.oracle.com/cd/B28359_01/appdev.111/
b28369/xdb13gen.htm.
Oracle, 2013b. Oracle Spatial and Oracle Locator.
http://www.oracle.com/uk/products/database/
options/spatial/index.html.
Ordnance Survey, 2013. Ordnance Survey Mastermap. http:
//www.ordnancesurvey.co.uk/oswebsite/products/os-mastermap/index.html.
PhotoSynth, 2012. About photosynth. http://photosynth.
net/about.aspx.
Prieto, I., Izkara, J. and Delgado, F., 2012. From point cloud to web 3D through CityGML. In: Virtual Systems and Multimedia (VSMM), 2012 18th International Conference on, IEEE, pp. 405– 412.
Quillet, J.-C., Thomas, G., Granier, X., Guitton, P. and Marvie, J.-E., 2006. Using expressive rendering for remote visualization of large city models. In: Proceedings of the eleventh international conference on 3D web technology, ACM, pp. 27–35.
Richmond, P. and Romano, D., 2008. Automatic generation of residential areas using geo-demographics. In: Advances in 3D Geoinformation Systems, Springer, pp. 401–416.
Robertson, A., 2013. 3D city planning tool maps noise pollution as visible data. http://www.theverge.com/2012/4/2/
2920286/3d-city-planning-tool-noise-pollution-fraunhofer-institute.
SAFE Software, 2013. FME - Break Down the Barriers to Using and Sharing Data.
http://www.safe.com/fme/fme-technology/.
S¸eng¨ul, A., 2010. Extracting semantic building models from aerial stereo images and conversion to citygml.
Sester, M., 2007. 3d visualization and generalization. In: Pho-togrammetric Week, Vol. 7, pp. 03–09.
Smith, M., 2011. BIM in construction. National Building Specification (NBS).http://www.thenbs.com/topics/bim/
articles/bimInConstruction.asp.
Smithwick, R. and Verma, M., 2012. Pro OpenGL ES for An-droid. Apress, New York,.
The Park Hill Estate - Europes Largest Grade 2 Listed Building, 2013. http://www.bbc.co.uk/learningzone/clips/the-
park-hill-estate-sheffield-europes-largest-grade-2-listed-building/6427.html.
Tse, R., Gold, C. and Kidner, D., 2008. 3D City Modelling from LiDaR Data. In: Advances in 3D Geoinformation Systems, Springer, pp. 161–175.
Wang, L. and Sohn, G., 2011. An integrated framework for re-constructing full 3d building models. In: Advances in 3D Geo-Information Sciences, Springer, pp. 261–274.
Watson, L., 2013. Council spends 24,000 on spy plane with thermal imaging cameras to catch immigrants living ille-gally in ’sheds with beds’. http://www.dailymail.co. uk/news/article-2346759/Council-uses-spy-plane-
thermal-imaging-cameras-catch-immigrants-living-illegally-garden-sheds.html.
Whitrow, R., 2008. OpenGL graphics through applications. Springer, New York,.
Wikipedia, 2013. http://en.wikipedia.org/wiki/
Moorfoot_Building.
Woo, R., Yoon, C.-W., Kook, J., Lee, S.-J., Lee, K., Park, Y.-H. and Yoo, Y.-H.-J., 2001. A 120 mW embedded 3D graphics rendering engine with 6 Mb logically local frame-buffer and 3.2 GByte/s run-time reconfigurable bus for PDA-chip. In: VLSI Circuits, 2001. Digest of Technical Papers. 2001 Symposium on, IEEE, pp. 95–98.