A COMPARATIVE STUDY ON UTILIZATION OF MULTI-SENSOR SATELLITE DATA
TO DETECT POTENTIAL FISHING ZONE (PFZ)
B. Balaguru, S.S. Ramakrishnan, R.Vidhya, P.Thanabalan
Institute of Remote Sensing, Anna University, Chennai, Tamil Nadu, India [email protected]
Commission VI, WG VI/4
KEY WORDS: PFZ advisories, Satellite Oceanography, Chlorophyll- a concentration, SST, EKE, SSHA, VGPM
ABSTRACT:
The satellite oceanography reveals the rolls on Potential Fishing Zone (PFZ) advisories in India is limited by the availability of the satellite data during the cloudy days and for the cloudy areas, because of the inability of the passive sensors to pass through the clouds. However, there is a huge demand from the fishermen community to provide PFZ advisories on cloudy days / monsoon period also as the period corresponds to the peak fishing season. Keeping in view of the demand and availability of the optimally interpolated merged product from Altimetry, it is proposed to utilize 4 km SST product obtained from the AVHRR. In view of this, a comparative analysis has been carried out on the feasibility of utilization of the Altimetry product for identification of PFZ Advisories. The analysis is carried out the synergize study on existing in AVHRR SST product are really matching with the high resolution EKE and SSHA products derived from Altimetry. From the analysis it was found that the Altimetry product is suitable for identifying cold core generation of waters for PFZ advisories with certain limitations. Also persistence of the ocean color environmental variables is cross-verified with catch weight observed from In-situ observation. The overall analysis derived from ocean color and altimetry products for delineating potential fishing zones enhance flawless information for future research.
1. INTRODUCTION
Satellite remote sensing of the earth has improved our knowledge of oceanographic phenomena at different spatial and temporal scales compared to our early ship and buoy platforms. The scope of marine studies in time and space are widened with the help of Geographic Information System (GIS) and different remotely-sensed imagery. Analyses of remotely-sensed data and fisheries data under GIS environment have facilitated illumination of fundamental relationship between marine biota and their oceanic environment. In developing countries like India, the food requirements of an expanding human population have increased the pressure on fishery resources. In ocean, various physical, biological, and chemical parameters play vital roles in aggregation and migration of fishes. Most studies suggested that in India, satellite derived parameters like Sea Surface Temperature (SST) and sea surface chlorophyll concentration (Chl-a) have been used to study the relationship between physical and biological process in the sea and its impact on Potential Fishing Zone (PFZ). Indian National Centre for Ocean Information Services (INCOIS) in India is delivering the PFZ advisories three days per week using SST derived from NOAA-AVHRR and Chl-a derived from MODIS-Aqua satellites. However, important question remains concerning that, detection of area of high biological activity identified from suitable remote sensing parameters. In such scenario, Net Primary Production (NPP) was examined to assess the productivity of the fishing grounds (Behrenfeld et.al.1997). There are multiple number of algorithms are available to estimate Net Primary Production (NPP). The vertically Generalized Production Model (VGPM) estimates NPP using Photosynthetically Available Radiation (PAR) and chlorophyll, an estimate of the euphotic zone depth and a temperature dependent estimate of the maximum photosynthetic rates (Behrenfeld et.al.1997).The results
exhibit that, net primary Production (NPP) as one of the key parameter is made for comparison with available fish catch data for accessing fish stocks. The meso-scale variability in the oceans revealed from satellite altimetry data describes, the exchange of nutrients and heat in the oceans are cohesive, which influence productivity of contagious water masses and by propagation the marine biota connected with them. Therefore in time scales, movement of meso-scale features can also impact on fish catches (Mugo et.al. 2011). Tracking such meso-scale features by satellite remote sensing technology can provide information on ocean circulations and corresponding biotic interaction with them. In the present study Sea Surface Height Anomaly (SSHA) and Eddy Kinetic Energy (EKE), derived from geostrophic velocities to identify other possible highly productive marine systems such as eddy fields, around fishing grounds. The objective of this study on feasibility on utilization of both optical and altimetry products to validate fishery forecast using multi-sensor satellite derived parameters such as SST, Chl-a, NPP, SSHA, EKE and fish catch data. The preliminary results of the fishery forecast have been discussed in this paper.
2 DATA AND METHODS
2.1Sea Surface Height Anomaly Data
Gridded SSHA maps are constructed by merging two sets of source data (Topex/Poseidon and ERS-1/2), and ( Jason-1 and Envisat satellite altimeters). The gridded weekly SSHA data having a spatial resolution of (1/3°×1/3°) downloaded from the Archiving, Validation and Interpretation of Satellite Oceanographic Data (AVISO) during the period 1998-2003. The weekly data are averaged to compute monthly composite images using Basic Radar Altimetry Toolbox (BRAT). To match spatial resolution of other environmental parameters, the resampling technique was applied using Arc GIS 9.3 software.
2.2 Eddy Kinetic Energy (EKE)
The EKE is defined as 1/2(u2/v2) where u and v are meridional and zonal time-varying geostrophic currents associated with SSHA respectively (Sharma et.al. 1999). Although for each overpass only the cross-track component of the eddy velocity field is measured, the EKE can be based on the square of this value, averaged over the resolution cell of the final EKE product, as long as the eddies are assumed to be isotropic (having no preferred orientation. The geostrophic velocity anomalies are calculated from gridded SSHA maps using the
∂η/∂y the north-south gradient of geostrophic current; and ∂η/∂x the east-west gradient of geostrophic current. Above computed EKE was resampled into 9km× 9km resolution and applied subset to the study area to match spatial resolution of SeaWiFS sensor.
2.3Net Primary Production
Monthly Net Primary Production (NPP) was computed for this study using Vertically Generalized Production Model (VGPM), original formula of VGPM was written by (Bahrenfeld, et.al.1997). VGPM model calculates NPP using relationship between surface chlorophyll-a concentration and depth-integrated euphotic depth primary production (). The inputs for this model are NOAA-AVHRR SST, SeaWiFS Chlorophyll concentration and Photosynthetically Active Radiation (PAR) level 3.
2.4Sea Surface Temperature
Advanced High Resolution Radiometer (AVHRR) is the most successful and widely used IR sensor onboard National Oceanic and Atmospheric Administration (NOAA) series of satellites used for SST calculation. It has five spectral bands and the scanner has an IFOV of approximately 1.3m rads and cross-track scan of ±55.4° with a nominal height of 833km and the ground FOV at nadir are 1.1km and swath width about 2400km. The orbital period is about 102 min and 14 orbits are completed per day. The channel and their characteristics are shown in table.1. In the present study, NOAA AVHRR-SST monthly composite images are resampled to match resolution of SeaWiFS sensor.
4 10.3-11.3µm Night cloud mapping, SST
5 11.5-12.5µm SST
2.5Chlorophyll Data
The Chl-a data was obtained from Sea viewing Wide Field Sensor (SeaWiFS) radiometer onboard orbit with an altitude of 705km and has 8 spectral bands. Its characteristics are shown in Table.2. In the study Global Area Coverage (GAC) monthly composite data with a spatial resolution of about ~ 9km×9km for study period has been used.
Table2: Characteristics of SeaWiFS spectral
2 443 Chlorophyll absorption
3 490 Pigment absorption
4 510 Chlorophyll absorption
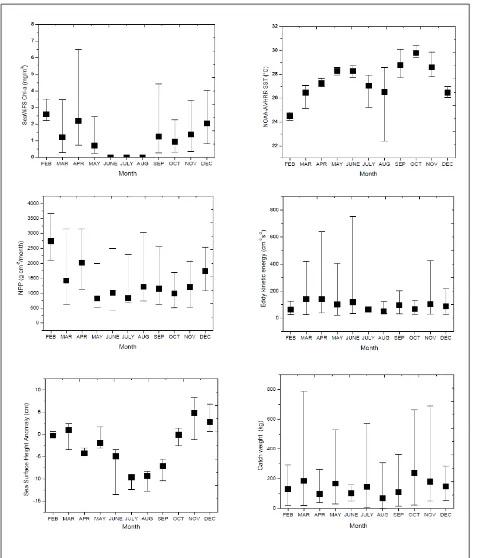
5 555 Pigments, optical weight is observed to be low during summer (May-October) and was found that, there is an inverse proportion of relatively higher SST and lower surface chlorophyll-a concentration. A linear combination of both Chl-a and SST improves fish catch is studied during the month of April year 1998 -2003, particularly in the year 2000. In this year, fish catch were carried out in relatively warm SST varying from (27°C-28°C) [24°C±28°C] as shown in Figure (3.2). and relatively high Chlorophyll-a concentration was observed ranging from (1 to 2.5 mg/m3)[0.7±6.5mg/m3] from its minimum and maximum extent as shown in Figure (3.1). NPP was observed to have two peaks in February and April during the year 2000. The average amount of NPP was obtained in the month of April ranging with NPP levels of (1200 to 1500g/cm2/month) [1200±3200 g/cm2/month] from its minimum and maximum extent as shown in Figure (3.4). Similarly on broad scale the SSHA was positive during winter-monsoon months and negative during summer monsoon months as shown in Figure (3.5). In accordance with Arabian Sea produce biologically rich areas for commercially important fishes. Ocean colour from space provides a measure of the areas of enhanced biological production which occurred at the fronts, topographic structures, upwelling and eddies. It is observed that the transition zone off Gujarat coast has high primary productivity rates based on satellite derived The International Archives of the Photogrammetry, Remote Sensing and Spatial Information Sciences, Volume XL-8, 2014
measurements. The location where high fish catches has been witnessed appears to be linked with the physical features, which probably controls the Net Primary Production levels (Mukthi Zainnuddin et.al.2006). Proxy environmental variables such as SST and Chl-a are the primary indicators in fishery resources. The other mesoscale features found on SST and Chlorophyll were fronts, meanders, rings, eddies, upwelling and mushroom shaped features etc. These features indicate nutrient enriched areas that lead to high biomass production. Thus multi-sensor data from different remotely sensed satellites provides powerful tool to study environmental parameters dynamically. In accordance with the study area, multi-sensor data has been utilized for better understanding the PFZ in the coastal water off Gujarat.
Present study describes the innovative potential hot spots identification techniques for high fish catch areas by considering different environmental variables (i.e, SST, Chl-a) combined with altimetry variables (EKE, SSHA). From the study it inferred that high fish catches are not randomly distributed but relatively to environmental conditions in Ocean. In general high fish catch weight was observed in April month (1998-2003) in areas with specific combination of Chl-a and SST. Certainly these require future investigations. In general cool water is the indicator of high nutrients the probability of findings fishes is greater than for stratified warm water, which shows that there is a inverse relationship between Chlorophyll and SST (H.U.Solanki et.al 1997). Our study also confirms there is inverse relationship as suggested in previous research findings.
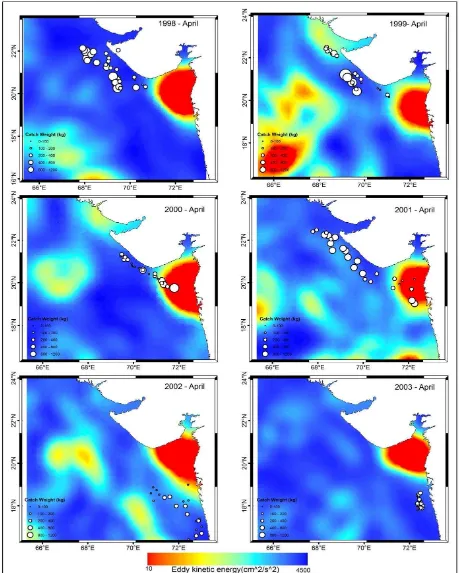
NPP is a parameter which defines the distribution high fish catches. Wherever NPP is high the probability of finding fish catch at that place is high and vice versa. The altimeter derived products emphasize, changes in physical and biological interactions and these data are very useful to find out mesoscale variability that feeds high primary productivity. These parameters act as secondary indicators of frontal areas that shows high fish catches. Our findings shows that high fish catches were concentrated in areas with relatively high EKE and geostrophic velocities. This suggests that fish catches also influenced by eddy field and these fields are examined by using altimeter derived products.
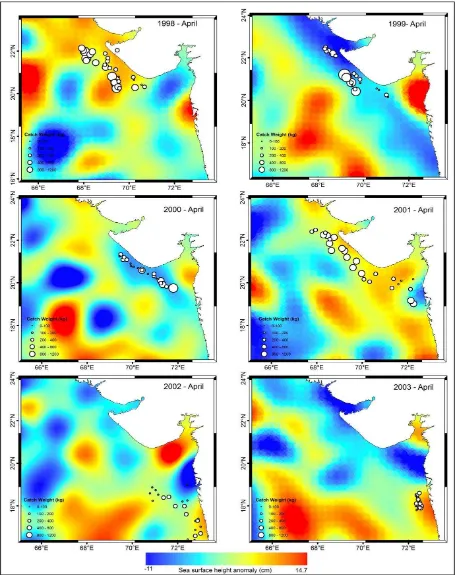
The positive SSHA are shown as green to red which is likely to indicate presence of warm core eddies and dark blue to purple area indicates negative anomalies which represent cold core eddies as shown in figure (3.5). The distribution of high fish catch is associated predominantly with mesoscale activity which is not clearly inferred from optical and thermal sensors (Lee-Lueng-Fu .2001) High fish catch points were observed in cool water where EKE and NPP are co varying. Hence this synergistic analysis from multi-sensor helps to improve and to explore marine living resources. This study examined, using multi-sensor datasets made valuable contributions to the ocean community. Future research involves use of these environmental variables for identification of species - based Potential Fishing Zones (PFZ) which is highly useful to the fishermen community.
4. SUMMARY AND CONCLUSION
We have attempted use of ocean color and altimetry data products for identification of PFZ. To overcome the problem of cloud cover in ocean color data, an attempt was made using of satellite altimetry data which gives better result for identification of PFZ. From the study we revealed, meso scale variability by the time of EKE which cannot seen clearly in
ocean color data products. Our findings indicate that fish catch weight are strongly linked to physical oceanographic features namely, frontal zones and eddy fields. These features can be identified using a reliable proxy of environmental such as EKE, SSHA. The results suggest that, cool water with high nutrients is suitable for the availability of fish catch. The features acquired from Chl-a image contains more information than SST image which are the primary indicator for fish catch. The EKE and SSHA acts as a secondary indicators plays a dominant role on distribution of fish catch area extent. In conclusion, we believe that, application of multi-sensor data is very useful to identify the PFZ as well as species based PFZ advisories in future.
Figure 2: a) chlorophyll distribution pattern for the year 1998-2003; b) SST distribution pattern for the year 1998-2003; c) NPP distribution pattern for the year 1998-2003; d) EKE distribution pattern for the year 1998-2003; e) SSHA distribution pattern for the year 1998-2003; f) Catch weight distribution pattern for the year 1998-2003
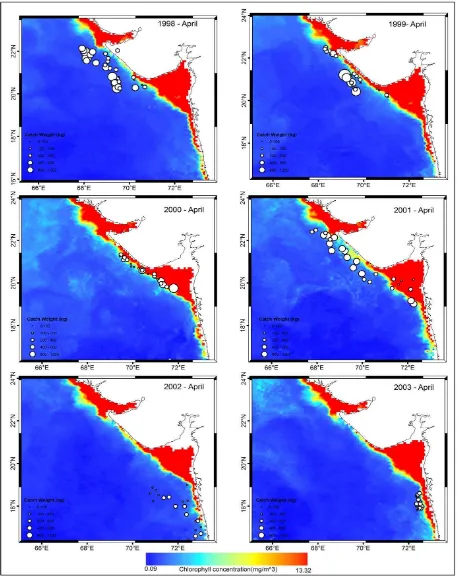
Figure 3.1: The spatial distribution pattern of (Chlorophyll –a) for the year 1998-2003 overlain on catch weight
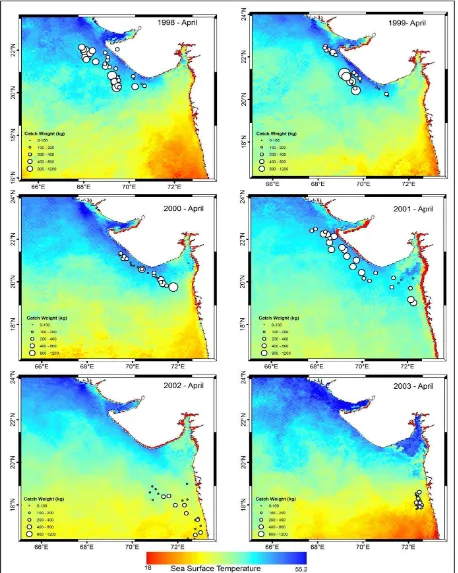
Figure 3.2: The spatial distribution pattern of SST for the year 1998-2003 overlain on catch weight
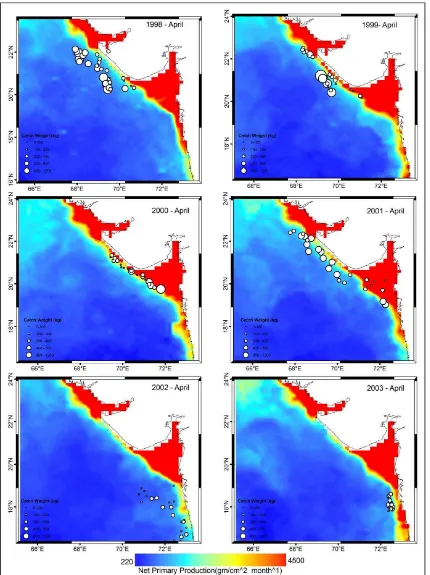
Figure 3.3: The spatial distribution pattern of NPP for the year 1998-2003 overlain on catch weight map
Figure 3.4: The spatial distribution pattern of EKE for the year 1998-2003 overlain on catch weight map
Figure 3.5: The spatial distribution pattern of SSHA for the year 1998-2003 overlain on catch weight map
ACKNOWLEDGEMENTS
The authors gratefully acknowledge the Director, Space Application Centre, Ahmedabad, India and to the Ocean color project team for making available the satellite data products on their website. The authors also thank the anonymous reviewers for their constructive comments. Dr.P.Vethamony, Senior Principal Scientist, NIO, Goa is greatly acknowledged for his continuous encouragement and for providing facilities.
REFERENCES
Mukthi Zainnuddin, Hidetada Kiyofuji, Katsuya Saitoh, Sei-Ichi Saitoh., 2006, Using multi-sensor satellite remote sensing and catch data to detect ocean hot spot for albacore (Thunnus alalunga) in the northwestern North Pacific. Deep Sea Research II 53, (419-431).
Solanki, H.U., Dwivedi R.M, Nayak S.R., Naik S.K., John M.E., and Somvanshi V.S., May 2005, Cover: Application of remotely sensed closely coupled biological and Physical processes for marine fishery resources exploration. International. Journal of Remote Sensing. Vol.26, no. 10, 20 2029-2034.
Michael J., Behrenfeld., and Paul G.falkowsk., January 1997, Photosysnthetic rates derived from satellite based chlorophyll concentration, Limnology and Oceanography. 42 (1), pp. 1-20.
Robinson Mugo., Sei-Ichi Saitoh., Akira Nihira., and Tadaaki Kuroyama., 2011., Statistical Models and Marine-GIS to Detect Habitat Preferences of Skipjack Tuna. IOCCG: Handbook of Satellite Remote Sensing Image Interpretation: Marine Applications, pp. 169-185.
Solanki H.U., Dwivedi., Nayak S.R., September 2001, Application of Ocean Colour Monitor chlorophyll and AVHRR SST for fishery forecast: Preliminary validation results off Gujarat coast, northwest coast of India. Indian Journal of Marine Science, Vol.30 pp. 132 – 138.
Vinu Chandran R., Solanki H.U., Dwivedi R.M., Shailesh Nayak., Jeyaram A., and Adiga S., June 2004, Studies on the drift of ocean colour features using satellite-derived sea surface wind for updating potential fishing zone. Indian Journal of Marine Sciences, Vol.33(2) pp. 122 – 128
Dwivedi R.M., Solanki H.U., Nayak S.R., Gulati D., Somvanshi V.S., December 2005, Exploration of fishery resources through integration of ocean colour with sea surface temperature: Indian experience. . Indian Journal of Marine Sciences Vol.34 (4) pp. 430-440.
Nammalwar.P., Satheesh.S., and Ramesh.R., June 2013, Application of Remote Sensing in the validations of Potential Fishing Zones (PFZ) along the coast of North Tamil Nadu, India. Indian Journal of Geo-Marine Sciences, Vol.42(3), pp.283-292
Rashmi Sharma., Gopalan A.K.S., Ali M.M., 1999, Interannual Variation of Eddy Kinetic Energy from Topex Altimetry Observation. Marine Geodesy, 22, 239-248.
Pujol M.I., Larnicol.G., 2005, Mediterranean sea eddy kinetic energy variability from 11 years of altimetric data. Journal of Marine System 58, 121-142.
Chiranjivi Jayaram May 2011, Remote Sensing the Signature of Upwelling in South Eastern Arabian sea.
Solanki, H.U., Dwivedi, R.M., and Nayak S.R., 2001 Synergistic analysis of SeaWiFS chlorophyll concentrations and NOAA-AVHRR SST features for exploring marine living resources, Int. J. Remote Sensing, 22, 3877-3882.
Ian S Robinson., Discovering the Ocean Space: The unique applications of satellite Oceanography, Springer-Verlag Berlin Heidenburg., 2010.
Lee-Lueng-Fu,Satellite Altimetry and Earth Sciences: A Handbook of Techniques and applications. Academic Press. 2001.