A GENERAL DATA-DRIVEN ALGORITHM FOR FAÇADE STRUCTURE MODELING
USING GROUND BASED LASER DATA
M. Yousefzadeh a,*, F. H.M. Leurink a, M. Beheshti jou b
a
3D GeoSolutions, Zaadmarkt 110, Zutphen – [email protected], [email protected] b
Barad, Galvanistraat 57, Enschede – [email protected]
Commission III
KEY WORDS: Terrestrial laser data, Point cloud, Data-driven modeling, RANSAC, Density histogram
ABSTRACT:
Façade reconstruction from laser point cloud has been an interesting subject in Photogrammetric community for the last two decades. However, due to the variety of architecture types and the nature of laser data, proposing a fully automatic modelling algorithm is still a challenge. Irregular architecture, density variation, occlusion and noise level are the main hindering factors of proposing a general model for façade reconstruction. This paper describes the sequences of an automatic data- driven method which starts from raw laser data and ends with object extraction. Statistical analysis was frequently utilized in segmentation, splitting line detection and object characterization. A rule-based modification method was employed to model the complexity of façade layout. Developed interface enables non-expert user to interact with modelling process by setting few parameters. The method was tested over a couple of datasets.
1. INTRUDOCTION
The subject of building reconstruction is a wide field of study, which is about transforming building measurements to 3D models. Among reconstruction methods developed throughout the last decade, image-based and laser-based methods have received more attention. In spite of great improvements in reconstruction methods, a large number of problems remain, which keep the subject in the focus of the scientific community. Most of these methods are normally focused on the specific parts of the building modelling problems. Thus, there is a need for a general method which benefit from different approaches. Moreover, technological advances such as shifting from terrestrial laser scanning to mobile laser scanning on one hand and increasing demands for 3D as-built models on the other hand, urges proposing more efficient and intuitive methods with a high degree of automation.
1.1 Previous studies
Given the large volume of works in façade modeling, we refer the reader to recently published literature to obtain a comprehensive idea on the subject (Haala and Kada 2010; Musialski et al. 2012; Tang et al. 2010; Vanegas et al. 2010; Vosselman and Maas 2010). Using various approaches such as photogrammetry, computer graphics, and civil engineering, they provided interesting discussions about the technology gaps and future demands.
A considerable part of researches in recent years was dedicated to topology extraction which is also in our focus. In these studies, data-driven and model-driven approaches were used to obtain structured arrangement of façade elements from images and point clouds. Grammar based description of the building in recently developed software packages such as “CityEngine” (Watson et al. 2008) was utilized for procedural modelling to reconstruct some cultural heritage buildings (Haegler et al. 2009). The output of our presented method can also be used for procedural modeling in such popular software.
M¨uller et al. (2007) used production modeling of grammar to subdivide a facade texture into some elements such as floors, tiles, windows, and doors using single image, regardless of its resolution and orientation. They exploited mutual information theory to find similar floors and tiles through searching ordered sequences in vertical and horizontal directions respectively. For classification purposes, they used architectural parametric templates discussed in (Dick et al. 2004) with aid of manual efforts. Some other image-based methods used similar ideas to develop a procedural method (Lipp et al. 2008; Ripperda and Brenner 2009). However, they use interactions to solve the problem of irregularities. In contrast, we tried to automatically solve this problem by adapting irregularities to cellular representation.
Pauly et al (2008) and Mitra et al (2006) developed a computational framework to discover regular or repeated geometric structures in 3D spaces. They proposed a non-linear algorithm to define the regularity using a combination of translation, rotation and scale functions. Although these methods were inspiring, they were still challenging when the number of symmetry groups increased. In less complex setting, Becker and Haala (2009) introduced a cell decomposition technic to find reliable clues of splitting lines in point cloud. Then they used a derivation tree to describe the dataset as sequences of wall and windows. This work was inspiring for our presented algorithm as a cellular representation of point cloud utilized to extract splitting lines. Wang et al. (2011) also combined a data-driven window localization with a façade pattern inference to enhance the robustness of window detection. However, these methods are sensitive to data quality.
Teboul et al. (2011) proposed grammar-based segmentation method in images. They merged a bottom-up classification with a shape grammar using a random exploration method for optimization. Wan and Sharf (2012) tried to exploit the same spirit to decompose scanned facades to their basic shapes using more flexible grammar rules. They used a consolidation method (Zheng et al. 2010) with some manual efforts to transfer 3D points to 2.5D space and obtain a grammatical description. Our
presented method is close to this work in terms of decomposing the dataset to depth layers.
A considerable number of studies focused on individual object extraction from laser data (Pu and Vosselman 2006; Pu and Vosselman 2007; Pu 2008; Pu and Vosselman 2009; W. Shen 2008). Specifically, they used the holes in dataset as a clue to detect windows. Alternatively, we used the remaining data after pre-processing as a more reliable evidence to extract the windows.
Fewer number of researchers used data-driven approach to detect regularity in façade area. They tried to find windows from raw laser data aiming to detect the regularity and to fill the gaps in the façade surface (Sam Friedman and Stamos 2011; S. Friedman and Stamos 2012; Mesolongitis and Stamos 2012). They took the advantage of repeated elements to classify and predict suitable elements for missing parts. Shen et al. (2011) proposed a data-driven method to fit an adaptive structure to the facade. They used some penalty functions to find the position of the splitting planes based on linear feature extraction from the dataset. After an automatic recursive process of element grouping and splitting refinement, the output was shown as a partitioned and classified dataset. Our method is close to the spirit of this work as we used an adaptive splitting approach, but with more robust clues derived from data.
1.2 Overview of the algorithm
Finding a general grammatical description, applicable to all façade types is an open question in the automatic modeling process. The main challenges are due to diversity of façade structures, non-uniform density of points, missing parts due to occlusion and having a rather large amount of noise and outliers in the datasets. Partitioning of original point cloud to some non-terminal cells is our proposed solution. The rest of the problems are due to the nature of data acquisition, which affects the robustness of modeling algorithms. Tackling these problems requires reliable data processing methods to obtain strong clues of actual building elements. At segmentation level, three depth layers were generated using a conditional RANSAC. Unwanted data were eliminated through some filters. In partitioning level the best fitted decomposition array was generated through a data analysis process. Using some rules, boundaries of the cells were modified in structuring level. Meanwhile topologic relations were defined based on the adapted cellular partitions. Characterising the objects located in the generated cells was the final stage of the modeling process.
2. PRE-PROCESSING
Due to variations in façade architecture, proposing a unique modeling technique for all façade samples seems to be impossible. Most of the facades are composed of a main wall faced to the street view which holds the building elements such as windows, doors, balconies and extrusions. This main wall in some cases is divided into two parallel parts; each containing part of the building elements. The criterion of the proposed method is the amount of 3D points collected from the main walls.
The laser data, collected from street view, normally do not represent a uniform scan of the points. Lower parts of the façade which usually are close to the laser scanner are recorded with high density compared to higher parts. For this reason the density of points is not a reliable indicator for a robust modeling method. Moreover, the occlusions are common problems in laser data modeling. The modeling method should be less
sensitive to the lack of data caused by obstacles such as cars, trees and traffic facilities. For these reasons following assumptions were considered for common building samples:
• The façade is a single planar wall or composed of parallel planar walls holding the building elements such as windows, doors balconies and extrusions.
• A considerable amount of laser points has to be collected from wall area.
• Building flats are represented by some openings which are aligned horizontally, except for staircase windows.
Therefore, the cut of the façade with above mentioned assumptions would be the start dataset. If the original dataset is a geo-referenced large point cloud, 2D cadastre maps could be used to automatically depart single façade from the rest of the dataset. Now the dataset is ready to go through the modeling process.
3. SEGMENTATION
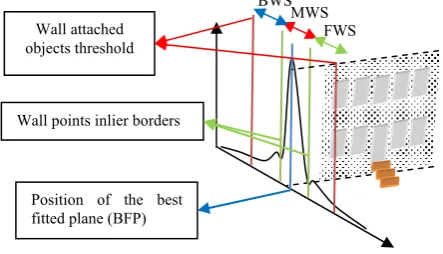
The idea is to identify the points belonging to the following three segments: main wall segment (MWS), behind wall segment (BWS) and front wall segment (FWS). Wall parameters such as position, orientation and dimensions are obtainable from the main wall segment. The openings (windows and doors) are the main clue for façade partitioning. They could be detected in BWS.
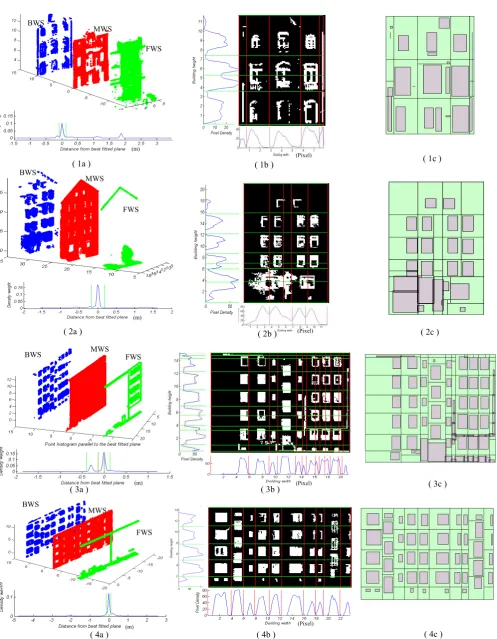
The first and critical step of the segmentation process is detection of the main wall plane. For this aim, RANSAC was utilized as a robust primitive estimator to detect wall parameters in the noisy area of the façade (Schnabel et al. 2007). However, due to dataset variations and the problem of inlier points detection, a conditional RANSAC was employed to increase the robustness of the method. The results of wall segmentation are presented in Fig. 3 (1-4a) in section 5.
3.1 Wall plane detection
The ideal plane is identified by exploring the histogram of points which shows their distances to a selected plane. In regular RANSAC method the plane with minimum distance to the points represents the best fitted plane (BFP). According to the literature, the number of randomly selected triples is obtained from the following equation (Tarsha-Kurdi et al. 2008):
Where α is the minimum probability of finding at least one plane in the dataset (default value: 0.99), ε is the maximum percentage of points belonging to the same plane (default: 50%) and s is the number of parameters (s= 3).
Based on prior knowledge, normal façade wall is vertical. Therefore the selected random points were restricted to the triples with approximately horizontal normal vectors. This condition assured us that the majority of selected points belong to the wall. As a result, the median of minimum distances was taken as the BFP. The output consisted of a normal vector and the perpendicular distance to the origin of the coordinate system in object space.
3.2 Extraction of wall points
The next step is detection of all inner points which belong to the main wall. Having BWS and FWS free from wall points is essential for the next stage. As we know, the actual wall points are not laid on an ideal plane. Therefore density histogram of BFP was utilised in the following way to detect wall boundaries with high certainty: moving from the peak of the histogram to the left and the right (the front and behind of the wall), we took the immediate flat positions (zero slope) as the main wall’s boundaries (Fig.1).
In cases where the façade had two parallel main walls, they appeared as two main peaks in density histogram. Developed function was enabled to detect other main peaks based on the defined threshold. Therefore, the next main wall was extracted by undergoing through the same boundary detection procedure.
3.3 Data reduction
By removing wall points, the points belonging to the behind and front of the wall appeared as clusters of points in 3D space. Remaining data usually contain irrelevant objects such as trees, traffic facilities, passer-byes and also objects from inside of the building such as inner walls which need to be removed from the dataset. Based on the data characteristics, a perpendicular distance was defined by the user to cut off irrelevant objects from the dataset. Approximately half to one meter would be enough distance to keep the objects attached to the wall (Fig. 1). The next step was removing the data which was located out of the wall boundaries. For this aim, MWS points were projected on the BFP and the outline of the wall was extracted from the plane. The BWS and FWS points were also projected on this plane. The points which were out of the extracted boundary were removed as irrelevant points.
4. PARTITIONING
In the third level of details described in CityGML (Gröger and Plümer 2012) regular façade is represented as an array of openings and extrusions. In this surface each horizontal row of windows and doors refer to a floor. Usually the openings of floors are also aligned in the vertical direction in whole or part of the façade surface. Therefore, a horizontal and/or vertical alignment of building elements with similar attributes is common in building architecture. However, the regular array form is not always the case.
Variation in size and position of openings is also common in the existing architecture. For instance staircases are the most common disturbing structures, as their windows are not aligned with the floors direction. The variations in size and placement of the windows may also cause vertical misalignments. Therefore, any general algorithm has to deal with irregularities
caused by these variations. In this section we describe a method to generate an initial structure by finding the best fitted cellular array. This model facilitates proximity analysis and characterizing of building elements. In the next step, developed array is modified to cover above mentioned irregularities.
4.1 Rasterizing
Behind the wall segment (BWS) which contains laser points from openings, is essential to conduct splitting process as they form separate point clusters. First of all, 3D points were transformed to a 2D form. This transformation simplified the analysis by giving structure to irregular point cloud. For this aim, BFP rasterized by user selected resolution (e.g. 10 cm) and all BWS points were projected on this plane. Each pixel got one or zero value, based on the existence or absence of points. Another advantage of rasterizing 3D points was the possibility of applying image processing functions over the dataset. In our application, the user was enabled to perform a cleaning procedure to remove small objects from the dataset, similar to the literature (Khoshelham et al. 2010).
4.2 Initial structure
The splitting process is based on detecting rows and columns with minimum valid pixels (1 value). For this aim two density histograms in horizontal and vertical direction were devised. Horizontal histogram shows the sum of pixel values in the columns, and vertical histogram shows the sum of pixel values in the rows. In façades with regular array of openings, empty intervals were suitable places for splitting lines. However, in case of irregular structure, we rarely had empty spaces in the histogram (Datasets 3 and 4 in Fig. 3). Therefore, the positions with minimum values were more likely to be splitting spots. Consequently, an extremum detection function was utilized. This function picks the minimum values occurred after the maximums which cross a user defined threshold. To avoid over splitting, the histogram can also be smoothened beforehand, through a user-defined kernel, depending on the dataset. However, all over splittings can be mitigated in the next stage. Generated lines configure the best fitted regular matrix which keeps topological correctness of the model in the next step. Binary image and related histogram analysis are presented for four real datasets (1-4b) in Fig. 3.
4.3 Final structure
Extracted matrix had to be modified regarding to the corresponding dataset. To do that, initial splitting lines were overlaid on the binary image. To check and correct any interference between raster image and the initial structure, horizontal and vertical histograms were generated for pixels located between adjacent splitting lines. All detected interferences were treated according to the defined correction rules listed in table 1.
No
. Case Action
1 Object crossed the line & the next
cell is occupied Shift the line forward
2 Object crossed the line & the
previous cell is occupied Shift the line backward
3 Object crossed the line & the next
cell is empty Remove the line
4 No crossed object, over-sized
object or empty space No action Table 1. Structure correction rules Position of the best
fitted plane (BFP) Wall points inlier borders
Wall attached objects threshold
BWS MWS
FWS
Figure 1: Schematic view of facade points segmentation using point histogram.
In the modified structure, cellular indexes remain the same as initial structure, while the corner points might be modified. After line corrections the structure was stored by saving the positions of two (lower-left and upper-right) corners of the cells. These corrections along with corresponding rule numbers are illustrated in Fig. 2.
The expected result was cellular representation which had no interference with the dataset. However the adjacency of cells was disturbed in rare cases (Fig. 3. 2c). In most of the cases the reason was the existence of remaining wall points in the dataset. These disturbances proved that the quality of the final structure highly depends on the quality of wall extraction.
4.4 Feature extraction
Previous step enforced the structure to fit to the distribution of the data. In the ideal case, each cell includes a single object of the building which is isolated by cell boundaries from the others. Binary Image was employed to detect the objects of cells. The algorithm, in order, selected a cell through the cellular indexes. Keeping the values of the selected cell, the rest of the binary image was switched off. Therefore, the objects could be defined by coordinates of their bounding box extractable from two horizontal and vertical histograms. Therefore, the façade information was characterized by saving bounding box coordinates of the point clusters, linked to the corresponding cell indexes.
In some cases, multiple clusters of points were detected in each cell. This can be either due to the lack of data from a single object, or the existence of two objects in one cell (Fig. 3. 1c). If the algorithm detects two or more clusters in one cell, the largest cluster is taken as the main object and the rest are saved to be treated later.
5. EXPERIMENT AND DISCUSSION
The algorithm was established by developing some functions in Matlab. Developed functions were run on a system with the characteristics mentioned in table 2.
System type 64- bit operating system
Processor Intel® Core™i5 CPU M 540 @ 2.53GHz
Memory 4 GB
Graphics NVIDIA Quadro FX 880M Table 2. Running system specifications
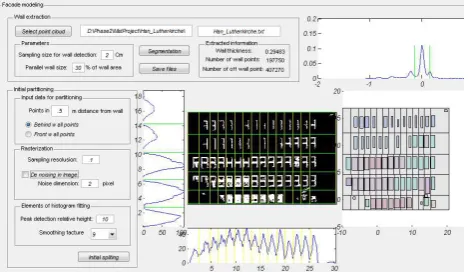
An interface was also developed to enable the user to control the modeling procedure (Fig. 4). User interaction was through setting a few parameters to increase the quality of performance. These parameters are listed in table 3. It took less than 5 minutes to perform automatic modeling for a dataset with around a million points. The result was an indexed cellular representation of the façade with corresponding coordinates of the included objects (Fig. 3. 1-4c).
Section Parameter Default values
Segmentation
Sampling size 1 cm Distance threshold for
behind wall 50 cm
Binary Image
Sampling resolution 10 cm Dimension of small data
considered as noise 0
Histogram analysis
Smoothing factor for
histograms 7 pixels Height threshold for
extremums detection 10 pixels Oversize threshold 6 m Table 3. User interaction parameters
As an advantage, variations in point densities does not sensibly affect automatic modeling procedure. The quality of object extraction directly depends on following factors:
Façade architecture: developed algorithm automatically handles any planar façade and its parallel parts. Curvatures or angular breaks are normally treated as protrusions or intrusions. Occlusion: The lack of data due to the occlusion results in incorrect object attributes. However, further topological analysis using cellular indexes might mitigate the occlusion problem. Noise level: The level of noise may be noticeable due to factors such as distance from the façade and disturbance caused by irrelevant objects in the street which may cause wrong object detection or incorrect attributes.
6. CONCLUSION AND FUTURE WORKS
This paper describes sequences of a general method of automatic façade modeling. An intuitive approach was taken to extract main wall using statistical analysis. Clusters of points located behind the main wall were analyzed to detect splitting lines. These lines formed an initial cellular structure. Cell borders were modified through a rule-based processing to fit the dataset. Further analysis went though object extraction from each cell and characterization with corner coordinates.
Compared to similar methods, the proposed method handles more complex façade layouts with reasonably high automation level. Presented experiments showed reasonable agreement with ground truth (Fig. 3).
In future, developed structure may be utilized as a guideline for object classification. Combinations of the algorithm with more model-driven methods can be utilised to increase the efficiency and the automation level. The method might also be promoted to cover more complex façade architectures.
1
2
3
1 2
1 3
4
4
Figure 2: Rule based correction of structure. Red dashes shows removed lines based on the corresponding rule number
(table 1)
( 1a ) ( 1b ) ( 1c )
( 2a ) ( 2c )
( 3a ) ( 3b ) ( 3c )
( 4c ) ( 4b )
( 4a ) MWS BWS
FWS
MWS BWS
FWS
MWS
BWS FWS
MWS BWS
FWS (m)
(m)
(Pixel)
(Pixel)
(m) (Pixel)
(Pixel) (m)
( 2b )
Figure 3: modeling procedure of four datasets; Segmentation through point histogram (BWS and FWS are shifted for 10 m) (1-4 a); Initial splitting through binary image (1-4 b); Final structure derived through rule based corrections and extracted objects (1-4 c).
Figure 4: Snapshot of the facade modeling interface
7. REFERENCES
Becker, Susanne and Haala, Norbert (2009), 'Grammar Supported Facade Reconstruction from Mobile LIDAR Mapping. ', In Proc. CMRT (XXXVIII, Part 3/W4; Paris, France: Int. Arch. Photogramm., Remote Sens. Spatial Inf. Sci), 229–34.
Dick, A. R., Torr, P. H. S., and Cipolla, R. (2004), 'Modelling and Interpretation of Architecture from Several Images', Int. J. Comput. Vision, 60 (2), 111-34.
Friedman, S. and Stamos, I. (2012), 'Online facade reconstruction from dominant frequencies in structured point clouds', Computer Vision and Pattern Recognition Workshops (CVPRW), 2012 IEEE Computer Society Conference on, 1-8.
Friedman, Sam and Stamos, Ioannis (2011), 'Real Time Detection of Repeated Structures in Point Clouds of Urban Scenes', Proceedings of the 2011 International Conference on 3D Imaging, Modeling, Processing, Visualization and Transmission (IEEE Computer Society), 220-27.
Gröger, Gerhard and Plümer, Lutz (2012), 'CityGML – Interoperable semantic 3D city models', ISPRS Journal of Photogrammetry and Remote Sensing, 71 (0), 12-33.
Haala, Norbert and Kada, Martin (2010), 'An update on automatic 3D building reconstruction', ISPRS Journal of Photogrammetry and Remote Sensing, 65 (6), 570-80.
Haegler, Simon, M¨uller, Pascal, and Gool, Luc Van (2009), 'Procedural modeling for digital cultural heritage', J. Image Video Process., 2009, 4-4.
Khoshelham, Kourosh, et al. (2010), 'Performance evaluation of automated approaches to building detection in multi-source aerial data', ISPRS Journal of Photogrammetry and Remote Sensing, 65 (1), 123-33.
Lipp, Markus, Wonka, Peter, and Wimmer, Michael (2008), 'Interactive visual editing of grammars for procedural architecture', ACM Trans. Graph., 27 (3), 1-10. M¨uller, Pascal, et al. (2007), 'Image-based Procedural
Modeling of Facades', ACM Transactions on Graphics, 26 (3).
Mesolongitis, Agis and Stamos, Ioannis (2012), 'Detection of windows in point clouds of urban scenes', Computer Vision and Pattern Recognition Workshops (CVPRW), (New York, NY, USA), 17- 24.
Mitra, Niloy J., Guibas, Leonidas J., and Pauly, Mark (2006), 'Partial and approximate symmetry detection for 3D geometry', ACM Trans. Graph., 25 (3), 560-68.
Musialski, Przemyslaw, et al. (2012), 'A Survey of Urban Reconstruction', EUROGRAPHICS 2012 State of the Art Reports (Eurographics Association).
Pauly, Mark, et al. (2008), 'Discovering structural regularity in 3D geometry', ACM Trans. Graph., 27 (3), 1-11. Pu, S. (2008), 'Generating building outlines from terrestrial laser
scanning', Remote Sensing and Spatial Information Sciences, (37).
Pu, S. and Vosselman, G. (2007), 'Extracting windows from terrestrial laser scanning', International Archives of Photogrammetry, Remote Sensing and Spatial Information Sciences, (36; Espoo, Finland).
Pu, Shi and Vosselman, George (2006), 'Automatic extraction of building features from terrestrial laser scanning', International Archives of Photogrammetry, Remote Sensing and Spatial Information Sciences (36; Dresden, Germany).
Pu, Shi and Vosselman, George (2009), 'Knowledge based reconstruction of building models from terrestrial laser scanning data', ISPRS Journal of Photogrammetry and Remote Sensing, 64 (6), 575-84. Ripperda, Nora and Brenner, Claus (2009), 'Application of a
Formal Grammar to Facade Reconstruction in Semiautomatic and Automatic Environments', AGILE International Conference on Geographic Information Science.
Schnabel, R., Wahl, R., and Klein, R. (2007), 'Efficient RANSAC for Point-Cloud Shape Detection', Computer Graphics Forum, 26 (2), 214-26.
Shen, Chao-Hui, et al. (2011), 'Adaptive partitioning of urban facades', Proceedings of the 2011 SIGGRAPH Asia Conference (Hong Kong, China: ACM), 1-10. Shen, Wei (2008), 'Building boundary extraction based on lidar
point clouds data', ISPRS08 (2008) (XXXVII: ISPRS), 157.
Tang, Pingbo, et al. (2010), 'Automatic reconstruction of as-built building information models from laser-scanned point clouds: A review of related techniques', Automation in Construction, 19 (7), 829-43.
Tarsha-Kurdi, Fayez, Landes, Tania, and Grussenmeyer, Pierre (2008), 'Extended RANSAC algorithm for automatic detection of building roof planes from LIDAR data', The photogrammetric journal of Finland, 21 (1), 97-109.
Teboul, O., et al. (2011), 'Shape grammar parsing via Reinforcement Learning', Computer Vision and Pattern Recognition (CVPR), 2011 IEEE Conference on, 2273-80.
Vanegas, C. A., et al. (2010), 'Modelling the Appearance and Behaviour of Urban Spaces', Computer Graphics Forum, 29 (1), 25-42.
Vosselman, G. and Maas, H.G. (2010), Airborne and terrestrial laser scanning (Boca Raton: CRC) 318.
Wan, Guowei and Sharf, Andrei (2012), 'Grammar-based 3D facade segmentation and reconstruction', Computers & Graphics, 36 (4), 216-23.
Wang, R., Bach, J., and Ferrie, F. P. (2011), 'Window detection from mobile LiDAR data', Applications of Computer Vision (WACV), 2011 IEEE Workshop on, 58-65. Watson, B., et al. (2008), 'Procedural Urban Modeling in
Practice', Computer Graphics and Applications, IEEE, 28 (3), 18-26.
Zheng, Qian, et al. (2010), 'Non-local scan consolidation for 3D urban scenes', ACM Trans. Graph., 29 (4), 1-9.