STUDY OF MORPHOLOGIC CHANGE IN POYANG LAKE BASIN CAUSED BY SAND DREDGING USING MULTI-TEMPORAL LANDSAT IMAGES AND DEMS
Shuhua Qi
a,* Xiuxiu Zhang
bDian Wang
bJingxuan Zhu
bChaoyang Fang
aa
Ministry of Education Key Laboratory of Poyang Lake Wetland and Watershed Research, Jiangxi Normal of
University, Ziyang Road 99#, Nanchang, China- [email protected]
b School of Geography and Environment, Jiangxi Normal University, Ziyang Road 99#, Nanchang, China-
(1991497243, 351857370,359885091)@qq.com
KEY WORDS: Sand dredging, Morphologic change, Landsat image, DEM, Poyang Lake ABSTRACT:
Sand dredging has been practiced in rivers, lakes, harbours and coastal areas in recent years in China mostly
because of demand from construction industry as building material. Sand dredging has disturbed aquatic
ecosystems by affecting hydrological processes, increasing content of suspended sediments and reducing water
clarity. Poyang Lake, connecting with Yangtze River in the lower reaches of the Yangtze River, is the largest fresh
water lake in China. Sand dredging in Poyang Lake has been intensified since 2001 because such practice was
banned in Yangtze River and profitable. In this study, the morphologic change caused by sand dredging in Poyang
Lake basin was analysed by overlaying two DEMs acquired in 1952 and 2010 respectively. Since the reflectance
of middle infrared band for sand dredging vessel is much higher than that of water surface, sand dredging vessels
were showed as isolated grey points and can be counted in the middle infrared band in 12 Landsat images acquired
in flooding season during 2000~2010. Another two Landsat images (with low water level before 2000 and after
2010) were used to evaluate the morphologic change by comparing inundation extent and shoreline shape. The
following results was obtained: (1) vessels for sand dredging are mainly distributed in the north of Poyang Lake
before 2007, but the dredging area was enlarged to the central region and even to Gan River; (2) sand dredging
area reached to about 260.4 km2 and is mainly distributed in the north of Songmen Mountain and has been
enlarged to central of Poyang Lake from the distribution of sand vessels since 2007. Sand dredged from Poyang
Lake was about 1.99×10
9
m3 or 2448 Mt assuming sediment bulk density of 1.23 t m-3. It means that the
magnitude of sand mining during 2001-2010 is almost ten times of sand depositions in Poyang Lake during
1955-2010; (3) Sand dredging in Poyang Lake has alternated the lake capacity and discharge section area, some of
the watercourse in the northern channel was enlarged by more than 1km when in low lake level. This study is
useful to understand the change of hydrological system, especially the drying up trend in Poyang Lake in recent
autumns and winters.
1. INTRODUCTION
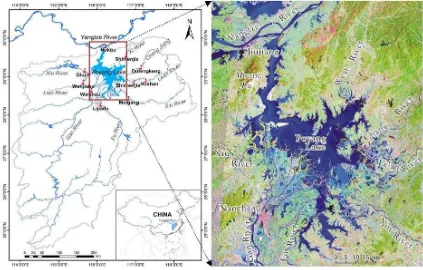
Poyang Lake, the largest fresh water lake in China,
is located at the lower Yangtze River basin of China
(28°25'-29°45' N, 115°48'-116°44' E). It is fed by the
tributaries of the Gan, Fu, Xin, Rao and Xiu rivers and
connected to the Yangtze River through the lake
mouth in the north (figure 1). Poyang Lake is affected
by subtropical monsoon climate with a mean annual
precipitation of 1,680 mm (Ye et al., 2011). Although
Poyang Lake basin only occupies an area of 9% the
Yangtze River Basin, supplies 17% of annual
discharge of Yangtze River. Due to cherish a very
abundant biodiversity, Poyang lake wetland was in the
first batch of The Ramser Convertion List of Welands
of International Importance (The Ramsar Convention
2012). Poyang Lake was also entrusted to store flood
water for Yangtze River (Gao et al, 2014) and support
a high population densities of about 400-800
persons/km2 (Shankman et al., 2006).
In the past decades, however, Poyang Lake
Figure 1: The hydrological system for Poyang Lake watershed and map of Poyang Lake
human activities including sand excavation (Feng et al,
2011) and reclamation for agriculture, fishery,
aquaculture and settlements (Qi et al, 2010; Min,
1999). Reclamation and sand excavation caused
morphologic changes horizontally and vertically
respectively. It is estimated that area of Poyang Lake
was reduced from 5160 km2 in 1954 to 3860 km2 in
1998 (Shankman and Liang, 2003). Reclaiming
farmland was the most significant activity changing
the morphology of Poyang Lake dramatically before
1998.
Demand for sand was increasing during
2001-2010 because of rapid urbanization in the lower
Yangtze River valley. And the activity of sand
dredging was banned in the Yangtze River in
2000(People’s Daily, 2000). Lured by the high profits,
sand dredging developed quickly with hundreds of
large vessels assembled in Poyang Lake. So the
practice of sand dredging in Poyang Lake began in
2001. Sand dredging can cause the increase of water
turbid (Wu et al., 2007; Cui et al., 2013; Feng et al.,
2012). It was reported that sand dredging in Poyang
Lake currently dominates the sediment balance of the
lower Yangtze River because of water turbid increase
(Gao et al., 2014). Sand excavation also caused an
increase of storage capacity. With the assumes that the
flow of vessel continued day and night and all vessels
have a same carrying capacity of 2000 tonnes, a rate
of sand extraction of 236 million m3 year-1 in
2005-2006 from Poyang Lake was estimated based on
the count of vessels leaving Poyang Lake (de Leeuw
et al., 2009). Furthermore, an increase of storage
capacity by 0.98km3 was estimated (Gao et al., 2014)
based on a report that 200 Mt y-1 of sand was mined
during 2001-2005 and reduce to 30 Mt y-1 in the next
years. These studies can give us some cognition on the
magnitude of sand mining in Poyang Lake. These
morphologic changes have triggered significant
hydrological consequences in the region (Zhong and
Chen, 2005). To learn the relationship between these
changes of morphology and hydrologic regime more,
we need more detail information about sand mining.
This study is to reveal the morphologic changes in
Poyang Lake during 2001-2010 caused by sand
dredging. The specific objectives are to: (1) calculate
the total volume of sand mining and rate of sand
excavation every year during 2001-2010; (2) map the
main sand mining region; (3) investigate the changes
investigate the hydrologic changes in Poyang Lake
caused by sand mining.
2. DATA AND METHODS
2.1 Landsat Images Processing
One Landsat images (path 121/row 40) with no or
little cloud cover were selected for each year during
2000 and 2010 in this study (Table 1). These images
were acquired in flood season. And another two
images acquired before and after 2001 respectively,
with similar low lake level, were used to investigate
the morphologic changes caused by the activity of
sand excavation. All images were geometrically
rectified to WGS84 datum with Universal Transverse
Mercatol (UTM) projection and orthorectified using a
digital elevation model (DEM) of 1:50,000 using a
second-order polynomial and nearest neighbour
approach.
Table1: Landsat TM/ETM+ images for counting
vessels and the concurrent water level in Hukou
gauging station
difficult to make a distinction between sand dredging
and sand transporting vessels from remote sensed
images, the proportion for the two type of vessel was
assumed to be steady in these years. The colour
composite map with band 5, 4 and 1 were used to
define turbid water region and then the vessels in
turbid water were detected by visual interpretation
with band 5.
2.2 Hydrological Data
There are eight controlling hydrologic gauging
stations at the five tributaries as showed in figure 1.
They are named as Waizhou station at Gan River,
Lijiadu station at Fu River, Meigang station at Xin
River, Hushan, Shizhenjie and Dufengkeng stations at
Rao River, as well as Qiujin and Wanjiangfu stations
at Xiu River. Daily water discharge and sediment load
data for the eight gauging stations and Hukou station
gauging the water discharges and sediment load into
Yangtze River were obtained from Changjiang Water
Resources Commission. These dataset were used to
One digital elevation model (DEM) of the Poyang
Lake region was interpolated from 1:25 000
topographic maps with 1-m contour interval produced
by Changjiang water resources commission during
1952-1953. Another DEM with a scale of 1:10,000
was produced by Jiangxi Provincial administration of
Surveying, Mapping and Geoinfomation in 2010. The
two Dems were all geometrically rectified to WGS84
datum with Universal Transverse Mercatol (UTM)
The sand mining region characterized by the
distribution of dredging vessels was used as a mask to
estimate the dredged sand volume during 2001-2010
by overlaying the two DEMs with the function of cut
hill supported by ArcGIS software 10.0. Considering
the possible errors in the two DEMs, only these pixels
with the elevation difference greater than 1 meter
between the two DEMs were considered as sand
dredging region. Furthermore, the topographical
change was possibly caused by excavating to build
levees in the activities of farmland reclamation before
1998. So it is absolutely necessary to combine the
distribution of dredging vessels when estimating the
storage capacity change caused by sand dredging
(volume of dredged sand) during 2001-2010.
3. RESULT
3.1 Morphologic changes in Poyang Lake basin
This morphologic change in Poyang Lake was
caused by deposit of sediment loaded from the
mentioned five tributaries in Poyang Lake watershed,
building levees in activities of reclaiming land from
lakes before 1998 and sand mining after 2001
synthetically. With the operation of subtracting with
the two DEMs acquired in 1952 and 2010 (Fig. 2), it
showed that (1) sediment deposit was mainly
distributed in the delta of Gan River, Songmen
Mountain and Eastern of Zhu Lake in the past 60
years. Most of the deposit area was located at the
connection of lake and river; (2) the erosion area
caused by sand dredging was mainly located in the
northern channel connecting lake and Yangtze River
(Fig. 3). The practice of sand dredging caused severe
man-made erosion and the elevation was lowed more
than 10 meters in some of sand mining region. It is
possible that the area with slight erosion located in
these inner-lakes such as Banghu Lake and Zhuhu
Lake were caused by levees building before 1998 or
DEM errors.
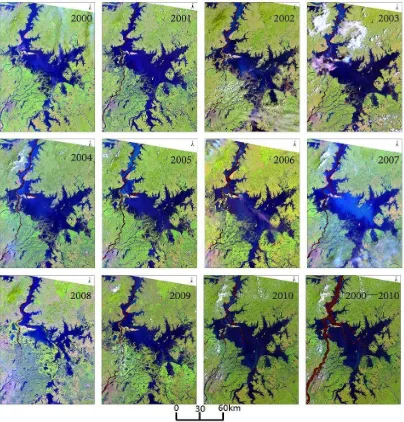
3.2 Distribution of Dredging Vessels and magnitude of sand excavation
Dredging vessels were identified from the infrared
band of Landsat images acquired in flooding season
for every year during 2000-2010 (Fig. 4). Only nine
dredging vessels were counted in 2000. But the
number of vessels increased dramatically in 2001.
And the vessels were mainly assembled at the channel
connecting to Yangtze River and the channel
Poyang Lake before 2006. The activity of dredging
sand enlarged southward after 2007. Number of
vessels showed an increasing trend before 2007and
decreased sharply in 2008 and 2009. Lured by high
profits from housing and construction, vessels
increased again in 2010 and 2011.
The area of sand dredging was estimated as
260.4 km2 and the volume of sand dredged from
Poyang Lake was about 1.99×10
9
m3 during
2000~2010 with the map of morphologic change and
distribution of vessels detected from Landsat images,.
Poyang Lake holds about 20 km3 when water level
rise to 18 meters above mean sea level relative to the
National Vertical Datum of China [NVDC]
established in 1985 according the relationship
between water level and water capacity (Jiangxi
Provincial Academy of Sciences et al., 1993). It
means that the capacity of Poyang lake was increased
about 10% by sand dredging during 2000~2010.
Assuming sediment bulk density of 1.23 t m-3(Li et al.,
2011), about 2448 Mt sand was dredged out for
building industry. It was also estimated that the
dredged sand was about 230~290Mt yearly during
2005~2007 according the data from Department of
maritime affairs, Port and Shipping (Chen, 2009). It
means that the magnitude of sand dredged out during
2001~2010 is about 10 times of the sediment budget
during 1955~2010.
Figure 4: Distribution of dredging vessels detected from Landsat image during 2000-2010
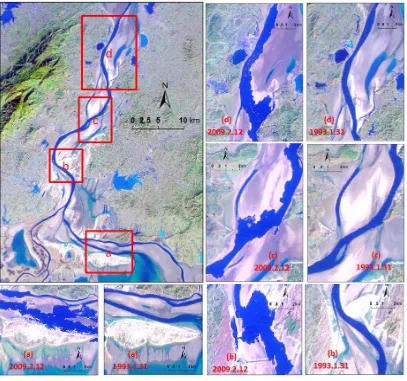
3.3 Hydrological Regime Changes Triggered by Sand Dredging
The practice of sand dredging had also changed
the hydrological regime of Poyang Lake dramatically.
Firstly, it changed the water surface extent when in
lower water level. From Fig. 7, though the imagery
acquired on Jan. 31st 1993 (the corresponding water
level in Xingzi gauging station was about 6.8m)
reflected a higher water level than the imagery
acquired on Feb.12th, 2009 (water level is about 5.8m),
some of the watercourse in the northern channel was
enlarged by more than 1km when in low lake level
(Fig.5). Some watercourse was reshaped chaotically
by the discarded coarse sand (Fig.5d).
Secondly, the water flashed into Yangtze was
muddied by the practice of sand dredging. From Fig.6,
it revealed that water turbidity in Poyang Lake was
dramatically increased after 2001. Though the vessels
have not decreased, the water turbidity decreased
mostly because some of the detected vessels from
Landsat images were only berthed in the lake but not
in sand dredging practice and also because the sand
dredging practice moved southward after 2007. It was
argued that the muddied water would do some direct
or indirect effects on the survival of rare or
endangered species. And the increased sediment
output to Yangtze can also do some effects on the
river morphology of middle and lower Yangtze River.
Thirdly and not lastly, the enlarged watercourse
has caused the water discharge more quickly. It was
reported that drought happened in Poyang Lake more
frequently in these recent autumns or winters. And the
decline in Poyang Lake was attributed to changes of
precipitation (Zhang et al., 2011) or weakened
blocking effect of the Yangtze River (Liu et al., 2013).
But from figure 7, we noticed that the rate of water
discharge from Poyang Lake to Yangtze was greater
after 2001 obviously. It could be partly attributed to
the enlarged and deepened watercourse that changed
streamflow from Poyang Lake to Yangtze. It should
be considered as an important factor to interpret the
decline of Poyang Lake in recent years.
4. CONCLUSION
In this study, several Landsat images were used
to detect sand vessels and analysis the practice of sand
dredging in Poyang Lake. The morphologic change
caused by sand dredging in Poyang Lake was also
analysed. It revealed that: (1) vessels for sand
dredging are mainly distributed in the north of Poyang
Lake before 2008, but the dredging area was enlarged
to the central region and even to Gan River; (2) sand
dredging area reached to about 260.4 km2 and is
mainly distributed in the north of Songmen Mountain
and has been enlarged to central of Poyang Lake from
the distribution of sand vessels since 2007. Sand
dredged from Poyang Lake was about 1.99×10
9
m3 or
2, 448 Mt assuming sediment bulk density of 1.23 t
m-3; (3) Sand dredging in Poyang Lake has alternated
the lake capacity, enlarged and deepened the
discharge watercourse, and played an important role
in the recent decline of Poyang Lake. This study is
useful to understand the change of hydrological
system, especially the drying up trend in Poyang Lake
in recent autumns and winters.
ACKNOWLEDGEMENTS
This study was supported by the National Natural
Science Foundation of China (NSFC, Grant#
40801169, 41261069); Collaborative Innovation
Center for Major Ecological Security Issues of Jiangxi
Province and Monitoring Implementation (No.
JXS-EW-00); and Opening Fund of the Key
Laboratory of Poyang Lake Wetland and Watershed
REFERENCES
Chen Q J. (2010) Effect of unified managing
sand-excavating on Poyang Lake in Jiuiang city.
Jiangxi Hydrologic Science & Technology,
36(2):147-148 (In Chinese with English Abstr.)
Cui L J, Wu G F, Liu Y L. (2009) Monitoring the
impact of backflow and dredging on water clarity
using MODIS images of Poyang Lake, China.
Hydrological processes, 23, 342-350
De Leeuw J, Shankman D, Guofeng Wu et al. (2009) Figure 6: The yearly average loaded sediment content
discharged to Yangtze River from Hukou of Poyang
Lake
Figure 7: Changes of relationship between lake level and
rate of water discharge from Poyang Lake into Yangtze
River during 1951-2010
Strategic assessment of the magnitude and impacts
of sand mining in Poyang lake, China. In:
Regional environmental change, 10: 95-102
Gao J H, Jia J J, Albert J. K, et al. (2014) Changes in
water and sediment exchange between the
Changjiang Riverand Poyang Lake under natural
and anthropogenic conditions, China. Science of
the total environment, 481: 542-553
Feng L, Hu C M, Chen X L, et al. (2011) MODIS
observation of the bottom topography and its
inter-annual variability of Poyang Lake. Remote
sensing of environment, 115: 2729-2741
Feng L, Hu C M, Chen X L, et al. (2012a) Human
induced turbidity changes in Poyang Lake
between 2000 and 2010: Observations from
MODIS. Journal of Geophysical research, Vol.
117, C07006, dio:10.1029/2011JC007864
Feng L, Hu C M, Chen X L, et al (2012b) Assessment
of inundation changes of Poyang Lake using
MODIS observations between 2000 and 2010.
Remote Sensing of Environment, 121:80-92
Jiangxi Provincial Academy of Sciences, Nanjing
institute of Geography & Limnology of CAS,
Office of Mountain-River-Lake Development
Committee of Jiangxi Province. (1993) Atlas of
Poyang Lake. Beijing, Science Press, pp: 5
Li H B, Zhang X F, Xu Q X. (2011) Analysis and
prediction of sediment trapped by large-scale
reservoir group on upstream of Three Gorges Dam.
Eng J Wuhan Univ., 44(4):604–12. (In Chinese
People’s Daily (2000) China bans illegal sand mining on Yangtze River. People’s Daily 13 December
frequency mapping using LANDSAT imagery and
digital elevation models. GIScience & Remote
Sensing 46: 101-127
Min, Q. (1999) Evaluation of the effects of Poyang
Lake reclamation on floods. Yangtze River, 30(7):
30-32 (In Chinese with English Abstr.)
Shankman D, Liang Q, (2003) Landscape Changes
and Increasing Flood Frequency in China's
Poyang Lake Region. Professional Geographer,
55(4):434-445
Shankman D, Keim B D, and Song J. (2006) Flood
frequency in China's Poyang Lake region: Trends
and teleconnections. International Journal of
Climatology, 26:1255-1266
Ye C, Wu G P, Zhao X S, et al. (2014) Responses of
wetland vegetation to droughts and its impact
factors in Poyang Lake NationaI Nature Reserve. J.
Lake Sci. 26(2): 253-259 ( In Chinese with
English abstract)
Wu G F, De Leeuw J, Skidmore A K, et al. (2007)
Concurrent monitoring of vessels and water
turbidity enhances the strength of evidence in
remotely sensed dredging impact assessment.
Water Research, 41, pp:3271-3280
Wu G F, De Leeuw J, Skidmore A K, et al. (2008)
Performance of Landsat TM in ship detection in
turbid waters. International Journal of Applied
Earth Observation and Geoinformation, doi:
10.1016/j.jag.2008.07.001
Zhang Q, Liu Y, Yang G, Zhang Z. (2011)
Precipitation ang hydrological variations and
related associations with large-scale circulation in
Poyang Lake basin, China. Hydrological