THREE-DIMENSIONAL IMAGING OF HOLD BAGGAGE FOR AIRPORT SECURITY
S. Kolokytha a, *, R. Speller b, S. Robson c
a
Dept. of Security and Crime Science, University College London, 35 Tavistock Square, London, WC1H 9EZ – [email protected]
b
Dept. of Medical Physics and Bioengineering, University College London, Malet Place Engineering Building, London, WC1E 6BT, UK - [email protected]
c
Dept. of Civil, Environmental and Geomatic Engineering, University College London, Gower Street, London, WC1E 6BT - [email protected]
Commission V
KEY WORDS: Three-dimensional, X-Ray, Image, Close Range, Photogrammetry
ABSTRACT:
This study describes a cost-effective check-in baggage screening system, based on ‘on-belt tomosynthesis’ (ObT) and close-range photogrammetry, that is designed to address the limitations of the most common system used, conventional projection radiography. The latter’s limitations can lead to loss of information and an increase in baggage handling time, as baggage is manually searched or screened with more advanced systems. This project proposes a system that overcomes such limitations creating a cost-effective automated pseudo-3D imaging system, by combining x-ray and optical imaging to form digital tomograms. Tomographic reconstruction requires a knowledge of the change in geometry between multiple x-ray views of a common object. This is uniquely achieved using a close range photogrammetric system based on a small network of web-cameras. This paper presents the recent developments of the ObT system and describes recent findings of the photogrammetric system implementation. Based on these positive results, future work on the advancement of the ObT system as a cost-effective pseudo-3D imaging of hold baggage for
Currently, the most widely implemented method of baggage screening for the detection of explosives and illicit materials at airports is conventional projection radiography (Singh & Singh, 2003; Speller, 2001). However, this method has two principle limitations. First is the superimposition of the projections of the individual items within baggage. This results in flattened images, where the discrimination of objects is more obscure. Second, image information is distorted due to the disparity in x-ray absorption properties among the individual items within the baggage. Both effects lead to a reduction of important information, which in turn may result in a larger percentage of baggage being flagged by operators, increasing the baggage handling time. When baggage is flagged it goes on to being manually searched or screened with more advanced systems, most frequently a Computed Tomography scanner (CT). CT, as a 3D imaging method, is more advanced than conventional x-ray systems, however, it is significantly more complex and costly which is why it is only used as an additional check on flagged items.
1.2 Tomosynthesis & Image Reconstruction
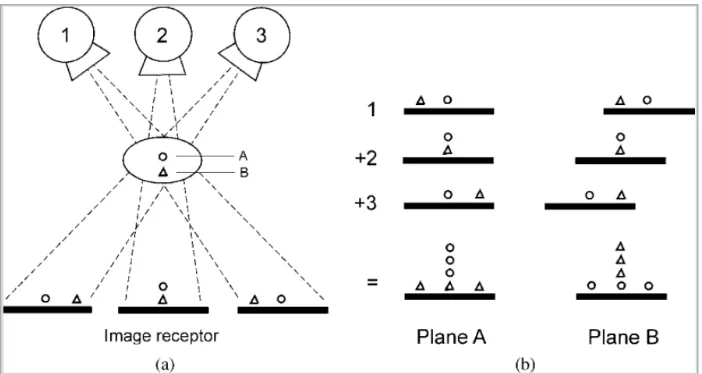
Tomosynthesis is the creation of pseudo-3D images created from a restricted number of 2D projection images which are shows the three projected locations of the circle and triangle on the x-ray detector taken from the corresponding three x-ray source locations. These projection images, through a process of ‘shifting and adding’, are combined to bring either the circles or triangles into focus, keeping the objects in the other planes smeared out (Figure 2 (b)). This corresponds to the basic reconstruction methods of the ‘shift-and-add’ (SAA) technique which involves calculation of the differential shifts of the images which are shifted back to a common centre and added together.
1.3 Proposed System
In an attempt to create a screening system that overcomes the limitations of conventional projection radiography, while keeping the operational cost low, Reid et al. (2011)proposed the use of digital x-ray tomosynthesis.
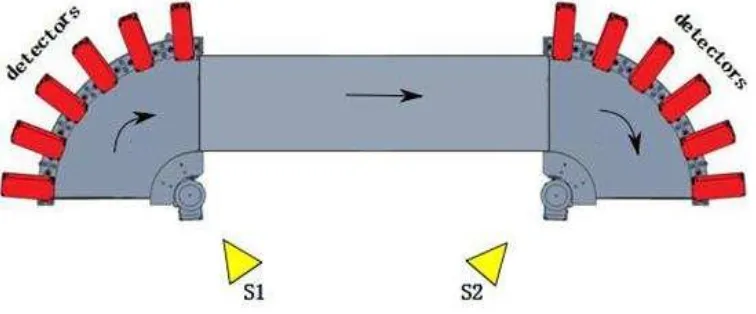
In industrial screening, as in airports, objects (such as baggage and cargo) are typically imaged while moving along conveyor systems. As they move along, their direction of motion often changes, as they navigate curves in the conveyor system. The proposed screening system would utilise the motion of objects around such curves to create the required conditions for ‘On -belt’ Tomosynthesis (ObT). This would be feasible with a static x-ray source and detector arrangement placed at the points of
object direction change (illustrated in Figure 1(b)).Taking a sufficient number of projection images of the object as they move through the curve, supports the image reconstruction of focused 2D slice images of an arbitrary number of planes. These 2D image slices can then be combined to create a pseudo-3D image of the object. However, for the 2D slice images to be
reconstructed it is imperative to have the object’s spatial location, with respect to the ObT x-ray and detector system. For this, a low-cost photogrammetric solution is used, based on one or more geometrically calibrated web–cameras positioned around the curves where the bags are imaged.
Figure 1.Schematic of (a) ‘normal’ tomosynthesis and (b) ‘on-belt’ tomosynthesis systems. (a) shows an arrangement of moving sources and detectors around a static object and (b) shows and arrangement of static sources and detectors around a conveyor bend. The movement of objects around the conveyor bend enables multiple views of different orientations of the objects to be made. Figure
adapted from Reid et al. (2011)
Figure 2. Principles of tomosynthesis image acquisition and SAA reconstruction. (a) Tomosynthesis imaging. The circle in plane A and triangle in plane B are projected in different locations when imaged from different angles. (b) The acquired projection images are
appropriately shifted and added to bring either the circle or triangle into focus; structures outside the plane of focus are subsequently spread across the image (i.e., blurred). Figure adapted from Dobbins III and Godfrey (2003).
1.4 Photogrammetry
Photogrammetric systems typically deploy multiple cameras units to support the computation of 3D points in space by either intersection or bundle adjustment. Such a system was considered, following related successful work using a set of four web cameras to automatically track targeted objects for optical tomographic imaging (Wong, 2012). However, the implementation of a multi USB web-camera system is challenging because of the hardware and driver software
available to connect multiple USB cameras units into a single PC. Work completed in 2012 relied on a specific USB chipset and software drivers coupled with a set of web-cameras with relatively low image specifications (1600x1200x8bit). In the case of ObT, the requirement is somewhat simpler as the conveyor belt can be regarded as restricting the object motion to a 2D plane such that only 2D translations and rotations need be estimated. Provided the objects are rigid bodies, as can be assumed with baggage, a single camera solution is possible. Here, the geometric relationship between the camera and object
can be computed based on the assumption of a planar array of target points located on the baggage item. Such a solution, analogous to a time series of resections with a moving object and static camera allows the change in position and orientation to be readily determined (Luhman et al., 2006).
Further, if coded targets are used representing control locations on static parts of the conveyor system relative to the ObT source and detector, and a separate coded target array are mounted to the baggage for testing purposes, it is possible to determine baggage movements relative to the detector array. This is achieved by regarding each group of targets as a rigid body and using what is essentially a differential resection to compute relative change. The advantage of two sets of targets is that it removes the requirement for a stable camera system, which could be problematic in retro-fitting the ObT system to an existing conveyor belt system. In both cases processing of the resultant image stream is two step: Real time identification and measurement of the coded targets followed by resection of the
system for airport security with the implementation of close-range photogrammetry. Additionally, future work is proposed aimed to advance the current developments on working towards making the ObT system a fully automated cost-effective pseudo-3D baggage screening system.
2. METHODOLOGY 2.1 System Design and Build
An optimum ObT x-ray system was designed and built following a thorough study of optimality criteria. This included background research, test ObT simulations and test x-ray acquisitions. The resulting system is a 180° arc conveyor system built of two 90° arc around each of which six strip detectors are placed, making them twelve in total. Each set of six strip detectors is illuminated by an appropriate x-ray source (S1, S2), which is placed on the other side of the belt to the detectors
Figure 1. 2D top view of the ObT system showing the main components: the x-ray sources (yellow triangles), the strip detectors (red boxes), and the conveyor belts (grey platforms). programming language from National Instruments (Elliott et al. 2007). The objective is to acquire the full 2D projection of the phantom on each detector as it passes in front of them, moving along the conveyor belt. The software built enables the selection of the desired acquisition parameters, and produces twelve 2D images corresponding to the projection of the phantom on each detector. An example of six (out of twelve), images produced
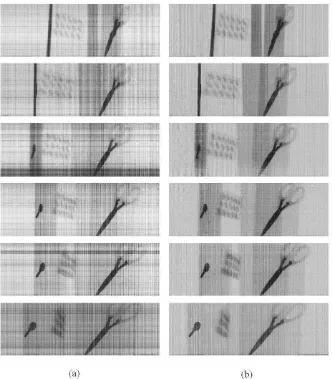
of a phantom built, is shown in Figure 4 (a). This phantom contains three vertical acrylic sheets, a metal key, a pair of scissors and a blister pack of off-counter pills. It is obvious, for example looking at the key on the left, to notice the change in its projection orientation.
Several techniques for image quality optimisation are developed and applied, including methods to reduce background noise in the projections, caused primarily by varied detector pixel sensitivity. An example is displayed in Figure 4 (b) showing six projections of the phantom before and after noise reduction methods developed have been applied, corresponding to sets (a) and (b).
Figure 2. (a) shows an example of six out of the twelve projection images produced of a phantom built. This phantom contains three vertical acrylic sheets, a metal key, a pair of scissors and a sheet of off counter pills. (b) shows the same six projections after after
noise reduction methods developed have been applied.
2.3 Photogrammetric Implementation
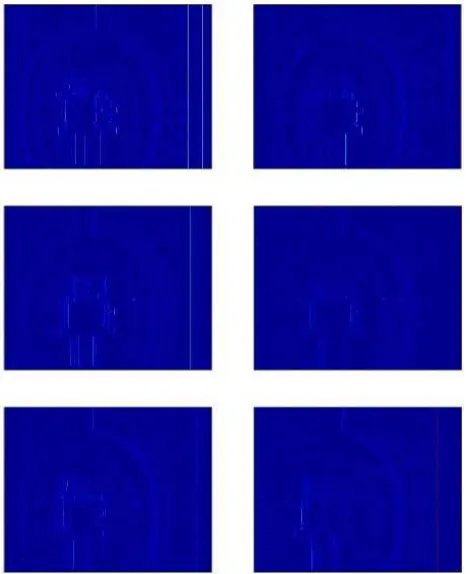
Earlier studies have been made to evaluate the accuracy of the implementation of the close-range photogrammetric system. These studies have been made on static objects, in geometries representing the ObT. In determining the quality of the photogrammetric implementation to the ObT image reconstruction, Kolokytha et al. (2013) compared two sets of reconstructed images; one set produced using photogrammetrically computed measurements for the phantom position and orientation and the other using manually calculated measurements, which are taken as the ‘gold standard’. The comparison is done via developing an algorithm, which subtracts the respective photogrammetrically-resulting images from the manually-resulting ones, in order to check for inconsistencies. If both images are identical the ‘resulting image’ would be a completely black image. From each set, 101 2D slice images are formed, and having applied the algorithm, results for 6 of these are shown in Figure 5. The initial resulting images are created in greyscale; however, they have been converted to RGB in order to enhance the brightness of the details.
An additional analysis measure, which quantifies the “darkness” of these resulting images was developed using Matlab software.
The logic of this is calculating the mean greyscale of these images (Mi) and comparing it to the greyscale of a black image and a white image of the same (pixel) size. In actuality, the greyscale which the Matlab software measures is “how white” an image is, as it takes a black image to have a greyscale value of Mbl=0 and a white image to have the maximum greyscale value of Mwh=255.
The percentage of “how white” (%Wh) an image is can be calculated by:
(1)
Therefore, the percentage of “how black” (%Bl) an image is given by:
(2)
Additionally, we can calculate the percentage of the mean greyscale of the resulting images (Mr) w.r.t. the greyscale of the ‘gold-standard’ images. This gives the percentage of how much darker (%D) the resulting images are than the originals, given by:
(3)
Figure 5. This figure shows six samples of the comparison between two sets of reconstructed images; one set produced
using photogrammetrically computed measurements for the phantom position and orientation and the other using manually
calculated measurements. The comparison is done via developing an algorithm which subtracts the respective images,
in order to check for inconsistencies. If both images are identical the ‘resulting image’ would be completely black. Here,
the resulting images have been converted to RGB in order to enhance the brightness of the details. Figure adapted from
Kolokytha et al. (2013).
3. RESULTS
By looking at the ‘resulting images’ (Figure 5) one may observe that there are minimum inconsistencies. This shows that the respective photogrammetrically-resulting images do not differ significantly from the manually-resulting ones. The calculation results in Table 6 allow the quantification of these eye-made observations. The mean darkness percentage value (%Bl) calculated is 99.87% (Kolokytha et al., 2013). All these values are very near 100%, showing that the ‘resulting images’ are very almost black. In addition, the discrepancies among the eleven measurements in each set are very small, showing that the mean values are a good representative of the respective samples. Additionally, the mean percentage value for how much darker (%D) the ‘resulting images’ are from the initial images is 99.78%. This value is still significantly large and very close to 100%, showing that the previous large value was not related to the original images’ greylevel. Overall, these measurements show that the discrepancies between the photogrammertically-resulting images and the manually-photogrammertically-resulting images are very small. It should be noted that, even though the manually-resulting images are taken as the ‘gold-standard’, the manual measurements are not without error themselves so these calculations do not necessarily mean that the quality of the photogrammetrically-resulting images is lower, they only show on what scale they are different to the former.
Table 6. This table shows the comparison of a sample of eleven resulting images (Figure 5) to the respective original reconstructed images. Mi is the mean greyscale of the original reconstructed image, Mr is the mean greyscale of the respective resulting image, %Bl is the percentage of “how black” an image
is, and %D is the percentage of how much darker the resulting image is than the original.Figure adapted from Kolokytha et al.
(2013).
4. CONCLUSIONS & FUTURE WORK
In conclusion to this paper, it has been demonstrated that implementing close-range photogrammetry to a potential ObT system shows very promising results. Earlier studies performed on static objects, in geometries representing the ObT showed that the implementation of close-range photogrammetry for the determination of the object location produced very good results. Correlation on the phantom position and orientation measurements between the manually measured values and the photogrammetrically computed values shows their differences to be insignificant. In addition, measurements showed the discrepancies between the photogrammertically-resulting reconstructed images and the manually-resulting reconstructed images to be very small, of the average order of 0.13% (Kolokytha et al., 2013).
A continuation of laboratory experiments will enable the development of the ObT system as a hold baggage screening system. Further work is proposed using phantoms in motion on the ObT system implementing close-range photogrammetry for the determination of the object special information. It would be further useful to develop a global software environment that is able to incorporate the operation of both x-ray and photogrammetric systems. Continuing this work shows promising in advancing the ObT system to a fully automated cost-effective pseudo-3D imaging system.
ACKNOWLEDGEMENTS
The author wishes to acknowledge funding from EPSRC and support from the Home Office.
REFERENCES
Dobbins III, J. T. and Godfrey, D. J., 2003. Digital x-ray tomosynthesis: current state of the art and clinical potential, Physics in Medicine and Biology, 48(19), R65.
Elliott, C., Vijayakumar, V., Zink, W., & Hansen, R., 2007. National instruments LabVIEW: a programming environment for laboratory automation and measurement. Journal of the Association for Laboratory Automation, 12(1), pp. 17-24.
Kolokytha, S, Speller, R, and Robson, S., 2013. “The development of an'on-belt tomosynthesis' system for cost-effective (3D) baggage screening.” SPIE Defense, Security, and Sensing. International Society for Optics and Photonics.
Luhmann, T., Robson, S., Kyle, S. and Harley, I., 2006. Close Range Photogrammetry: Principles, Methods and Applications. Whittles, pp. 1-510.
Reid, C. B., Betcke, M. M., Chana, D., and Speller, R. D., 2011. The development of a pseudo-3D imaging system (tomosynthesis) for security screening of passenger baggage. Nuclear Instruments and Methods in Physics Research Section A: Accelerators, Spectrometers, Detectors and Associated Equipment, 652(1), pp. 108-111.
Singh, S. and Singh, M., 2003. Explosives detection systems (EDS) for aviation security, Signal Processing 83, pp. 31-55.
Speller, R., 2001. Radiation-based security. Radiation Physics and Chemistry, 61, pp. 293-300.
Wong , S., 2012. A Fast Webcam Photogrammetric System to support Optical Imaging of Brain Activity. PhD Thesis, UCL 346 pages. discovery.ucl.ac.uk/1344106/1/1344106.pdf