COMPARISON OF URBAN HUMAN MOVEMENTS INFERRING FROM
MULTI-SOURCE SPATIAL-TEMPORAL DATA
Rui. CAO a, b, Wei. TU a, b*, Jinzhou. CAO c, Qingquan. LI a, b, c
a Shenzhen Key Lab of Spatial Smart Sensing and Service, College of Civil Engineering, Shenzhen University, Shenzhen 518060, China - [email protected] (tuwei, liqq)@szu.edu.cn
b Key Lab for Geo-Environment Monitoring of Coastal Zone of the National Administration of Surveying, Mapping and GeoInformation, Shenzhen University, Shenzhen 518060, China - [email protected]
c State Key Lab of Information Engineering in Surveying, Mapping and Remote Sensing, Wuhan University, Wuhan 430079, PR China
Commission II, WG II/7
KEY WORDS: human mobility; smart card data; mobile phone data; space-time GIS, big data.
ABSTRACT:
The quantification of human movements is very hard because of the sparsity of traditional data and the labour intensive of the data collecting process. Recently, much spatial-temporal data give us an opportunity to observe human movement. This research investigates the relationship of city-wide human movements inferring from two types of spatial-temporal data at traffic analysis zone (TAZ) level. The first type of human movement is inferred from long-time smart card transaction data recording the boarding actions. The second type of human movement is extracted from citywide time sequenced mobile phone data with 30 minutes interval. Travel volume, travel distance and travel time are used to measure aggregated human movements in the city. To further examine the relationship between the two types of inferred movements, the linear correlation analysis is conducted on the hourly travel volume. The obtained results show that human movements inferred from smart card data and mobile phone data have a correlation of 0.635. However, there are still some non-ignorable differences in some special areas. This research not only reveals the citywide temporal human dynamic but also benefits the understanding of the reliability of the inference of human movements with big spatial-temporal data.
1. INTRODUCTION
The spatial separation of demand and supply in the city generates continuous human movements, which have raised many urban issues, such as traffic congestion, energy consumption, air pollution, and infectious disease (Kwan and Schwanen, 2016). The quantification of human movements becomes a fundamental work (Gonzalez et al., 2008). Population survey and travel survey investigating a certain percentage of people are two traditional ways to gain typical human movement features in the city, such as travel volume, travel distance, and travel time. The investigation process usually needs a long time and much money, and costs intensive labours, therefore, fast and low cost human movement acquisition are demanded in related urban research and management.
The integration of geographic information system (GIS), Internet, information and communication technology (ICT) generates more and more human related data, i.e., mobile phone data (Sevtsuk and Ratti, 2010; Becker et al., 2013; Cao et al., 2015), vehicle GPS data (Tu et al., 2010; Luo et al., 2015), smart card data (Kim et al., 2014; Tu et al., 2016). Such useful data have both spatial location (longitude and latitude ) and time stamp, which give us new insights on human movements in the city (Yue et al., 2014; Pan et al., 2013; Li and Li, 2014; Li et al., 2014). Combining with spatial data processing technology, they contribute to much innovative researches of urban planning (Liu et al., 2015), urban transportation (Tu et al., 2010; Wang et al. 2012), disaster response (Miyazaki et al., 2015), location based service (Fang et al., 2011; Li et al., 2015), and so on.
* Corresponding author
It is non-negligible that different spatial-temporal data have different typical characteristics. Mobile phone data capture the movements of almost all people in the city, they are of higher human penetration but lower spatial resolution (Miyazaki et al., 2015), and movements less than 500 meters are not easy to find (Xu et al., 2015). GPS data only report the position of vehicles (Tu et al., 2010), while movements by walk and bike are missed. Social network data and social media data, i.e., geo-tagged image, message, and video, are very sparse in both space and time (Zhou et al., 2015). They tell us different stories about urban human movements (Yan et al., 2013). Therefore, there are some questions before using them in urban applications. One important question is do movements inferring from different data have the same rhythm or spatial distribution? If not, how much is the difference between them? Is it acceptable for data-driven urban research?
This paper investigates the relationship of urban human movements inferring from multi-source spatial-temporal data. Firstly, human movement by public transportation system, including bus and metro, is inferred from long-time smart card data recording the boarding actions, with the help of bus GPS data and geographical data of city bus and metro system. Secondly, another type of human movement is extracted from citywide time sequenced mobile phone data with a high people penetration. Typical features about human movements, including travel volume, travel distance and travel time are calculated and compared. To further examine the relationship between the two types of inferred movements, the linear correlation analysis is conducted on the travel volume.
The remainder of this paper is as follow. Section 2 describes the study area and data. Section 3 presents the data processing flow and the comparison between human movements. Section 4 reports and discusses the obtained results. Finally, we conclude the contribution of this study and discuss the further work and research direction.
2. STUDY AREA AND DATA
This section introduces the study area and the used spatial-temporal dataset, including smart card data, bus GPS data, mobile phone data, and additional GIS data.
2.1 Study area
This study was conducted in Shenzhen, China’s first special economic zone, north to Hongkong. It covers an area of 1992 km2 with 10 million regular population and 8 million mobile population. It has six administrative districts: Futian, Luohu, Nanshan, Yantian, Baoan, Longgang and four functional zones: Guangming, Longhua, Pingshan, Dapeng (Figure 1). There are five metro lines in Shenzhen with totally 118 metro stations (13 transfer stations). And the total length is about 178 km, covering six districts, including Luohu, Futian, Nanshan, Baoan, Longgang and Longhua. Besides, there are 874 bus lines with 5265 bus stops, covering all the ten districts in Shenzhen.
Figure 1. Shenzhen administrative map
2.2 Smart card data
“Shenzhen Tong” is a contactless smartcard system used for electronic payments in bus, metro, and some other commercial shops in Shenzhen. By the end of 2013, over 20 million “Shenzhen Tong” cards have been released.
The used smart card data were collected in September 2014 and mainly include five fields, i.e., card id, trade type, trade time, station id (bus route id), vehicle id and trade fare. The field of trade type can only have three values, 21 and 22 represent tap-in and tap-out behaviour of metro passengers, and 31 is labelled as a bus boarding event. Hence, combining with bus GPS data or metro station data, travels by bus or metro can be inferred. For metro trips, time and station of tap-in and tap-out event would be recorded; while for bus trips, only boarding time and bus route id could be recorded.
2.3 Bus GPS data
The GPS trajectory data were collected from bus vehicles with GPS equipment reporting real-time location (longitude and latitude) with certain intervals. The used dataset was also collected by the bus company in September 2014 in line with smart card data. It includes the fields of vehicle id, time, longitude, latitude, speed, equipment status, etc.
2.4 Mobile phone data
The mobile phone data from a dominated communication company in Shenzhen, China was collected on a workday in March, 2012. It records individuals’ locations with intervals about 30 minutes, and spatial granularity is restricted at cell tower level. No personal information (e.g. age, gender, income) are available since the users’ information is anonymized. There are 332,624,029 records in total and 14,028,486 users (about 78% of total population).
2.5 GIS data
Additional GIS data are also necessary to recover travels in the city. Three types of spatial data are used in the study, including road network data, public transit (both metro and bus) lines and stations data, and traffic analysis zone (TAZ) data.
3. METHODOLOGY
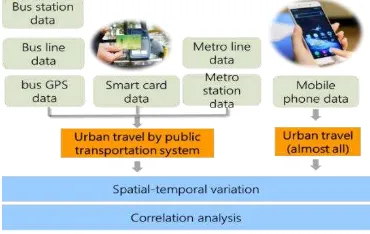
Human movements are extracted from aforementioned spatial-temporal data and comparison is made between them. The data process has three main steps. First, trips are extracted from smart card data and mobile phone data respectively. Then, three indicators of human movements, including travel volume, travel distance and travel time are calculated, and their temporal variation and spatial distribution are analysed. Finally, taking travel volume as an example, correlation analysis is used to examine the relationship of human movements from different data source. The workflow is illustrated in Figure 2.
Figure 2. Workflow of methodology
3.1 Recovering public transit trips from smart card data Smart card data are processed to extract public transit trips. We extracted trips by metro and bus separately.
For travels by metro, both the tap-in and tap-out station and time are recorded, so it is not difficult to extract the metro trips with smart card data. The major steps of extracting metro trips are as follow:
(1) Select the smart card data records of which the field of trade type is equal to 21 or 22 (representing the event of tap-in and tap-out of a metro station).
(2) Extract records according to the field of card id which indicates the same passenger.
(3) Sort records ascending by the field of trade time.
(4) Match each consecutive tap-in and tap-out records where the field of station is different and the difference between tap-out time and tap-in time is within a reasonable time period which are set to be between two minutes and four hours.
For the bus travels, the extracting method is much more complicated. Most of the bus lines in Shenzhen are flat-rate,
which means the passengers only tap once when they board the bus. So, only the boarding time and the vehicle id are recorded without the information of boarding stops or locations. Thus, it is more difficult to extract bus trips, and the matched bus GPS trajectory data are required.
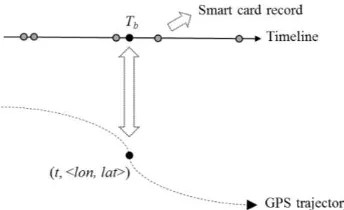
Given the bus records of smart card data and the matched bus GPS trajectory data, we can extract bus trips. The main idea of extracting bus trips are as follow: when a passenger takes on a bus, the boarding time Tb will be recorded when he taps the fare equipment, and at the same time, the GPS location of the bus vehicle will also be recorded, which means we can get the location <lon, lat> of the vehicle at every time t from the GPS trajectory data, then we can find the exact location <lonb, latb> of the bus corresponding to the boarding time Tb, and the process is illustrated by Figure 3. Finally we can matched the location <lonb, latb> to the closest bus stop of the recorded bus line based on our known bus lines and stops GIS data.
Figure 3. Illustration of the process of matching smart card data and bus GPS trajectory
Since the bus records from smart card data have no information about the alighting stop and time, the extraction of alighting bus stop cannot be conducted directly, instead, we need to take advantage of the records with derived boarding stops, and detect the alighting stops based on rules of transferring bus or metro lines and the patterns of multiday travel records.
3.2 Recovering trips from mobile phone data
The difference between the locations of two consecutive mobile phone records with the same id indicates a trip generated in the city. We recover personal trajectory from mobile phone data and then find trip with the spatial difference. The duration of the trip is equal to the time interval from the start record to the end record, and the trip distance also can be calculated by their position. However, due to the positioning error of mobile phone, we ignore the move less than 500 meters. After process all mobile phone data, city-wide human movements are obtained.
3.3 Spatial-temporal variation analysis of urban travel Three typical features about human travel are considered to measure human movements in Shenzhen, including travel volume, travel distance, and travel time. Travel volume is the count of trips in an area in a certain time period. It reflects the travel demand of passengers within the area and the certain period. Travel distance is the length from a trip’s start point to the end point. For trips by bus or metro, it can be calculated along the travel route. While for trips inferred from mobile phone data, Euclidean distance is calculated. Travel time is the cost time of a complete trip.
By aggregating inferred trips, average travel distance and time are calculated, which are defined as follow:
∆� temporal fluctuation of inferred human movements. Total count of travel trips, average travel distance and time in each hour are calculated according to above equations. Such that, daily rhythm of human movements in the city are observed.
Travel trips are summarized at the Traffic Analysis Zones (TAZs) to understand the spatial distribution of human movements. Considering the unbalance of the TAZ areas which may result in the uneven of travel volumes, i.e., TAZs with larger areas tend to get larger travel volumes, we further define the indicator of travel spatial density as the improvement of travel volume to reduce the impact of the size of TAZs, and it is given as: moment correlation coefficient is used to quantify the extent of the relation. The Pearson coefficient is a measure of the linear correlation between the two variables, and has a value between -1 and -1, where -1 denotes a total positive correlation, --1 indicates a total negative correlation, and 0 represents no correlation at all. It is defined as follow:
This section reports the obtained spatial-temporal variation of two revealed human movements and the correlation analysis between them.
4.1 Spatial-temporal variation of urban human movements (1) Temporal variation
The result from smart card data, bus GPS data, metro data found that there are 5,453,113 trips of 3, 152, 088 persons in the whole city. Averagely, people using public transit system generates 1.73 trips per day.
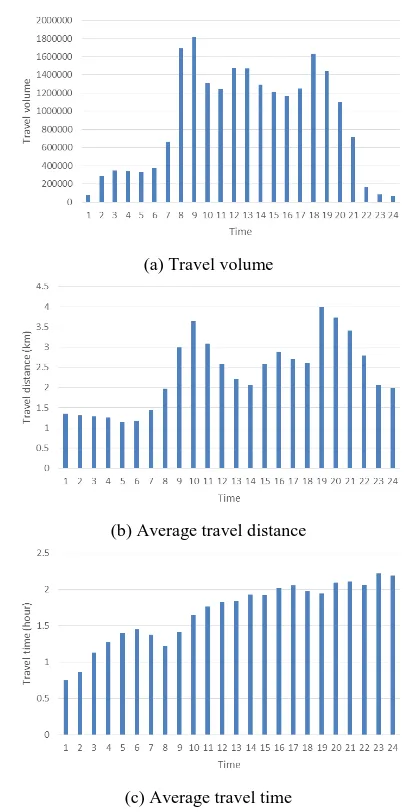
Figure 4 displays 24-hour temporal variation of public transit travel volume, average travel distance and time. Almost no travel
are observed in the night period from 0:00 to 6:00. Considering travel volume, there are 227,213 trips per hour with average, and two significant peaks are in morning rush hours (from 7:00 to 9:00) and evening rush hours (from 18:00 to 20:00) respectively, as Figure 4(a) shows. The travel volume in morning rush hours is slightly higher than that of evening rush hours, reaching 0.7 million. In addition, the morning rush hours last longer than the rush hours in evening. With respect to average travel distance, it peaks at about 12 km in the time period from 6:00 to 8:00 (close to the morning rush hours). It remains stable from 8:00 to 22:00 with values slightly lower than 10 km. With respect to average travel time, due to the morning rush, the peak with 29.2 minutes appears at the period from 6:00 to 8:00. It fluctuates slightly around 25 minutes during daily working time. In the evening rush, it reach the other peak of 26 minutes. The relative higher values of average travel time in morning and evening rush hours shows the impact of traffic congestion involved by commuting.
The results from mobile phone data capture 22,840,686 trips of 14,028,486 persons. As the mobile phone data contain travels by private car, bicycle and walk, it is much larger than trips by bus and metro. Averagely, each person has 1.62 trips per day, which is lower than the value of travel by public transit system. It is because a few people rarely travel in a day, such as elderly people and children.
(a) Travel volume
(b) Average travel distance
(c) Average travel time
Figure 4. Temporal variation of trips inferred from smart card data
Figure 5 displays 24-hour temporal variation of travel volume, average travel distance and time inferred from mobile phone data. Different from travels by public transit system, much trips do exist at night period (0:00- 6:00), which may be sourced from freight trunks and private cars. With respect to travel volume, there are 951,695 trips per hour with average. Three significant peaks are shown in morning rush hours (from 7:00 to 9:00), middle day (from 11:00 to 13:00) and evening rush hours (from 17:00 to 19:00), reaching about 1.8 million, 1.5 million and 1.6 million respectively, as Figure 5(a) shows. Comparing with the trips inferred from smart card data, there is an additional peak in the middle day, the travel volumes are more than doubled, and the evening rush hours last longer. Considering to average travel distance, the average is much lower than that of public transit travel distance which may owe to the different modes of travels that mobile phone data involve. And there are also three significant peaks, appearing in the periods from 9:00 to 10:00, 15:00 to 16:00 and 18:00 to 19:00 respectively, which don’t match that of travel volume. With respect to average travel time, the average is much higher than that of public transit travel time due to the spatial resolution of mobile phone data used. The collecting interval of mobile phone data is about 30 minutes, which means the travel time derived would not lower than half an hour. So the travel time recovered from mobile phone data is not reliable since much of trips cost less than 30 minutes.
(a) Travel volume
(b) Average travel distance
(c) Average travel time
Figure 5. Temporal variation of trips inferred from mobile phone data
(2) Spatial distribution
Spatial distribution of travel spatial density inferred from smart card data is illustrated in Figure 6. It can be seen that TAZs with high values of public transit travel density mainly cluster in the south Shenzhen, such as Luohu, Futian, Nanshan, Longhua and a small part of Longgang and Baoan. It is interesting that these areas with high value are distributed along the five metro lines, which is not surprising since the metro system is the backbone of Shenzhen public transit system and attracts nearly 30% of the total transit travels.
Figure 7 shows spatial distribution of travel spatial density inferred from mobile phone data. It indicates that TAZs with high travel density cover most of the clustered areas in Figure 6. Comparing with travels from smart card data, the northern Shenzhen, where a huge number of people reside, also has a relative higher travel density, although it is not covered by metro lines. It suggests that mobile phone data cover more complete trips than smart card data in the perspective of space, while the latter can only include the trips generated within the coverage of public transit infrastructures.
Figure 6. Spatial distribution of travel spatial density inferred from smart card data
Figure 7. Spatial distribution of travel spatial density inferred from mobile phone data
4.2 Correlation analysis results
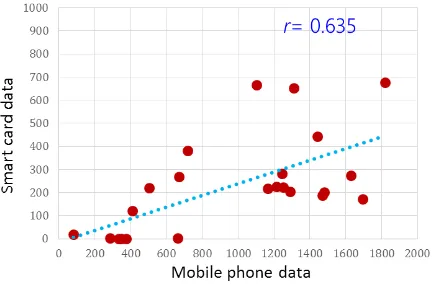
This subsection reports the correlation analysis result using the hourly travel volumes of the trips inferred from smart card data and mobile phone data. The scatter plot of 24-hour travel volumes inferred from the two data is showed in Figure 8. It can be seen that the scatter points exhibit a trend of linear correlation, and the global Pearson product-moment correlation coefficient r is 0.635. It indicates the existence of a coarse linear correlation between the hourly travel volumes, in spite of the difference between two type movements. For the high penetration of mobile phone data, we suggest the travels inferred from mobile phone data are more reliable.
In order to further understand the relationship of travel volumes inferred by the two datasets, the correlation coefficients of 24-hour travel volumes are calculated in each TAZs. The obtained result is shown in Figure 9. The values of coefficients are divided into several groups, the more the colour is close to red, the higher the correlation value, the more the colour is close to green, the lower the value, and TAZs with grey background are with negative correlation (r<0). The result indicates that the correlation values vary significantly across the whole study area. Most TAZs are with correlation values higher than 0.4. Some of them are with correlation over 0.8 which indicates a rather high positive correlation. But there are also TAZs with correlation close to zero or even with negative values. So we can know that the correlation value of 0.635 calculated above only reflects the overall situation across the city, and if we choose a smaller scale, we must take the spatial variation into consideration.
It is noticeable that most areas within the blue dotted-line circle which are in the centre of Shenzhen (including Futian and Nanshan) don’t have high correlation values between travels extracted from the two types of data. It implies that there are various modes of travels in the core areas of Shenzhen, and public transit travels only account for limited proportions, while trips by walking, private cars and bicycles etc. cannot be detected by smart card data. It also suggests when use smart card data or GPS data to investigate human movement in the city, we should be careful about this bias owing to data source.
Figure 8. Scatter plot of hourly travel volumes inferred from smart card data and mobile phone data
Figure 9. Correlation analysis result between hourly travel volumes in TAZ scale
5. CONCLUSION
This study investigates the spatial-temporal variation of urban human movements with spatial-temporal data. Spatial data processing was used to extract human movement. Movements by public transportation system were extracted from bus GPS data
and smart card data. Another movements were inferred from mobile phone data. Relationship of both movements from different data are investigated with correlation analysis. The obtained results demonstrates that although both movements exhibit typical spatial-temporal variation, there are non-ignorable differences between the two extracted movements. The correlation coefficient is 0.635. It indicates spatial-temporal data source should be careful when we do research about human movements in the city.
This paper focused on the basic indicators of human movements, such as travel volume, travel distance and travel time. In the further, we will examine the some other aspects of human movements, i.e., the cooperation and the competition of multi-modal transportation, the fusion of human movements from different data sources. The relationship between land use and human movements is also a valuable research direction.
ACKNOWLEDGEMENTS
This paper was supported in part by the National Science Foundation of China (Grants No. #41401444, #41231171, #41371377), Shenzhen Dedicated Funding of Strategic Industry Development Program (#JCYJ20121019111128765), and Shenzhen Basic Research Program (JCYJ20140828163633980).
REFERENCES
Becker, R., et al. 2013. Human mobility characterization from cellular network data. Communication of ACM, 56(1), 74-82.
Cao Jinzhou, Tu Wei, Li Qingquan, Zhou Meng, Cao Rui. 2015. Exploring the distribution and dynamics of functional regions using mobile phone data and social media data. 14th International Conference on Computers in Urban Planning and Urban Management. 2015. Boston, USA.
Fang Zhixiang, Tu Wei, Li Qingquan. 2011. A multi-objective approach to scheduling joint participation with variable space and time preferences and opportunities. Journal of Transport Geography, 19(4), 623-634.
Gonzalez, M. C., Hidalgo, C. A. and Barabasi, A. L. 2008. Understanding individual human mobility patterns. Nature, 453(7196), 779-782.
Kim, K., et al. 2014. An analysis on movement patterns between zones using smart card data in subway networks. International Journal of Geographical Information Science, 28(9), 1781-1801.
Kwan, M.-P. and Schwanen, T. 2016. Geographies of Mobility.
Annals of the American Association of Geographers, 106(2), 243-256.
Li Deren,Yao Yuan,Shao Zhenfeng. 2014. Big Data in Smart City. Geomatics and Information Science of Wuhan University, 2014, 39(6): 631-640
Li Qingquan,Li Deren. 2014. Big Data GIS. Geomatics and
Information Science of Wuhan University, 39(6): 641-644.
Li, S., et al. 2015. Geospatial Big Data Handling Theory and Methods: A Review and Research Challenges. ISPRS Journal of Photogrammetry & Remote Sensing, 115, 119-133.
Liu, X., et al. 2015. Revealing travel patterns and city structure with taxi trip data. Journal of Transport Geography, 43, 78-90.
Luo, Y., Song, X., Zheng, L., Yang, C., Yu, M., and Sun, M.: Probe Vehicle Track-matching Algorithm Based on Spatial Sematic Features. ISPRS Ann. Photogramm. Remote Sens. Spatial Inf. Sci., II-4/W2, 19-23, doi:10.5194/isprsannals-II-4-W2-19-2015, 2015.
Miyazaki, H.; Nagai, M.; Shibasaki, R. 2015. Reviews of Geospatial Information Technology and Collaborative Data Delivery for Disaster Risk Management. ISPRS Int. J. Geo-Inf.4, 1936-1964.
Pan, G., et al. 2013. Trace analysis and mining for smart cities: issues, methods, and applications. IEEE Communications Magazine, 51(6), 120-126.
Sevtsuk, A. and Ratti, C. 2010. Does Urban Mobility Have a Daily Routine? Learning from the Aggregate Data of Mobile Networks. Journal of Urban Technology, 17(1), 41-60.
Tu Wei, Cao Rui, Cao Jinzhou, Li Qingquan. 2016. Spatial-temporal variation of public transit ridership using smart card data and mobile phone data. 2016 Annual Meeting of Association of American Geographers. San Francisco, USA.
Tu Wei, Fang Zhixiang, Li Qingquan. 2010. Exploring time varying shortest path of urban OD pairs based on floating car data.
18th International Conference on Geoinformatics, Geoinformatics 2010. 2010. Beijing, China.
Wang, P., et al. 2012. Understanding Road Usage Patterns in Urban Areas. Scientific Reports, 2, 1001.
Xu, Y., et al. 2015. Understanding aggregate human mobility patterns using passive mobile phone location data: a home-based approach. Transportation, 42(4), 625-646.
Yan, X.-Y., et al. 2013. Diversity of individual mobility patterns and emergence of aggregated scaling laws. Scientific Report, 3, 2678.
Yue Yang, Lan Tian, Yeh Anthony G.O, Li Qingquan. 2014. Zooming into individuals to understand the collective: A review of trajectory-based travel behaviour studies. Travel Behaviour and Society. 1(2), 719-723.
Zhou Meng, Tu Wei, Li Qingquan, Yue Yang, Chang Xiaomeng. 2015. Inferring Individual Physical Locations with Social Friendships. Geoinfomatics 2015. Wuhan, China.