FOREST COVER MAPPING IN ISKANDAR MALAYSIA USING SATELLITE DATA
Kasturi Devi Kanniaha,b, Nazarin Ezzaty Mohd Najiba and Tuong Thuy Vuc
aTropical Map Research Group, Faculty of Geoinformation and Real Estate, Universiti Teknologi Malaysia, 81310
Skudai, Johor, Malaysia
bCentre for Environmental Sustainability and Water Security (IPASA), Research Institute for Sustainable Environment,
Universiti Teknologi Malaysia, 81310 UTM, Skudai, Johor, Malaysia.
cScholl of Geography, University of Nottingham, Malaysia Campus, Jalan Semenyih 434500, Selangor, Malaysia.
KEY WORDS: Forest Cover, Deforestation, Distubance, CLASlite, Remote Sensing, Malaysia
ABSTRACT:
Malaysia is the third largest country in the world that had lost forest cover. Therefore, timely information on forest cover is required to help the government to ensure that the remaining forest resources are managed in a sustainable manner. This study aims to map and detect changes of forest cover (deforestation and disturbance) in Iskandar Malaysia region in the south of Peninsular Malaysia between years 1990 and 2010 using Landsat satellite images. The Carnegie Landsat Analysis System-Lite (CLASlite) programme was used to classify forest cover using Landsat images. This software is able to mask out clouds, cloud shadows, terrain shadows, and water bodies and atmospherically correct the images using 6S radiative transfer model. An Automated Monte Carlo Unmixing technique embedded in CLASlite was used to unmix each Landsat pixel into fractions of photosynthetic vegetation (PV), non photosynthetic vegetation (NPV) and soil surface (S). Forest and non-forest areas were produced from the fractional cover images using appropriate threshold values of PV, NPV and S. CLASlite software was found to be able to classify forest cover in Iskandar Malaysia with only a difference between 14% (1990) and 5% (2010) compared to the forest land use map produced by the Department of Agriculture, Malaysia. Nevertheless, the CLASlite automated software used in this study was found not to exclude other vegetation types especially rubber and oil palm that has similar reflectance to forest. Currently rubber and oil palm were discriminated from forest manually using land use maps. Therefore, CLASlite algorithm needs further adjustment to exclude these vegetation and classify only forest cover.
1. INTRODUCTION
Although approximately 19.54 million ha (59%) of Malaysia’s land mass was still covered by tropical rainforest in 2003 (Wan Razali and Mohd Shahwahid, 2013) the forest cover loss rate in Malaysia is high with 210,100 ha per year between 2000 and 2010 (Hansen et al., 2013). Malaysia was categorized among high forest cover loss countries as it was ranked at 129th place out of 137 countries by the global Environmental Performance Index (EPI, 2016). The Malaysian tropical forest contains various species of animals and plants that share their habitat. Therefore, changes or decrease in forest cover not only will destroy flora and fauna but also will affect the delivery of important ecosystem services i.e regulating the climate, providing shelter to fauna (habitat), supporting cultural services etc.
Forest cover mapping in Peninsular Malaysia is carried out by the Forestry Department Peninsular Malaysia (FDPM). Field inventories (Rahman, 2014) is a common method to map forest cover, and it produces more reliable data for forest cover mapping although it is laborious and consumes tremendous amount of time and money. The use of aerial photos is also limited in terms of spatial coverage and it is very costly to fly over the entire nation (FAO, 2002). Remote sensing has high potential in gathering data on forest cover changes across large areas (Allnutt, 2013).
Forest cover loss within the field of view of a satellite sensor is defined as tree canopy cover that is totally removed at the pixel scale (i.e. 30 m for Landsat TM sensor) (Hansen et al., 2013).
Remote sensing data with sufficient spatial and high temporal resolution datasets are effective for forest cover mapping and monitoring (Lu et al., 2004). Various remote sensing data ranging from aerial photography to high and medium resolution optical imagery and from hyperspectral data to active microwave (SAR) satellite data and various digital image processing techniques have been applied to monitor forest cover changes.
Various techniques have been used to detect forest cover and monitor the changes over a period of time including multi-date classification (Desclée et al.,2006), object based classification (Berberoglu and Akin, 2009), visual interpretation (Sakthivel et al, 2010), support vector machine (SVM) (Huang et al., 2008), maximum likelihood classification (Sire´n and Brondizio,2009;
Valožić, and Cvitanović, 2011; Forkuo and Frimpong, 2012)
and artificial neural networks (ANN) (Sugumaran, 2001). With the help of current software development, information extraction from satellite data can be done automatically for forest cover mapping and change detection.
vegetation such as grasslands and shrub lands and thinning of forested area (CLASlite, 2013).The results of this study will contribute to better management and conservation of forest resources in Malaysia.
2. DATA AND METHODS 2.1 The study area
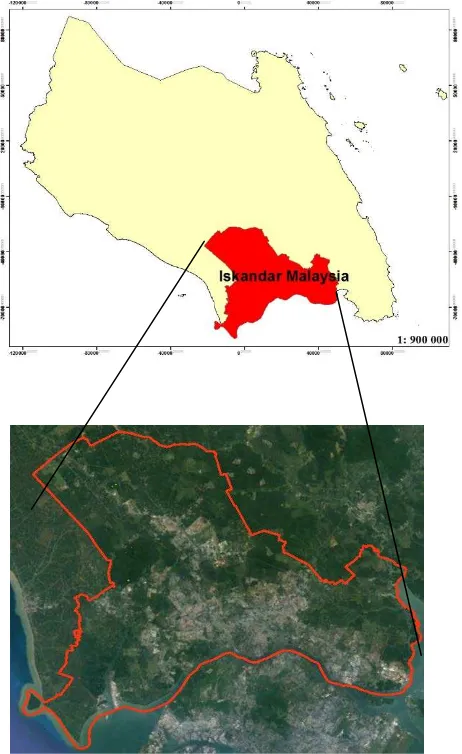
We selected a sub region; Iskandar Malaysia (IM) located in the state of Johor in the south of Peninsular Malaysia (Figure 1) as a pilot study site to test the methodology adopted in this study. IM is the fastest growing economic region that was established in 2006. The region encompasses an area of 2217 and currently the natural environment (forest, mangrove, rivers and water bodies) covers ~24% (56,719 ha) of the total IM (Comprehensive Development Plan ii—unpublished).
A great deal of rapid development at the expense of forest cover occurred in IM since 2005 to transform this region into an economic hub. Thus, this region was selected to map the forest cover and its change over a period of 20 years (1990 to 2010).
Figure 1. The Iskandar Malaysia (IM) region in Johor State of Peninsular Malaysia
2.2 Data sets
Remotely sensed satellite data used in this study includes Landsat 8 (2010) and Landsat 5 (1990). These data with 30 m spatial resolution were downloaded from the USGS Global Visualization Viewer (GloVis) website (http://glovis.usgs.gov). For IM, one Landsat scenes for1990 and 2010 respectively with < 20% cloud cover were downloaded for each period.
We specifically observed the period between 1990 and 2010 to detect forest cover change because of the availability of the Landsat data and high forest cover loss due to economic development in IM during this period. Other data used in this study was the Johor state Land use maps dated 1990 and 2010 that were obtained from the Peninsular Malaysia Agricultural Department with a scale of 1:75 000. These maps were used for identifying oil palm and rubber areas and removing from the forest over images generated using Landsat data. The maps were also used to validate the accuracy of forest cover extracted from the Landsat images.
2.3 Methods
First of all, Landsat images that were downloaded from GloVis were georeferenced with UTM, Zone 47 North projection and WGS 84 datum. The images were then pre-processed and processed using CLASlite software. Pre-processing of Landsat images was automatically done by CLASlite with radiometric calibration and atmospheric correction. For radiometric correction the Digital Numbers (DN) of each pixel were converted into radiance using conversion factors (gains and offsets) from the providers of the satellite sensors (i.e. Landsat) (CLASlite, 2013). Figure 2 shows the CLASlite steps for the image processing.
Figure 2. CLASlite steps for the image processing.
Clouds, cloud shadows, terrain shadows, and water bodies were automatically masked out by CLASlite. The images were also atmospherically corrected by CLASlite using the 6S radiative transfer model. This minimizes the disturbance from the atmosphere towards the pixel value (CLASlite, 2013). 6S radiative transfer model used Moderate Resolution Imaging Spectroradiometer (MODIS) sensor. It interacts with the land surface, and moves through the atmosphere to the sensor. The image is then “modified” by removing the estimated model of the atmosphere, resulting in an image of surface reflectance (i.e. units of percentage, represented by integers 0 to 10000, where 10000 corresponds to 100%) (CLASlite, 2013).
Image calibration
Map fractional cover
Map forest cover
Map forest change (deforestation &
Next, fractional cover images of Photosynthetic Vegetation (PV), Non Photosynthetic Vegetation (NPV) and Soil were produced using the Automated Monte Carlo Unmixing (AutoMCU) analysis embedded in CLASlite. Spectral libraries created using extensive field works in tropical forests are used by AutoMCU to classify the images into PV, NPV and Soil. Each pixel is unmixed to PV, NPV and soil using AutoMCU technique (CLASlite, 2013). From the fractional cover images, forest and non-forest images were produced in this study using the following thresholds (Bryan et al., 2013):
Forest = PV ≥ 80 AND S < 15, Non-forest= PV < 80 OR S ≥ 15
Since rubber, oil palm and forest have similar spectral reflectance it is hard to differentiate rubber and oil palm (to some extent) from forest in optical images. Thus, we used the land use maps of Johor to locate rubbers and oil palm from the Landsat images and removed them from the images. . We also removed any forested areas that is <0.5 hectare following the definition of forest cover by FAO (FAO, 1998).
Forest cover detected in Landsat images were assessed for their accuracy using forest cover statistics produced by Iskandar Regional Development Authority (IRDA) (Comprehensive Development Plan ii report-unpublished).
Finally we computed deforestation and disturbance between 1990 and 2010 for the IM region in south of Peninsular Malaysia using the deforestation and forest disturbance decision tree available in CLASlite software (CLASlite, 2013). Deforestation is defined as forest loss (total disappear once) while disturbance refers to forest degradation (CLASlite, 2013). The PV fraction, NPV fraction, bare substrate fraction, RMSE, reflectance of bands 1 and 4 of the two time series images were used to detect deforestation and disturbance using Landsat data (CLASlite, 2013).
Deforestation and disturbance pixels are calculated as follows.
Deforestation:
(((PV1 – PV2) ≥ 25) [PV decrease captures most deforestation]
OR ((S1 ≤ 5) AND ((S2 – S1) ≥ 15)) [S increase captures deforestation followed by early regrowth]
OR ((PV2 < 80) AND ((NPV2 – NPV1) ≥ 20))) [NPV increase]
Forest Disturbance:
((((NPV2-NPV1) ≥ 10) AND ((PV1-PV2) > 10)) OR ((S1 ≤ 5) AND ((S2-S1) > 10) AND (S2 ≤ 15)))
3. RESULTS AND DISCUSSIONS
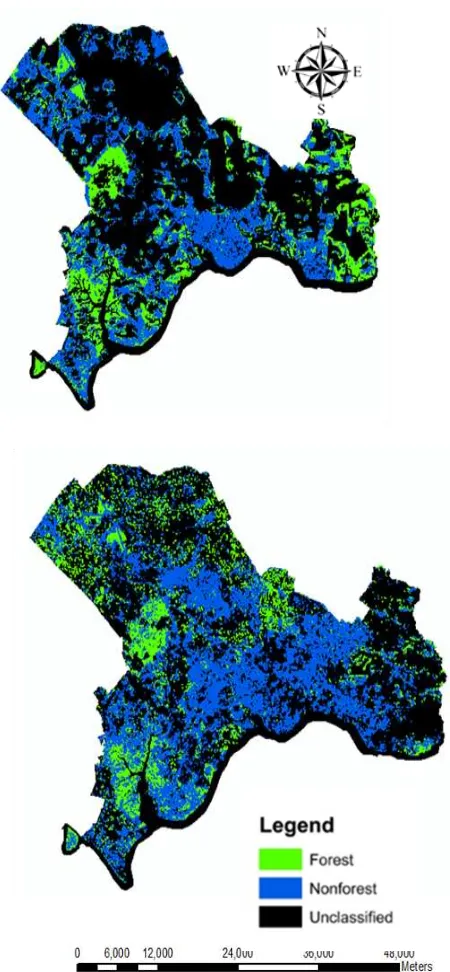
Forest cover identified in IM for 1990 and 2010 using CLASlite software is presented in Figure 2. In IM the forest cover was found to decrease 49.4% (22,165 ha) from 1990 (43,971 ha) to 2010 (21,806 ha). We validated these numbers with the forest land cover data provided by Department of Agriculture (DOA) and land cover obtained by classifying Landsat images using Maximum Likelihood Classification techniques (Kanniah et al., 2015).
CLASlite was found to slightly overestimate forest cover in IM by 21% in 1990 and 12% in 2010 when compared to forest land
cover data provided by DOA. This difference however becomes smaller when compared with forest cover data obtained by Kanniah et al. (2015) where the difference in 1990 is only 14% and 5% in 2010. Satellite images (Landsat data) resulted in a small overestimation may be due to the cloud cover present in the imageries.
The total deforestation (21 025 ha) and disturbance (3 253 ha) between 1990 and 2010 in Iskandar Malaysia was about 24 278 hectare (Figure 3). The deforestation and disturbance in IM as detected in this study using CLASlite programme may be more than the real estimates. For example the difference between forest cover change (22165 ha) and deforestation and disturbance (24278 ha) was 2113 ha.
This difference might have been caused by the threshold value used in this study to identify forest and non forest areas. As mentioned in the methods section the threshold value for forest cover was adjusted in this study to detect forest cover. However, the default threshold values were used in deforestation and disturbance analysis. As the PV and S thresholds for forest could not be changed while running the deforestation and disturbance module in CLASlite, the resulted deforestation and disturbance values remained higher. Moreover, the deforestation and disturbance computation also included rubber and oil palm as the function uses reflectance images that were not screened out for rubber and oil palm. A large decrease in rubber plantations occurred in IM between 1990 and 2014 (Kanniah et al., 2015) thus, the deforestation and disturbance of forest was higher. Another possible reason for the difference between forest cover loss, deforestation and disturbance is the effect of pixel size during the calculation of deforestation. In calculating deforestation, every 3 x 3 pixel kernel must be surrounded by a minimum of 5 pixels. The pixels which are among the criteria of deforestation but do not pass this filter will be classified as disturbance. Meanwhile, disturbance pixel must be surrounded by a minimum of 5 disturbance pixels for every 7 x 7 kernel.
Figure 3. Forest cover in Iskandar Malaysia as detected in Landsat data 1990 (top panel) and 2010 (bottom panel).
4. CONCLUSION
Since forests are valuable assets for ecological and economic sustainability, immediate action must be taken to preserve this natural resource for ecosystem vitality and environmental disaster prevention. The deforestation and disturbance results from CLASlite also provide information that can be used to protect the forests from being logged and can also help the responsible authorities to preserve and conserve the forest against loss, which can be used in making replantation plans to regain the forest areas.
Figure 4. Deforestation (top panel) and disturbance (bottom panel) between 1990 and 2010 in Iskandar Malaysia.
ACKNOWLEDGEMENTS
We acknowledge the Ministry of Education Malaysia (through research grant Q.J130000.2427.02G20) for providing funding to conduct the study. Our profound gratitude goes to the Forestry Department of Malaysia and Agricultural Department of Malaysia for providing the forest cover statistics and land use maps. We would also like to thank the USGS department for providing free Landsat images data and we would also like to show our gratitude to the CLASlite team for providing the Classlite programme and for all the technical assistances
REFERENCES
Allnutt, T. F., Asner, G. P., Golden, C. D., & Powell, G. V. N. (2013). Mapping recent deforestation and forest disturbance in north eastern Madagascar. Tropical Conservation Science, 6(1), 1-15.
Berberoglu S. and Akin A. (2009). Assessing different remote sensing techniques to detect land use/cover changes in the eastern Mediterranean .International Journal of Applied Earth Observation and Geoinformation 11 p. 46–53
Bryan J. E., Shearman, P. L., Gregory P. Asner, D. E. K., Aoro, G., & Lokes, B. (2013). Extreme Differences in Forest Degradation in Borneo: Comparing Practices in Sarawak, Sabah, and Brunei. PLoS ONE, 8(7). doi: 10.1371/journal.pone.0069679 (p. 1-7)
CLASlite (2013).CLASlite Forest Monitoring Technology version 3.1 user guide. Carnegie Institution for Science Department of Global Ecology 260 Panama Street Stanford, Ca 94305 USA (p 1-32)
Desclée, B., Bogaert, P., and Defourny, P. (2006). Forest change detection by statistical object-based method. Remote Sensing of Environment, 102(1), (p 1-11)
FAO, 1998. FRA 2000 Terms and Definitions. FRA Working Paper 1, FAO Forestry Department.
Hansen, M. C., Potapov, P. V., Moore, R., Hancher, M., Turubanova, S. A., Tyukavina, A., Townshend, J. R. (2013). High-resolution global maps of 21st-century forest cover change. Science, 342(6160), (p. 850-853)
Huang C., Kuan Song, Sunghee Kim, John R.G. Townshend , Paul Davis, Jeffrey G. Masek , and Samuel N. Goward. (2008) Use Of A Dark Object Concept And Support Vector Machines To Automate Forest Cover Change Analysis. Remote Sensing of Environment. (112) (p. 970–985.)
Lu. D, P. Mausel, E. Brondízio and E.Moran.(2004) Change detection techniques. Int. J. Remote Sensing.Vol. 25, No. 12, (p. 2365–2407)
Rahman A. (17-18 March 2014). Application of Geospatial Technology as Tool for Effective Forest Management in Peninsular Malaysia. Paper presented at the The 6th National Symposium on Geospatial Information, PICC, Putrajaya. (p. 1 -38)
Sirén, A. H., & Brondizio, E. S. (2009). Detecting subtle land use change in tropical forests. Applied Geography, 29(2), (p. 201-211)
Sugumaran, R. (2001). Forest Land Cover Classification Using Statistical and Artificial Neural Network Approaches Applied to IRS LISS‐III Sensor. Geocarto International, 16(2), (p. 39-44)
Valožić, L., & Cvitanović, M. (2011). Mapping the Forest
Change: Using Landsat Imagery in Forest Transition Analysis within the Medvednica Protected Area. Croatian Geographical Bulletin, 73/1, 245 – 255
Wan Razali and Mohd Shahwahid. (21-23 Oct 2013). Final Report Transitions to Sustainable Forest Management and Rehabilitation in Malaysia APFNet /APAFRI Final Project Meeting. Beijing, China. (p. 1-34)
Websites