FROM POINT CLOUDS TO ARCHITECTURAL MODELS:
ALGORITHMS FOR SHAPE RECONSTRUCTION.
M. Canciani a, C. Falcolini a, M. Saccone a, G. Spadafora a
a
Dipartimento di Architettura, Università degli Studi d Roma Tre
(marco.canciani, corrado.falcolini, mauro.saccone, giovanna.spadafora)@uniroma3.it
KEY WORDS: 3D Survey, point clouds, mathematical model, algorithms, shape reconstruction.
ABSTRACT:
The use of terrestrial laser scanners in architectural survey applications has become more and more common. Row data complexity, as given by scanner restitution, leads to several problems about design and 3D-modelling starting from Point Clouds. In this context we present a study on architectural sections and mathematical algorithms for their shape reconstruction, according to known or definite geometrical rules, focusing on shapes of different complexity.
Each step of the semi-automatic algorithm has been developed using Mathematica software and CAD, integrating both programs in order to reconstruct a geometrical CAD model of the object.
Our study is motivated by the fact that, for architectural survey, most of three dimensional modelling procedures concerning point clouds produce superabundant, but often unnecessary, information and are also very expensive in terms of cpu time using more and more sophisticated hardware and software. On the contrary, it's important to simplify/decimate the point cloud in order to recognize a particular form out of some definite geometric/architectonic shapes. Such a process consists of several steps: first the definition of plane sections and characterization of their architecture; secondly the construction of a continuous plane curve depending on some parameters. In the third step we allow the selection on the curve of some nodal points with given specific characteristics (symmetry, tangency conditions, shadowing exclusion, corners, … ). The fourth and last step is the construction of a best shape defined by the comparison with an abacus of known geometrical elements, such as moulding profiles, leading to a precise architectonical section. The algorithms have been developed and tested in very different situations and are presented in a case study of complex geometries such as some mouldings profiles in the Church of San Carlo alle Quattro Fontane.
1. THE 3D SURVEY
More and more powerful modern technologies and computer tools, in addition to increasingly more advanced and complex software, have made it possible to move forward in the automation of procedures and rapidity and simplicity of architectural survey operations. The so called 3D Survey, aimed at creating rendering models which are very close to the real ones, both in the three-dimensional form and in their visual and surface aspect, is set in this context (Remondino, 2011). Surveying techniques applied to the 3D survey call for the use of indirect methodologies, of range based type (topographic survey and through laser scanner) and image based type (conventional and non-conventional photogrammetric survey), combined with each other, and of direct methodologies of measurement in detail according to the survey traditional methods. These procedures consist of two different phases: survey and data capture phase and rendering and data processing phase.
In the first phase different survey methods, topographic, photogrammetric and laser scanner tools, are used according to specific methodologies which call for a phase of setting of the survey making a both general and specific project, locating targets for georeferencing, placing the different measurement stations and connecting them together, capturing the different types of data, topographic points, photos, laser scans, direct measurements of each detail.
The second phase calls for some data capture, necessary to obtain the rendering of a three-dimensional georeferenced model of the measured object, according to a series of steps which call for the alignment, overlapping and comparison among the measured points clouds, their noise reduction and
simplification, the following definition of a triangulated mesh from the clouds, the mesh simplification, integration and completion and finally its mapping through high-definition images (see Figure 2).
Although this process is very complex, it requires several specific skills, it is commonly adopted in survey operations by now, whether it be a very complex and big architectural monument or a smaller building.
Which are the rendered object characteristics which can be obtained from a 3D survey?
Some of its positive aspects are: first of all, the opportunity to extract metric dimensional information in every phase of the process, with absolute precision in the order of centimeter, if not of millimeter; the surface description through a triangulated mesh with a high-definition mapping, that would seem acceptable, to a first approximation; accessibility and usability; the possibility of extracting further specific piece of graphic drawings in a short while.
Some of the negative aspects are: the uniformity and uniqueness of the model, which is not defined by single elements; the error and shift compared to the real model, due to the presence of noise on the datum and of gaps in the not accessible parts; the model complexity, such that different procedures and complex processing are required; the different accuracy of measures as distance changes; the approximation of the rendered from survey model compared to the real one.
The whole process is characterized by some crucial steps, which concern both the cloud and the mesh processing and which qualify the survey and the consequent rendering. The key elements of the procedures related to point clouds are: the points correspondence, the cloud alignment, the noise reduction, the detection of the best points.
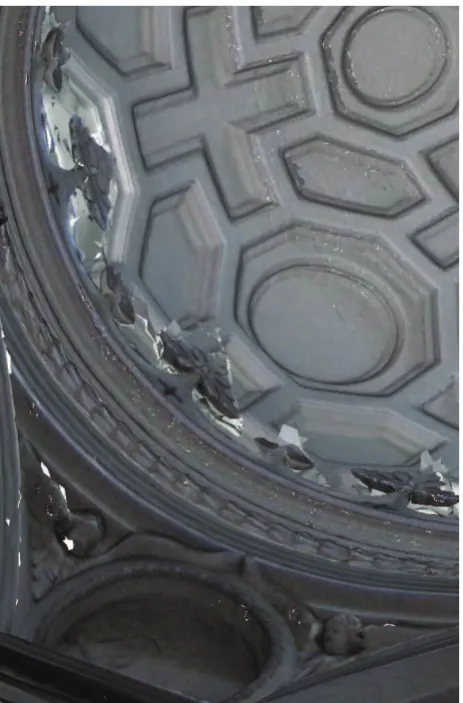
Figure 1. The San Carlo alle Quattro fontane vault. Photo picture
The basic elements for the definition of the mesh are: the mesh/object correspondence, the integration between image based mesh and range based mesh, the spike removal, the mesh simplification, the best shape detection, the texture projection on the mesh and the correspondence between texture and real model.
On the basis of these considerations, the fields where it is possible to optimize the whole process, improving the survey quality and the correspondence between rendered and real models and minimizing processing time and regular errors, are: point cloud noise reduction, the best shape detection and, above all, the phase which concerns the mesh definition, which isn’t suitable for the architecture description, but for localized free form parts (decorations, plastic or sculptural elements etc.). In the specific case of the architectural survey, the rendering model has to achieve two main purposes: the first one concerns the measurement of all the elements, i.e. the quantification of dimensional information, from general to specific, and the second one concerning the representation, i.e. the graphic description of the building characteristics according to universally recognizable architectural elements. To achieve these goals we have used a model, commonly defined as
knowledge based model (Drap, et al., 2003; De Luca, et al., 2006), that replaces the triangulated mesh model in the case of architectural survey.
Figure 2. Range based model
2. ARCHITECTURAL SECTIONS
The survey of an architectural building is, ultimately, an act of knowledge, so it is part of a complex and wider process of analysis and study (Docci, Maestri, 2009). Therefore, it is, clearly, fundamental to have an accurate knowledge based model of the building acquired trough archive sources, and awareness of the existence of multiple factors which influence the reading of collected data (peculiarity of materials, characteristics of implementation, different levels of decay, restoration works, etc.).
The working method we propose uses sections as main elements for the development of the model. An architectural section linked to the related extrusion path makes it possible, in theory, to build a three-dimensional model of any element, once its geometric characteristics are known. Consequently, from a model built this way, it is possible to extract sections along the different planes which describe the real object in his dimensional, formal and geometric characteristics.
In the framework of the different phases which organize and give substance to the survey, this test aims at verifying the actual potentialities of the used method applying it to the study of an architectural building whose interpretation is very complex: the Chiesa di San Carlo alle Quattro Fontane in Rome, by Francesco Borromini, and which had been already extensively studied (Canciani, et al, 2012).
shape of the surveyed elements, using the study of the architectural details as a starting point.
In the case in point, the main difficulty to define a vertical section is constituted by the peculiarity of the mouldings created by Borromini, who detaches himself from the sixteenth-century treaties modifying geometries, profiles, combinations and proportional ratios of the single elements (Bösel, 2000; Milizia, 1781; Maestri, 2006; Portoghesi, 2001). So, it became essential to study, preliminarily, some detail drawings made by Borromini (in particular some of those kept in the Albertina in Vienna), like the Azr203, in which there are some unusual profiles (Azr 1268v) obtained connecting each other, without interruption, classic style mouldings (for example a cyma moulding and a scotia) or sinuous curves, plastically modeled, followed by real intaglios which fragment and multiply edges. In these circumstances, the interpretation of data obtained firstly from the point cloud sections becomes more complex for two reasons: 1) for the presence of noise areas inside the cloud, due to the impossibility of surveying the most marked grooves or to errors which occur in the presence of the most fragmented corners; 2) because both the type of usable mouldings and the possibility of connecting them according to different proportional ratios are wider. In similar circumstances, it seems to be difficult to create a library of preconceived theoretical models, which can be defined simply exhaustive, tested in other case studies (De Luca, et al., 2006; Trevisan, 2005).
3. DATA EXTRACTION
3.1 Related works
Point clouds study aimed at getting continuous and geometrically defined (parameterizable) sections set up problems which are commonly found in many applications. Computer graphics and mathematics give some answers to the questions arising from reverse engineering and architectural survey (with the consequent questions about representation). Many different methods have been proposed over the years. Here we briefly describe only some of the most relevant ones for our work.
In order to ease their reading they have been divided in three macro categories: Point clouds sections, 2D shape recognition and 3D shape recognition.
3.1.1 Point clouds sections: Among the commercial software programs which have been tested (CloudWorks for Autocad, Geomagic, Rhinoceros and LupoScan) only some of them have a function that, given a plane of section, automatically gets a curve (Nurbs or polyline made of arcs and lines) with the minimal requirement of continuity (by the way, in many cases this fundamental condition is not satisfied). In some cases the positive conclusion of the process depends on point cloud size or otherwise on the possibility of setting parameters to determine whether the curve will be a Nurbs or made of lines or circular arcs.
In general, any software has positive and negative aspects, without however definitively solving the problem.
Other studies introduce interesting elements, such as for example the analysis of the “mean section” or the possibility of inserting units of measurement different from those of the decimal metric system (foot, palm, etc.) (Trevisan, 2005).
Figure 3. Detail of image based triangulated mesh
Figure 4. Detail of range based triangulated mesh
Software programs arised from these studies work directly in CAD environment, or as plug-ins, but they require manual design of the section and rarely produce a best fit between points and the designed curve. In other cases there is a limit for the size of a point clouds to be imported, but one of the most common problems is related to the fact that the generating parameters of the section are uniformly applied to the entire section. In practice, in order to define line segments more coherent with the scanned object, the tolerance among segments has to be increased. This process involves the loss of important informations on details, particularly in the presencs of mouldings. In almost all tested software programs the parameters used to define the line section are:
• Thickness, to define a volume around the plane where points are selected and possibly projected on the plane; • Tolerance, to control noise and alignment problems of
different point clouds;
• Length, minimal measure of the constructed segments; • Distance, minimal among the selected points.
Many studies deal with this subject. In some cases (Wu, et al., 2004) the construction of a three-dimensional model rely on a sequence of many nearby sections. The same method is applyed to mechanical or freeform objects (Kyriazis, et al., 2007; Protopsaltis, et al., 2010) with the goal of representing a generic shape, in the best possible way. The result is achieved with the use of different procedures such as the definition of the Convex Hull or the application of Voronoi diagram for the definition of concave parts.
In most cases, the generated curves are B-spline of degree 3, because they are the closest to the representation of a freeform object and the simplest to compute. Nevertheless, the use of B-spline in the field of architectural survey is not the most appropriate. In fact, except for some frieze or sculpted groups, the requested section will be made, usually, by line segments and/or circular arcs.
3.1.2 2D shape recognition: some software programs, commonly used in architecture, have builted-in functions to recognise stright lines, circles, rectangles and/or squares and they can be applied both to point clouds and triangular mesh. The development processes of these shapes are however only partially automatic and the recognized shapes are much limited. The studies presented below, on the contrary, allow recognition of any 2D shape, also with very difficult conditions.
The characteristic of these studies is that they were originated mainly for raster images analysis, are based on probabilistic analysis and are used to deal with reverse engineering problems.
Generally, such studies have not been dedicated specifically to
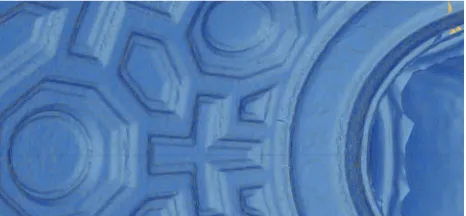
Figure 5. Portion of range based model (reflectance image)
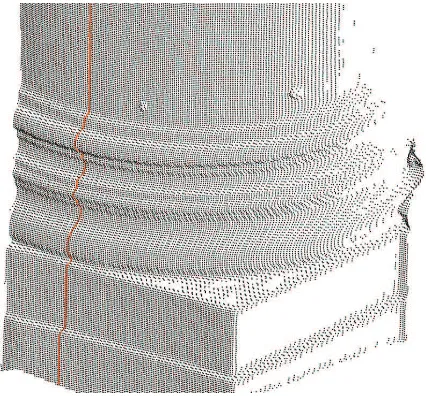
Figure 6. Portion of range based model (point cloud and sub selection of sections)
architecture and they don't consider its specific characteristic but they offer interesting procedural ideas.
In particular, for the present work, we have considered the procedure “recover and select” (Benko, et al., 2001; Leonardis, et al., 1997) and the use of circle written in Pratt's form (writing any segment as a circle and approximating a stright line with very large radius circle) (Pratt, 1987).
3.1.3 3D shape recognition: most of the studies and software programs commercially available focus on the identification of 3D shapes for applications in the reverse engineering and industrial sites survey field. In these cases the possibility of identifying automatically pipes, elbows, flanges, valves, reducers, tees and more, makes work very expeditious. A lot of these software programs identify elementary surfaces such as spheres, planes, cylinders and some of them are able to
reconstruct objects dividing them in several parts. In the case of architectural buildings, problems are deeply different and these tools are not completely adequate.
Studies which deal with specifically to the cultural heritage are divided into two “families”. The first one focuses on the decomposition of complex geometrical shapes in simpler and simpler shapes. In particular, in some cases (Schnabel, et al., 2007) the RANSAC (RANdom SAmple Consensus) method is applied searching for general geometric shapes, planes, spheres, cylinders, cones and tori, assigning a score based on the quality of the obtained surface. In other cases (Schnabel, et al., 2008) a topology graph that describes the neighborhood relations among the primitive shapes detected in the point-cloud data adds to the randomized research. The typology graph makes it possible to create a net of objects to which it is possible to assign some characteristics. The other family of studies, in which our work is included, concerns “Knowledge Based” or “HBIM” models.
3.2 The proposed procedure
In architectural survey methodologies (and not only that) it is common to adopt, by now, an approach based on the use of an
expert system, that is a system formed by two components: a structured complex of knowledge based models, describing the morphological features of an object through geometrically constructed two/three-dimensional models, and a set of rules which describe the knowledge based model topological (reciprocal positioning, alignment on horizontal or given axis, etc.) and semantic (relationship among its parts, proportionment, etc.) features. We can cite, in the field of archeological survey, the method proposed by Drap, Senturier and Long (Drap, et al., 2003) for amphorae survey, defined by pre-established three-dimensional models; for architectural survey an interesting method is the one proposed by De Luca (De Luca, 2011), based on a semantic model structured on architectural orders, as the one that makes use of HBIM system (Murphy, et al., 2012), based on libraries of objects defined by historical and documentary investigation. In this context is placed the method based on an expert system proposed for the study of standardized elements such as Polonceau trusses (Canciani, 2005) is placed in this context.
On the basis of the cited experiences and of some test made in the context of architectural survey, our procedure provides for the use of an expert system, where any single element is defined by the section and the extrusion path, as already mentioned in par.2.
model, avoiding the development of the triangulated mesh (which isn’t calculated), to maintain, in any case, the measurability and representativeness characteristics of the rendered object, and, to describe this object through a hierarchical system structured according to single elements, to which a data information base can be linked.
3.3 Algorithms
The point cloud processing is done using Wolfram Mathematica software: data are first imported as text files of spatial coordinates, processed to get section curves, with marked relevant points, and then exported in .dxf format to be used in rendering programs.
We used two different methods:
• Choose the best section plane (automatically testing many different sections to reduce noise, maximize the number of relevant points or selecting a mean section). Select the set S of points at distance less than d from the plane, fixing d so that their projection on the plane has sufficiently high density. Determine a subset of ordered points of S which define a polyline that fits the points of S. Finally regularize the polyline to reduce the number of segments detecting straight lines, circular arcs and angular points (see Figure 9).
• Choose the best section vertical plane and fix a stright line r on it. Select the set S of points in the spherical wedge centered at θ0 and amplitudeΔθ. To get the section curve
fix a point C on r and consider the volumes V(θ0 ,φ0) in R3
spanned by the solid angles with vertex in C, that is V(θ0
,φ0) ≡ {Pθ,φ: |θ - θ0|< θinc , |φ - φ0|< φinc}at fixed steps Δθ
=2θinc and Δφ =2φinc . We then take the barycenter Q
among the points of V(θ0 ,φ0) and project it to the plane of
section. Differently from previous method, the problem remains three-dimensional.
In both cases the end points of the polyline are found thinking of the polar equation of a planar curve: taking the mean value for Q(φ) atan increasing angle with respect to a fixed pole C. Note that the selection of C is automatic, but results could depend substantially on the choice of this and other parameters. In the case study of the dome, sections are vertical so we take r passing by the cloud barycenter and point C on r with height h = 1.6m (laser scanner) or h=16m (second level of coffers). In the case study of the columns, sections are still vertical but we take the pole C sufficiently far from the column and at an intermediate height. In the second method, P lies inside V(θ0 ,φ)
in spherical coordinates if
θ0 - θinc < arctan(y/x) < θ0 + θinc
(1)
φ - φinc < arcsin(z) / ||P- C|| < φ + φinc
where θ0 = plane section angle
C= pole of coordinates (xc, yc, zc)
x, y, z = coordinates of (P- C) φ = polar angle with respect to C
and then evaluate the barycenters Q(φ0), varying φ0, of points
inside V(θ0 ,φ0) and project them as
C + [ ( Q(φ) – C )• Pθ0 ,φ0] Pθ0 ,φ0 (2)
on the plane of sections given by θ0 .
To detect longer straight line elements we evaluate the normals ni of any consecutive pair of points Pi and Pi+1 on the ordered
set of the polyline section and discard points Pi for which the
inclination between ni and ni+1 is smaller than a given error.
Using normals we also automatically select (1) approximate angular nodes, (2) inflection nodes, and (3) maximum overhang nodes (see Figure 9).
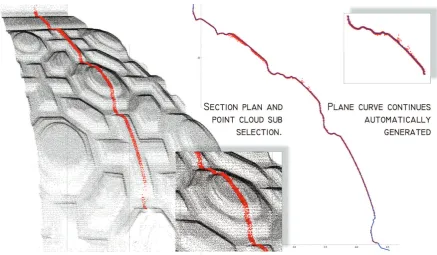
Figure 7. Portion of range based model (section plan and point cloud sub selection)
4. CASE STUDY
4.1 Column base
In order to test the effectiveness of the method, it was firstly applied to one of the coloumn bases which articulate the inner space of the church, in order to compare a series of sections obtained from the point cloud with the profile surveyed directly through a profilograph. In brief our work aimed at obtaining a knowledge section, from the direct survey, in order to compare it to the best section get from the point cloud according to the procedures described in the previous paragraphs.
Therefore, every moulding was detected on the profile obtained from the direct survey through discontinuity nodes and it was classified, to a first approximation, according to two criteria: curvilinear mouldings, with or without inflection (o flex), and rectilinear mouldings. A detail analysis of the single elements, in order to define the geometric characteristics, followed. A first sequence of mouldings, from the imoscapo down, which can be connected to classic-type geometries, emerged: upper Torus, Fillet, upper Scotia, Fillet Tondino Fillet, followed by a lower Scotia (which is, here, higher and less curved compared to classic models) which is linked without Fillet to the lower Torus, so, drawing a continuous curve.
The following step consisted in verifying proportional ratios among the analyzed elements, whose result showed a remarkable variation in the proportional ratio between the upper Torus and the sequence Fillet - Tondino - Fillet, which instead of the usual 3 to 1, have, here, the same height.
Therefore, on the drawing obtained by the profilograph, in addition to the detection of contact nodes among the single mouldings, characterized by variation of the normals, maximum depth or overhang points (in case of respectively concave and convex mouldings) and flex points (in case of more complex mouldings) were determined. The comparison between the Knowledge section and the best section implies the detection of all the listed elements also on the latter (see Figure. 9).
The individuation of the range in which the variation of the tangent to the normal occurs, for each molding, delimits the possibilities of geometric determination of the profile, which can be obtained from the point cloud through the application of specific algorithms.
In the specific case of the details created by Borromini in the Chiesa di San Carlo, this range is wider than the classic tradition moldings. The continuous comparison between computer data and real data was essential to avoid possible erroneous interpretations. The final result is a sequence of curvilinear and rectilinear elements which can be linked to the profile effectively created, and can be represented in scale 1:20 for the definition accuracy.
4.2 Impost cornice of the vault and ceiling coffer
Vice versa, the same point cloud doesn’t render the profiles of the most far architectural elements with the same reliability. A sequence of moldings, located high up compared to the survey station, isn’t intercepted in all its development and it is rendered with a certain percentage of noise areas. It being understood that there is the possibility of obtaining better results from scans made on planes placed at heights closer to the objects which need to be measured, one wanted to verify, in any case, the possibility of drawing the dome impost cornice.
In this case, lacking the possibility of verifying directly the sequence of moldings, one relied on the study of iconographic archive documents. In particular, the survey drawing (Azr 203) made by Bernardo Borromini was analyzed .
Figure 8. The San Carlo column base. Detail of range based model with extraction of section
It shows, from the top, the dome profile, the flower and palm decoration of the impost, the entablature and continues down till the drawing of the entablature above the columns. On the drawing it is possible to read span measures, partitioning, corrections, notes, elements useful for the definition of detail drawing. Information which can be inferred from the archive drawing were compared to the profile obtained from the point cloud. The architrave was reshaped with a good approximation, thanks to the contained objects and to the relative simplicity of the single moldings, while from the frieze decorated with the laurel oak bundle, when the photo ray inclination touched the overhangs of the architectural elements it determined different areas of noise. The frieze decoration has several interpretation problems along the section and it was reshaped referring to the photographic shots and other Borromini’s autograph drawings relating to other projects (Azr 416v).
The architrave section, for the reasons already mentioned (distance and angle of the photo instrument, evident overhangs and recesses of the profile) was rendered in scale 1:50: this ratio makes it possible to neglect the smallest elements in favor of the graphic representation of only the main elements, which characterize it.
The final result is a sequence of moldings fruit of an interpolation among data captured through the instrument, knowledge about the work and its author, and the things it is possible to see through a telephoto lens and generally through a photographic shot. The same procedure was followed in the drawing of ceiling coffers, moving the objective from the drawing to the dimensional definition of the sequence which characterizes the vault intrados.
5. CONCLUSIONS
Although the method we propose was tested for few elements and with very particular characteristics, peculiar to Borromini’s work, we finally think that procedures for the extraction of sections directly from the point cloud can be a further step in the study of the 3D survey in the architectural field.
As a matter of fact there are some ameliorative aspects which concern in particular: 1) the speed of operations; 2) the simplification and stability of algorithms for the shape
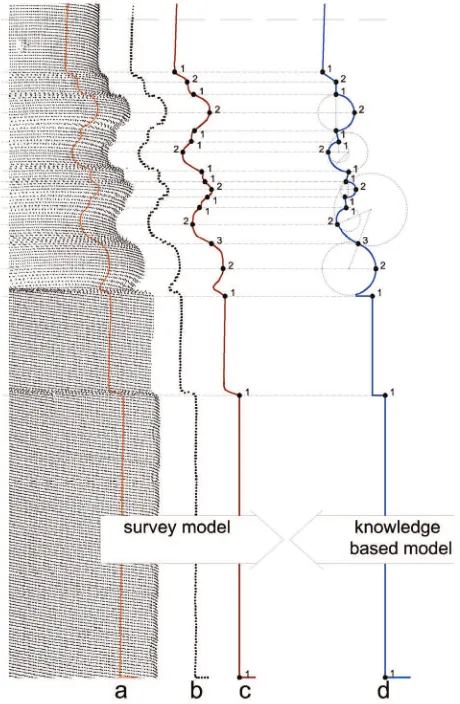
Figure 9. The San Carlo column base. Comparison between sections of survey model and knowledge based model a) marked points at a fixed distance from the plane of section; b) selected points from a)
c) elaborated polyline with relevant nodes: 1 (angular points), 2 (maximum overhang points), 3 (inflexion points) d) knowledge based section with the same relevant nodes
extraction; 3) the correspondence among real model, survey model and knowledge based model.As far as the first point is concerned, we believe we can streamline survey procedures working directly on the point cloud, avoiding the triangulated mesh processing.
For the second point, calculation algorithms are specifically devoted to the definition of architectural sections in their geometrical construction and identification of points relevant to the construction itself (angular nodes, maximum overhang nodes, inflection nodes).
For the third point, just the comparison among significant points, extracted in the survey model and knowledge based model, makes it possible to, ultimately, improve, complete and correct the section, and also the path, in order to make the section corresponding to the real model.
6. REFERENCES
Benko P., Martin R.R., Varady T., 2001. Algorithms for reverse engineering boundary representation models. Computer-Aided Design Vol. 33, pp. 839-851.
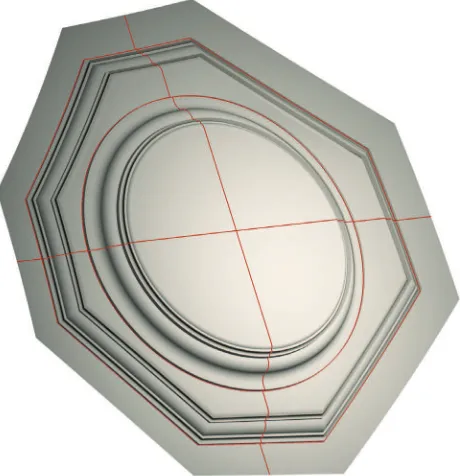
Figure 10. The San Carlo column base. 3d model created by extrusion of section on a circular path and a square path
Bösel R., Frommel C.L. (curated by), 2000. Borromini e l’universo barocco, Electa, Milano.
Canciani M., Falcolini C., Spadafora G., 2012. From complexity of architecture to geometrical rule. The case study of the dome of San Carlino alle Quattro Fontane in Rome. In: Less More Architecture Design Landscape | Le vie dei Mercanti. Napoli, Capri.
Canciani M., et al., 2003. Laser Scanning and close range photogrammetry: towards a single measuring tool dedicated to architecture and archaeology. In: Cipa XIXth International Symposium, Antalya, Turkey, Vol. XIX, pp. 629-634.
Canciani M., 2005. Fotogrammetria e conoscenze per un nuovo modo di rilievo e di rappresentazione architettonica. Relazione finale della Ricerca “Galileo” Italia-Francia 2004-2005.
De Luca L., Veron P., Florenzano M., 2006. Reverse engeneering of architectural buildings based on a hybrid modeling approach. Computer & Graphics 30, pp. 160-176.
De Luca L. 2011. Towards the semantic characterization of digital representations of architectural artifacts: programmatic lines of research. In Disegnarecon. Tecnologie per la comunicazione culturale.
Docci M., Maestri D., 2009. Manuale di rilevamento architettonico e urbano, Laterza, Roma.
Drap P., J. Seinturier, L. Long 2003. Archaeological 3D modelling using digital photogrammetry and expert system. The case study of Etruscan amphorae. In: 3ia 2003 conference. Limoges.
Kyriazis I., Fudos I., Palios L., 2007. Detecting features from sliced point clouds. GRAPP (GM/R) pp. 188-196.
Leonardis A., Jaklic A., Solina F., 1997. Superquadrics for segmenting and modeling range data. IEEE PAMI, 19(11), pp.1289-95.
Maestri D., 2006. San Carlo: disegni, architettura e simboli. In Strollo R.M., Contributi sul barocco romano, Aracne.
Milizia F., Principj di Architettura civile, Stamperia Jacopo De’ Rossi, 1781.
Murphy M., McGovern E., Pavia S., 2012. Historic Building information Modelling - adding intelligence to laser and image based surveys of European classical architecture. Journal of Photogrammetry and Remote Sensing, special issue Terrestrial 3D Modelling.
Portoghesi P., 2001. Storia di San Carlino alle Quattro Fontane, Newton&Compton, Roma
Pratt V., 1987. Direct least-squares fitting of algebraic surfaces. Computer& Graphics (SIGGRAPH 87), Vol. 21(4), pp. 145-52.
Protopsaltis A. I., Fudos I., 2010. A Feature-Based Approach to Re-engineering CAD Models from Cross Sections. Computer-Aided Design & Applications, 7(5), pp. 739-757.
Remondino F., 2011. Rilievo e modellazione 3D di siti e architetture complesse. In Disegnarecon. Tecnologie per la comunicazione culturale.
Remondino F., Lo Buglio D., Nony N., De Luca L., 2012. Detailed primitive-based 3d modeling of architectural elements In: XXII ISPRS Congress, Vol. XXXIX-B5.
Schnabel R., Wahl R., Klein R., 2007. Efficient RANSAC for Point-Cloud Shape Detection. Computer Graphics Forum, 26, pp. 214–226.
Schnabel R., Wessel R., Wahl R., Klein R., 2008. Shape Recognition in 3D Point-Clouds. In: Proc. Conf. in Central Europe on Computer Graphics, Visualization and Computer Vision.
Trevisan C., 2005. Analisi geometrica e proporzionale di particolari architettonici rilevati con laser scanner. In M. Docci, a cura di, Metodologie innovative integrate per il rilevamento dell’architettura e dell’ambiente, Gangemi, Roma, pp. 296-304.
Wu Y., Wong Y., Loh H., Zhang Y.F., 2004. Modelling cloud data using an adaptive slicing approach. Computer-Aided Design, Vol. 36, pp. 231–240.