SOCIO-ECONOMIC VULNERABILITY AND SUSTAINABLE DEVELOPMENT IN
CONTEXT OF DEVELOPMENT VS. CONSERVATION DEBATE: A STUDY OF
BHAGIRATHI BASIN, UTTARAKHAND, INDIA
Nisha and Milap Punia
Centre for the Study of Regional Development, School of Social Sciences, Jawaharlal Nehru University, New Delhi-110067, INDIA- [email protected], [email protected]
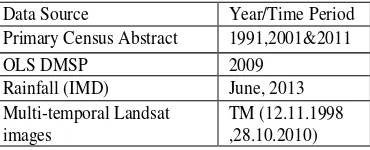
KEY WORDS: Social Vulnerability Index; Land Use Land Cover Change; Conservation; Sustainable development.
ABSTRACT:
A mountain system bound to have a different path of development owing to its fragile ecological and geological setup. Any drastic and abrupt changes in this system can have repercussion beyond mitigation in form of natural disasters. Remote sensing can play a key role in risk assessment and management, particularly when a few simultaneous reasons coincide, for example, susceptibility to natural disaster and the urban sprawl, spreading over highly vulnerable regions. The present study furnish socio-economic vulnerability mapping of the Bhagirathi basin through computation of the Socio vulnerability Index (SoVI). SoVI correlates vulnerability to natural or anthropogenic disasters to socio - economic development and illustrates how developmental parameters alter equation of potential effect and recovery in event of a natural catastrophe in the study region. An analytical framework has been imparted to understand possible triggering factors of disasters. Built up area expansion; land use land cover change (LULCC) – deforestation, conversion of forested land into agricultural land and residential settlements, and dam project area; road network development; urbanization; population growth & migration and pilgrimage activities are major drivers which put burden on limited carrying capacity of the natural resources. A guideline for policy making has been presented for an integrated and wholesome development incorporating regional developmental aspiration of the people and ingredients of sustainable development.
1. INTRODUCTION
Developmental debate in montane area has always been a controversial one, since one approach is of utilization of natural resources and other assets for conservation of the same for better ecological balance. Reality lies in between two with some trade off cost. Recent heavy precipitation event in Uttarakhand has disregarded the present developmental path and its directions (Rao et al., 2014). During 15–17 June 2013, incessant rainfall centered at Uttarakhand, caused devastating floods and landslides in the country’s worst natural disaster since the 2004 tsunami that devastated the country by killing thousands of people besides livestock (Das, 2013). Mountain ecosystems are commonly regarded as being highly sensitive to global change. Due to the system complexity and multifaceted interacting drivers, however, understanding current responses and predicting future changes in these ecosystems is extremely difficult (Loffer et al., 2011; Slaymaker and Hamann, 2009). The global change refers to changes having both natural and anthropogenic causes and encompass among other factors, climate change, land use land cover change, industrialization, urbanization and changes in atmospheric chemistry (Goudie and Cuff, 2002). Limited information is available about the vulnerability of mountain ecosystems to climate change. Intuitively, it seems plausible that these regions where small changes in temperature can turn ice and snow to water, and regions where extreme slopes lead to rapid changes in
climatic zones over small distances, will show marked impacts in terms of biodiversity, water availability, agriculture, and hazards that will in turn have an impact on general human wellbeing. Vulnerability refers to the degree of loss that may occur to elements at risk due to a particular hazard. It is commonly accepted that vulnerability indicates the susceptibility and potential damage of any element at risk having some economic value (Ebert, 2006). Potential effects on mountain ecosystem due to the drivers of climate change and LULCC will impact on whole region. Urban population growth of the region has increased by 4.6 % from 2000 to 2011 (Census 2001, 2011). Therefore any change in this mountain region bound to have bearing vis-à-vis socio-economic vulnerability of inhabitant communities. Socio-economic vulnerability attributed to any catastrophic event in these fragile montane systems has deep ecological liaison with development and its indicators i.e socio-economic infrastructure promoting accessibility.
1991; Varunawat Hills landslide in Uttarkashi 2003; Uttarakhand flood 2010; cloudbursts in Uttarkashi 2012; and recent Uttarakhand disaster 2013 (HESCO, 2013). Was it due to the commercial forest felling that was prevalent until around 1980s, or the recent rampant terrain tampering for hydropower projects? (Rana et al., 2013). Ebert Annemarie et al. 2010 examines flood risk by considering natural factors and anthropogenic land use change and investigates processes of socio-spatial differentiation, aiming to evaluate their relevance for the attenuation of flood risk and its distribution across various socio-economic status groups.
Remote sensing technology is one proven strategy to better document, characterize and quantify risk assessment and management (Nayak and Zlatanova, 2008; Franci et al, 2014). This information is vital input for various developmental, environmental and resource planning applications, and regional as well as global scale process models. These kinds of databases are also important for national accounting of natural resources and planning at regular intervals (Rogan and Chen, 2004). Geographic Information System can be a helpful tool to analyse and map the vulnerable regions in their social context (Pickles, 1995). Geoghagen et al., 1998 have made an extensive review of the efforts to link social science and remote sensing for land use land cover change studies. Land covers are typically modeled as a function of biophysical and socio-economic variables and their interaction. These interactions are not straightforward and easily delineable, changing through time and across scales of analysis. Land use and land cover systems may not respond as expected of the driving forces as land cover is a function of not only socioeconomic and bio-physical variable, but also of itself. Objectives of typical land use and land cover change studies, when sought to be located within political and economic contexts, involves what is euphemistically referred to as 'Socialising the Pixel' and 'Pixelising the Social'. Socialising the pixel is to take remote sensing imagery beyond its use in applied sciences. Two avenues of research of this kind offer the potential to shed light on land use and land cover change: mining the pixel and modeling from the pixel. Mining from the pixel involves, seeking social meaning in remote sensing imagery. Information and indicators relevant to such concerns as economic well-being or criticality are discerned. Observations from such information and indicators could signal the underline processes that give rise to land use and land cover change.
Thus, in this study attempt has been made to harness the potential of remote sensing datasets, GIS techniques and analysis of information for disaster management. It also explores the levels of socio-economic vulnerability calculated through SVI in Bhagirathi basin depicting developmental concern of the region. An analysis of possible drivers of LULCC which could be intermediate cause for natural or anthropogenic disaster, i.e. floods, landslides having impact on the lives of residents. This study adopted both spatial and socio-economic analysis with help of remote sensing and socio-economic data from census of India. Relevance of this study lies in purveying with guidelines to policy makers regarding vulnerability assessment of the region and a relationship of the developmental projects with sustained
livelihood alternatives for inhabitants having ecological sensitivity of the region in background.
2. STUDY AREA
Figure 1. Location of the study area
Selected study area is Bhagirathi basin, which is located between the latitude 31° 30’ 00” N to 30° 06’ 00” N and longitude 78° 06’ 00” E to 79° 30’ 00” E in Garhwal Himalayas (Figure 1). The basin is defined in the north by the international boundary, and by the water divide between Satluj and Bhagirathi basin. In the south, Devprayag (the confluence of Alaknanda River and Bhagirathi River) marks the limit of the basin. The basin limits are marked by the water divide between Bhilangna Ganga (a tributary of Bhagirathi River) and Mandakini River (tributary of Alaknanda River) on the east, and water divide with the Yamuna basin on the west (Sangewar and Shukla 2009). The catchment can be subdivided into the watershed of the Bhagirathi, Bhilangana, Kaldi, Pilang, Jalandhri and Jahnvi Ganga.
literacy rate, female literacy rate and child sex ratio. Economic indicators contains five variables i.e total work participation rate, percentage of female worker to total workers, percentage of main workers to total worker, percentage of main female workers to total workers and percentage of net sown area to total area. Infrastructure indicators consists of eleven variables i.e. number of primary & middle school per 500 population, number of secondary ,senior secondary school; college & other per 1000 population, number of medical (allopath , ayurvedic) institution per 1000 population, number of dispensary per’000 population, number of primary Health Sub-Centre (PHSC) per 3000 population, number of Primary Health Center (PHC) per 20000 population, number of post & telecom facility per 1000 population, number of bank facility per’000 population, drinking water facility, communication facility and power/Electricity facility.
After sorting out the data following steps was performed on MS excel and SPSS. Based on whether the indicators are positive or negative it is normalized. Upon receiving normalized values, the weights in the computation were determined by using factor loadings and Eigen Values from Principal Component Analysis. Then the best and worst values are identified in an indicator, which will depend on the nature of the indicator. In case of a positive indicator, the HIGHEST value will be treated as the BEST value and the LOWEST, will be considered as the WORST value; and vice versa.
(1)
Weights are determined after finding Eigen values. The following formula is used to determine the SoVI by calculating the index as shown below-
I = (2)
Where, I is the Index, Xi is the ith Indicator; Lij is the factor loading value of the ith variable on the jth factor; Ej is the Eigen value of the jth factor
Based on the SoVI, assign RANK in ascending order. The Highest Index with RANK ONE will be treated as the BEST means low Social vulnerability and the LOWEST Index, with last rank will be treated as the WORST means high level of social vulnerability. To determine the most and least vulnerable villages ( e.g.,the outliers based on a normal curve), the SoVI scores were mapped based on standard deviations from the mean into seven categories ranging from -2.5 on the lower end to + 2.5 on the upper end. Mapping of social vulnerability of the basin has been done with the help of Arc GIS 10 software.
The purpose behind using SoVI mapping is that it summarizes various aspects related to input, process and outcome indicators, so as to be able to identify geographic areas that are prone to natural disaster in terms of overall social
Vulnerability. It helps to understand the position of a village vis-à-vis other locations like streams. To examine possible drivers for LULCC triggering natural or anthropogenic disaster, LULC map of Tehri and Uttarkashi have been used for deploying the built-up area increment from 1998 to 2010.
Figure 2. Dataflow diagram for modeling Social Vulnerability Index
4. RESULT AND DISCUSSION
4.1 Social Development Index
To study social development index in the catchment, literacy rate female literacy rate and child sex ratio have been undertaken. These variables indicate the societal development for the region but when we relate it with the socio-environmental vulnerability then it becomes more complex. Relationship between education and vulnerability to disaster is not well understood, although education is associated with both income and poverty. People with higher levels of education are likelier to have access to and act upon varied hazard information from preparation to recovery (Tierney, 2006). For people with less education, the practical and bureaucratic hurdles to cope with and recover from disaster prove increasingly difficult to surmount (Morrow, 1999). Child sex ratio actually shows the status of women in the society and if the number of women would be less, less would be the development. Lower child sex ratio refers to lesser women wanted. Some studies demonstrate that more women die in disasters than men (UNDP, 2012) so they are more vulnerable to natural disaster. Overall the social development index basically depicts the development of the society and this inversely related to the vulnerability.
situated at the lower tract in the basin, 51 villages were showing very low level of SDI which were mostly located in upper tract of the basin. But in 2001(Figure 3B) these villages has progressed in terms of SDI and found that some villages which were situated at the upper basin scored high rank which means low vulnerability namely , Saundhgaon (0.68), Malideval chak Saur (0.7), Kandal (0.6), Kumai Gaon (0.7), Koti Lagga Tungi (0.6) etc.
A) B)
Figure 3. Social Development Index A) 1991 and B) 2001
4.2 Economic Development Index
The present section is an attempt for an assessment of the level of economic development and its regional distribution by combining five different variables of economic development. This index has been calculated for two different years 1991 and 2001 to see the temporal changes in terms of level of economic development. The score of economic development is marked with notable variations in its distribution among the villages of Bhagirathi basin.
A) B)
Figure 4. Economic Development Index A) 1991 and B) 2001
It is remarkable that the highest and lowest scores of economic variables were recorded in the village Makhaliyan chak (0.68), Pajgaon (0.64) and Chokhala, Kot Medhe lalasi chak (0.01) in 1991(Figure 4A). The general distribution shows that the region of very high economic development (more than 1.5 SD from mean) found in the lower basin that comes under Tehri region only expect two villages of Uttarkashi i.e Kanath (0.57) and Bhatusera (0.53) whereas in 2001(Figure 4B) the high economic development (more than 1.5 SD from mean) found in the 18 villages out of 1377
villages. All these villages lie in the lower tract in basin or in Tehri district except one village which is found in Uttarkashi district. Very low level of development (less than -2.5 SD from mean) found in only two villages that is Soman (0.002) in Uttarkashi and Panch Koti (0.113) in Tehri.
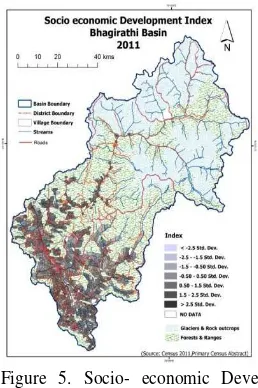
4.3 Socio-economic Development Index, 2011
The Socio-economic development Index is a relative measure of the overall social vulnerability. This index is output of seven variables ie. literacy rate, female literacy rate and child sex ratio, total work participation rate, percentage of female worker to total workers, percentage of main workers to total worker and percentage of main female workers to total workers. To determine areas of the most and least development, the SoEDI scores were mapped based on standard deviation into seven categories ranging from <-2.5(least developed) on the upper end to >+2.5 (most developed) on the lower end in 2011. From the analysis of Socio-economic development index, it has found that in 2011(Figure 5) the region of best socio-economic development (more than 2.5 SD from mean) is in the Tehri dristict namely Devprayag (0.92) , Koli Lagga Tungi (0.88) and in Dunda ( 0.88) Uttarkashi district. Least scores (less than 2.5 SD from mean) were found in seven villages in the region namely Magwal Gaon malla (0.27), Bhauri (0.26), Kuthur Malla (0.26), Sakniyani check (0.25), Huldiyana (0.21), Ashgarh (0.17) and Kakraru (0.082).
Figure 5. Socio- economic Development Index 2011
4.4 Infrastructure Development Index
important component to understand the relationship between the social vulnerability and natural disaster.
A)
B)
Figure 6. Infrastructure Development Index A) 1991 and B)2001
From the analysis of Infrastructure development index, it has found that in 2001(Figure 6B) the region of best infrastructure (more than 2.5 SD from mean) is in the Tehri dristict namely Ghanshali (0.37) and Pokhhri (0.31) whereas in 1991(Figure 6A) the best infrastructure development found in the Nalang (0.62) which is located near Gangotri town. From the overall picture of basin, it can be concluded that infrastructure is good near the towns and its periphery regions where vulnerability to natural disasters is minimal viewing the recovering strength. Although due to enhanced accessibility, owing to developmental projects such as road development, construction activities to accommodate tourists, residential settlement or agricultural farm development replacing forested land, areas with developed infrastructure has bore the brunt of natural or man-made disasters. The recent flood event in Uttarakhand bolsters the statement made above.
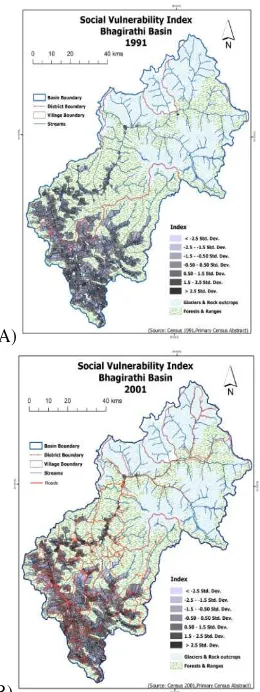
4.5 Social Vulnerability Index
Social vulnerability reflects the stratified conditions in which people commute for scarce, limited resources to mitigate against, respond to, and recover from disasters. All too often, people lack the means and opportunities to influence their risks significantly. In reality, risk is structured into the social institutions, social processes and policies, and social relationships that are difficult to influence for historically disempowered populations (Boyce, 2000). From the vulnerability paradigm, it is necessary to understand both the physical impact of disasters and social conditions, which underlie differential outcomes. The degree to which people receive transportation, shelter, warning, and protective action and are safe from injury, loss of life, or property damage, depends on their level of income, quality of housing, type of employment, and on whether or not they are subject to discrimination and prejudice. Thus, the vulnerability paradigm seeks to understand how social, economic, and political relations influence, create, worsen, or can potentially reduce hazards in a given geographic location. The SoVI composite score computed by the overall indexes i.e. Social Development Index, Economic Development Index and Infrastructure Development Index. The scores vary from 0 to 1. Zero depicts the high level of social vulnerability and 1 represents the low level of vulnerability. In 1991 it ranges
from 0.09 to 0.6 whereas in 2001 it varies from 0.004 to 0.89. Nalang (0.64) in Uttarkashi and Pipola (0.64) in Tehri found low level of Social vulnerability in 1991(Figure 7A) whereas in 2001, Ghansali (0.82), Pokhri (0.76) and Langoor (0.68) found low level of social vulnerability which are situated in Tehri Garhwal region. These villages overall get the highest score therefore it depicts that during disaster, these villages would be less affected, thus, social vulnerability is less. The high level of social vulnerability found in the Mulagaon (0.09) and Barol (0.12) in 1991, both villages situated in Uttarkashi district but in 2001(Figure 7B) Soman (0.0) in Uttarkashi and Panch Koti (0.01) in Tehri get lowest score. Hence, vulnerability in these villages would be high.
A)
B)
Figure 7. Social Vulnerability Index A) 1991 and B) 2001
4.6 Possible drivers for LULCC triggering disaster
agriculture etc. (Singh et al., 2010). A biophysical drivers are static whereas socio-economic are dynamic in nature. The study area found expansion in snow cover area during ablation period with the time at the higher altitudes which indicates that biophysical drivers were more dominate on higher altitude in the basin. During peak ablation period- between 1990 and 1996 the snow spread was between 20-35% of the watershed area while in 1998 the snow spread was almost 47% of the watershed area. The snow spread during peak ablation period after 1999 has again reduced and is a minimum of 14% in 2004 (Tangri, 2010) and further it has increased to 23.4 % in 2010. As slope and soil type are one of the important drivers, it determines the impact of LULCC. A small increases in slope angle above about 30 degrees translated into large increases in landslide erosion as the stress of gravity exceeded the strength of the bedrock (Larsen & Montgomery, 2012). And off course landslides are major phenomena in this region.
4.6.1 Extreme rainfall event in Uttrakhand (Flood occurred on 12-17th, June 2013): A Himalayan disaster
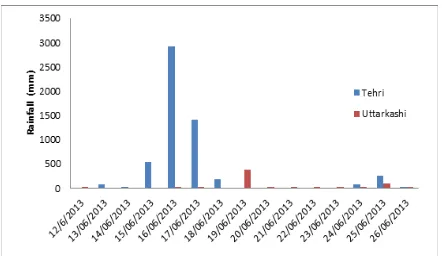
One of the impacts of land use land cover changes on climate change includes triggering of disaster which inflicts irreversible damage to ecology of the region, besides property and loss of life simultaneously. A wide range of slope failure, river erosion, wind erosion, avalanches, landslides and flash floods related problems which have been accentuated by the anthropogenic activities are designated is natural hazards. The recent flood leading to natural hazard is classic example. On morning of June, 17, 2013 an artificial lake ( Chorabari lake) above Kedarnath gave way due to a cloud burst and flood water and five to ten feet of debris fell on the temple town, Gaurikund, Rambara ( Dobhal et al., 2013). Pilgrims living in some 60 Dharmshalas in Kedarnath were also affected. Dehradun on 17th June, 2013 morning registered a record rainfall of 340mm. This amount of rain in June is seen almost after five decades. A cloudburst reported on 17th June, 2013 in the Kedarnath region in Uttarakhand state and subsequent increased river discharge in river Alaknanda and tributaries has led to catastrophic flood in the region. Heavy rainfall has wreaked havoc on the region with the fragile nature on the Himalayan range and poor soil stableness in its sharp slopes (Uniyal, 2013). Flooding in the hills has caused unprecedented destruction in Uttarakhand. Due to the increment in the snow cover area during June, the rate of rain induced snowmelt has increased which leading to the high discharge and run off in the rivers resulted flash floods in the basin. The tragedy has hit during the peak of the Char Dham Yatra season. Over a million come for this pilgrimage stretching over six month ending in September. Till June, 21 there were 31 completely destroyed buildings with one partially destroyed. Total being approx. 70,000 people were stranded, out of which 9831 stranded in Uttrakashi (Chandramohan, 2013). From the Figure 8 it is clear that water level in Bhagirathi River has constantly on the rise due to heavy rainfall. It has been noticed that villages of Tiloth and Joshiyara in Uttarkashi and some villages in Tehri facing the danger of being inundated.
Figure 8. Rainfall from 12.06.2013 to 26.06.2013 in Bhagirathi Basin, AWS data, Indian Meteorological Department
Figure 9. Major Flood impacted areas in Bhagirathi Basin 2013 (OLS DMSP 2009, NASA)
Buffer of 5 kilometer along the Bhagirathi River, clearly highlights the impacted areas on OLS DMSP satellite image. Impacted areas corroborates with illuminance around urban centers on the image.Most of the built up, road construction and dam construction activity is around the river which are showing in white in color in Figure 9. OLS DMSP carries very sensitive light sensors that can detect light emission (illuminance) from the earth surface at night (Small et al., 2005). In Bhagirathi basin most of the damage and loss happened in Uttarkashi and Harsil. They are the high impacted areas.
4.6.2 Urban growth and Development
areas. This causes the pressure on land. Although urbanization is an indicator of the development but it leads to the several environmental problems such as deforestation, soil erosion, water pollution etc. As this region is a hilly terrain, which is eco-sensitive, man-induced changes have larger implication on the land. Increasing population linked with accelerated urbanization has detrimental impact on land resources which are constrained by the carrying capacity of the land.
A) B)
C) D)
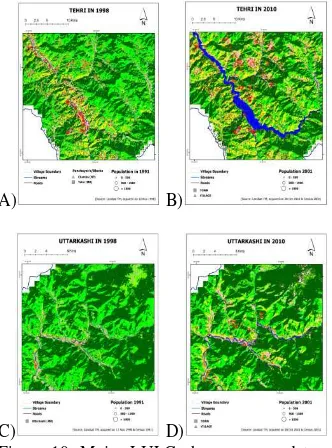
Figure 10. Major LULC changes around towns in Bhagirathi basin: A) Tehri in 1998, B) Tehri in 2010, C) Uttarkashi in 1998 and D) Uttarkashi in 2010.
Vulnerability of the region exacerbates as anthropogenic interventions increase changing the natural land cover pattern. After analyzing supervised classification of Landsat TM images of Bhagirathi basin for producing land use/land cover map, Tehri area has witnessed maximum change in the last decade of the twentieth century (Figure 10A & 10B). With the commissioning of the Tehri Hydropower project in year 2006, the formation of reservoir on Bhagirathi River was started which has become a large lake with an area of 42 sq. km. by year 2010 . The reservoir of the project helps in moderating floods in the downstream areas only marginal change has been observed in the New Tehri town in terms of enhancement in the built-up area. Density of vegetation has appeared to be slightly decreased in southern Tehri. From 1998 to 2010, appreciable changes have been observed in Uttarkashi town (Figure 10C & 10D), with considerable increase in settlements along the Uttarkashi- Chinyalisaur road and Uttakashi- Gangotri road. Density of built-up area has also increased.
4.6.3 Land use policies
Land use policies can be counted among the potential agent of land use change in the concerned region. A Land use policy decides the nature of present and future land use pattern for a better environmental system to live. These policies have tremendous impact on the present pattern of land use thus deciding future of overall region. One of the biggest change in
the land use and land cover scenario in the study region is Chipko movement of 1970’s which had triggered a response from the government to formulate the policies to prevent illegal and indiscriminate lumbering and falling of trees in the Garhwal region. Forest act of 1982 has provided a legal framework for conservation and protection of pristine forests and protected area. Establishment of Van Panchayat’s in the region has been a conducive factor in afforestation and reforestation in the region, ultimately affecting the land use and the land cover scenario.
5. CONCLUSION
Development priorities of the country/state are often derailed by disasters and therefore it is important to unite various risks reduction strategies with developmental planning. Remote sensing can play a key role in risk assessment and management, particularly when a few simultaneous reasons coincide, for example, susceptibility to natural disaster and the urban sprawl, spreading over highly vulnerable regions.
In the present study, it can be concluded that socio economic vulnerability is incumbent upon a balance between the developmental aspiration of people and a concern for conservation of resources in the mountain region simultaneously. LULCC is cumulative causation effect, determine by different drivers triggering natural or anthropogenic disasters. A holistic approach based on the sui generis development model of the study region according to its typical nature and needs, would be most appropriate encompassing regional aspiration of people for development with sustainable development.
REFERENCES
Boyce,J.K., 2000. Let them eat risk?, Disasters, 24(3),254-61.
Chandramohan, C.K, .21st, June, 2013. When death gushed in., The Hindu. pp 13.
Cutter, S.L., Boruff, B.J., and Shirley, W.L., 2003. Social Vulnerability to Environmental Hazards, Social Science Quarterly, 84(2), 242–261.
Das, S., 2013. Uttarakhand tragedy. J. Geol. Soc. India, 82, 20.
Dobhal, D.P., Gupta, A.K., Mehta, M. & Khandelwal, D.D. 2013. Kedarnath disaster: facts and plausible causes. Current Science, Vol. 105 (2), 171-174.
Durga Rao, K. H. V., V Rao, V., Dadhwal, V. K., & Diwakar, P. G., 2014. Kedarnath flash floods: a hyrological and hydraulic simulation study. Current Science, Vol.106 (4), 598-603.
Ebert, A., Welz, J., Heinrichs, D., Krellenberg, K., and Hansjurgens, B., 2010. Socio-environmental change and flood risks: the case of Santiago de Chile. Erdkunde, 64(4),303-313. DOI:10.3112/erdkunde.2010.04.01
Flanagan, Barry E., Gregory, E.W., Hallisey, E.J., Heitgerd, J. L., and Lewis, B., 2011. A Social Vulnerability Index for Disaster Management. Journal of Homeland Security and Emergency Management, 8(1), 1-24.
Goudie, A. S. and Cuff, D.J. (eds.) 2002. Encyclopedia of global change. Environmental change and human society. Oxford.
Franci, F., Mandavici, E., & Bitelli, G., 2014. Remote sensing analysis for flood risk management in urban sprawl contexts, Geomatics, Natural Hazards and Risk, 1-17. http://dx.doi.org/10.1080/19475705.2014.913695
Geoghegan, J., Pritchard, L. Jr., Ogenova-Himmelberger, Y., Chowdhary,R.R., Sanderson,S., Turner, B.L.II, 1998. "Socialising the Pixel" and Pixelizing the Social" in Land Use Land Cover Change. In People and Pixels Linking
Remote Sensing and Social Science, (Edited by
Liverman,D., Emilio Moran, R.R Rindfuss, Paul C .Stern), national Academy Press, Washington D.C., pp-51-69.
HESCO, 2013. Disaster in Uttarakhand –A report,
Himalayan Environmental studies and conservation
organization, Association for India’s Development.
Larsen, Isaac J. & David R. Montgomery, 2012. Landslide erosion coupled to tectonics and river incision, Nature Geoscience (5), 468–473.
Loffler, J., Anschlag, K., Baker, B., Finch, O.D., Diekkrüger, B.,Wundram, D., Schroder, B., Pape, R., and Lundberg, A., 2011. Mountain ecosystem response to global change. Erdkunde, 65(2), 189-213. DOI:10.3112/erdkunde.2011.02.06
Morrow, B.H., 1999. Identifying and Mapping Community Vulnerability. Disasters, 23(1)1–18.
Nayak, S. and Zlatanova, S., 2008. Remote sensing and GIS technologies for monitoring and prediction of disasters, Environmental Science and Engineering, Springer- Verlog Berlin Heidelberg.
Pickles, John., 1995, Ground Truth: The social implications of Geographic Information Systems (Eds), The Guilford press, New York London.
Rana, N., Singh, S., Sundriyal, Y.P., and Juyal, N., 2013. Recent and past floods in the Alaknanda valley: causes and consequences, Current Science, 105(9), 1209-1212.
Rogan, John and Chen, D., 2004. Remote Sensing technology for mapping and monitoring land –cover and land-use change, Progress in Planning, 61, 301-325.
Sangewar, C.V. and Shukla, S.P., 2009. An inventory of Himalayan Glaciers, Special Publication No.34, Geological Survey of India. 588.
Seto, K. C., Reenberg, A., Boone, C. G., Fragkias, M., Haase, D., Langanke, T and Simon, D., 2012. Urban land teleconnections and sustainability, Proceedings of the
National Academy of Sciences. 109 (20), 7687–92. DOI:10.1073/pnas.1117622109
Slaymaker, Olav., Spencer,Thomas & Embleton-Hamann, 2009. Geomorphology and Global Environmental change (eds.), Published by Cambrige University Press.
Small, C., Pozzi, F. and Elvidge, C. D. 2005. Spatial analysis of global urban extent from DMSP-OLS night lights. Remote Sensing of Environment, 96, 277-291.
Tangri, A.K., Chandra, R. and Yadav, S.K.S., 2010. Monitoring snow cover variations in Bhagirathi river basin, Uttaranchal Himalaya through remote sensing techniques. Technical Report, Department of Space &Technology, Government of India.
Tierney, K., 2006. On Risk and Disaster: Lessons From Hurricane Katrina, Social Inequality: Humans and Disasters. Philadelphia: University of Pennsylvania Press.
UNDP 2012. Uttarakhand State Action Plan for Climate Change. Government of India.