INTEGRATED SAR TECHNOLOGIES FOR MONITORING THE STABILITY OF MINE
SITES: APPLICATION USING TERRASAR-X AND RADARSAT-2 IMAGES
M. Rheault, Y. Bouroubi, V. Sarago, P. T. Nguyen-Xuan, P. Bugnet, C. Gosselin* and M. Benoit
Effigis Geo-Solutions, 4101, Molson Street, Suite 400, Montreal, Quebec, Canada, H1Y 3L1 - [email protected]
KEY WORDS: SAR, interferometry, mine site stability, permafrost, TerraSAR-X, RADARSAT-2
ABSTRACT:
The last three decades have seen significant mining development in the northern regions of Canada, where the freeze and thaw cycle of permafrost and corresponding surface subsidence and heave represent a significant challenge at all mining stages, from the design of infrastructures to the monitoring of restored areas. Over the past ten years, SAR interferometry has been widely used to monitor ground surface deformation. With this technique, changes in phase between two SAR acquisitions are used to detect centimetre to millimetre surface displacements over a large area with high spatial resolution. This paper presents the results of a project that aims to develop a SAR solution to provide useful information for environmental monitoring and assessing the stability of mining sites. RADARSAT-2 and TerraSAR-X images acquired during the summer of 2014 were used to measure the displacements of ground surface, infrastructures and stockpiles caused by seasonal changes in permafrost extent. The study area is an open-pit mine located in Nunavut, northern Canada, in the continuous permafrost zone. Results shown that surface displacements calculated from RADARSAT-2 and TerraSAR-X are very similar and in agreement with scientific and terrain knowledge. Significant displacements were observed in loose soil areas while none was detected in bedrock and rock outcrop areas. The areas most affected by active layer changes showed surface subsidence during the thaw settlement period. Thus, InSAR can be used as a tool to guide the siting and design of new infrastructure as well as highlighting risks in areas of unstable terrain.
* Corresponding author
1. INTRODUCTION
Mining represents one of the major driving forces of the Canadian economy. The last 30 years have seen significant mining development in northern regions, where the major challenge is the management of mining operations in cold and arid conditions with a very short summer period and under permafrost settings that are increasingly being impacted by changing climatic conditions (Walker, 2007). Today, the effects of this climate change are particularly important in northern environments where climate warming results in thawing permafrost. The seasonal freeze and thaw of the surface active layer leads to cyclical subsidence and heave, which can cause damage to buildings, highways, railroads, airstrips and other facilities (Couture et al., 2003; Smith et al., 2005; Larsen et al., 2011; Short et al., 2014). Thawing permafrost is prone to erosion and also produces excessive wetting and plasticity inducing sediments instability. The consequences affect large territories and there is an increased urgency to understand and monitor these changes and provide Northerners with the tools to adapt. Information on ground subsidence generated during and at the end of each thawing season (between July and September) is of great assistance in identifying areas that are at risk before significant damage occurs and thus, where possible, in taking the necessary measures to reduce the impact.
Ground subsidence due to permafrost thawing occurs at rates of a few centimetres during the summer season. This phenomenon needs to be measured with centimetre precision, at least twice during this period: once at the beginning of the season to establish a baseline for comparison and once at the end of the thawing season. Methods currently used for permafrost monitoring are mainly based on ground observations, typically
through ground subsidence probes (or soil temperature probes used with physical models) placed at different intervals over a given area. In addition to its high cost, this type of survey is punctual and unsuitable for continuous spatial monitoring since interpolation between measurement stations is often invalid.
Earth observation data provide continuous information over vast areas at a lower cost. Synthetic aperture radar differential interferometry (DInSAR) has been widely used to monitor ground surface deformation (e.g. ground subsidence, earthquake, volcanic field monitoring, etc.) because of its ability to remotely sense centimetre to millimetre surface deformations over large areas with a high spatial resolution (Short et al., 2011). This technique is based on the use of a pair of SAR images acquired over the same location at different times to measure small changes in the phase of a ground target’s returned signal. This change in phase (called interferometric phase or interferogram) is used to estimate the displacement of the ground target, leading to the production of terrain stability maps. DInSAR has notable advantages compared to traditional methods as it provides detailed coverage of the spatial and temporal variations of terrain stability. Several studies have demonstrated the usefulness of this technology to measure the permafrost-related surface deformation especially in northern locations that cannot be easily accessed for terrain work (Short et al., 2011 and 2014; Alasset et al., 2010; Chen et al., 2012).
movement of surfaces, infrastructures and stockpiles of materials caused by changes in permafrost extent. Complementary EO data and techniques, including satellite photogrammetry based on a GeoEye-1 stereoscopic pair, allowed producing basic topographic data at the 1:5,000 scale and a map of surficial deposits that helped in explaining the spatial distribution of DInSAR surface displacements obtained for the area under study.
2. STUDY SITE AND DATA
2.1 Study area
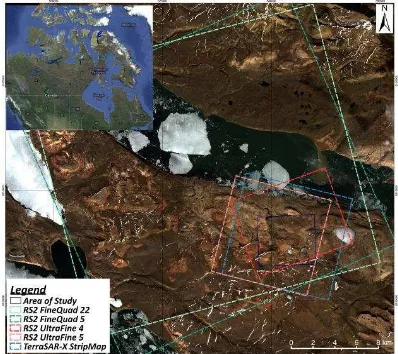
The study area is located in Nanisivik (73.04 N, 84.54 W), Nunavut, in the continuous permafrost zone of northern Canada (Brown and Walker, 2007). The selection of this region was motivated by the fact that the northern part of Canada is experiencing significant growth in mining activities. In this part of the country, climate warming has resulted in the thawing of permafrost at increasingly greater depths in certain places, making transport planning more complex. Deformations caused by the thawing of permafrost have been observed on certain continuous, except on moister sites. Local elevation ranges from 0 to 650 m above mean sea level. The seasonal variations in air temperature influence the surface snow cover periods. Annual average air temperature is -15 °C (Environment Canada). Snow cover is dominant from October to June. Snow usually starts to melt in June, when ground temperature rises above zero. The thawing season lasts until mid-September. The ground surface remains snow-free through July, August and sometimes September. Periglacial (permafrost) landforms, such as ice-wedge polygons, gelifluction lobes and hillside watertracks, occupy about a quarter of the area. The site of the Nunavik mine was used as a demonstration of the technology for the mining industry at large. Given the expansion of mining activities in Canada’s north, this site will serve as a benchmark to promote the technology for additional mine sites. Figure 1 shows the location of the study area as well as the footprints of TerraSAR-X and GeoEye-1 images on a Landsat-8 panchromatic band.
Figure 1. Footprint of RADARSAT-2, TerraSAR-X and GeoEye-1 images over the Nanisivik study site
2.2 SAR data
SAR images were collected between June and September 2014 and included seven TerraSAR-X, five RADARSAT-2 U4(A) and four RADARSAT-2 U5(D) scenes, all in HH polarization. All possible interferometric pairs (see Table 1) were tested. The perpendicular baselines were adequate. However, several interferometric pairs were invalidated for one of these three reasons: (i) when snow cover was dominant (images acquired in early June or late September); (ii) when the master or slave acquisition date was not acquired during surface subsidence period (surface heave started in early September); (iii) when the atmospheric component was too important. Valid interferograms are indicated with an asterisk in Table 1, and the numbers of the best pairs to show the displacements (valid interferogram with longer temporal baseline) are underscored.
produce a high-resolution – high-accuracy DEM (accuracy in Z < 1 m) used for interferometric processing; and (ii) to extract surficial materials (by photo-interpretation) for the validation of DInSAR displacements. The GeoEye-1 stereo pair also allowed extracting detailed planimetric information including hydrography (streams, lakes, basins), roads (paved and unpaved), infrastructures (buildings, water tanks, mining complex, etc.), wetlands and surface conditions (bedrock, rock outcrop, loose soil, relative moisture, etc.). Also, Landsat-8 images acquired on several occasions during the study period were used to monitor the evolution of the snow cover (to avoid low interferometric coherence situations) and to better understand the study area.
3. METHODS
3.1 DInSAR processing
The SAR sensor measures both the amplitude and the phase of the backscattered signal from the Earth’s surface. The amplitude contains information about the reflective properties of the target, such as surface roughness, shape, orientation and dielectric constant. The phase of a single image is not useful by itself. However, the variation in phase (the interferogram) between two acquisitions, related to change in the distance between the satellite position and any point on the ground, compared to a stable reference, contains valuable information on small surface displacements. Interferometric phase is a combination of different signal contributions:
Δφ = φorb+ φtopo+ φatm+ φnoise+ φdispl+ 2π.n (1) Where: φorb is related to relative satellite position; φtopo is a topographic component; φatm is the atmospheric interference; φdispl is the ground surface displacement component, i.e. the useful signal in DInSAR; φnoise is due to changes in the target response between the two acquisitions; 2π.n is an ambiguity component corrected by an unwrapping algorithm.
DInSAR processing (to get φdispl) was carried out using the GAMMA software (Werner et al., 2000) and the following steps:
- Co-registration of InSAR pairs (master and slave) and generation of interferograms Δφ;
- Interferogram flattening by subtracting φorb calculated from orbit data;
- Verification of coherence to avoid pixels with high φnoise; - Generation of differential interferograms by subtracting
φtopo calculated from external DEM coded to radar geometry;
- Verification/correction of the atmospheric component φatm using mitigation methods (e.g. low cut spatial filter); - Phase unwrapping (for example, using Minimum Cost Flow
algorithm) to correct for the 2π.n ambiguity;
- Conversion of the unwrapped differential phase φdispl into ground vertical displacement;
- Geocoding from SAR geometry to cartographic projection.
3.2 Validation approach
As reported by Short et al. (2011 and 2014), surface displacements caused by permafrost thawing can be assessed against surficial geology units and terrain properties (surface materials, depth of active layer, granular structure, soil moisture, etc.). In this study, a photo-interpretation expert used the GeoEye-1 stereo pair to identify surficial materials. Stereo viewing allows for the perception of depth and facilitates the
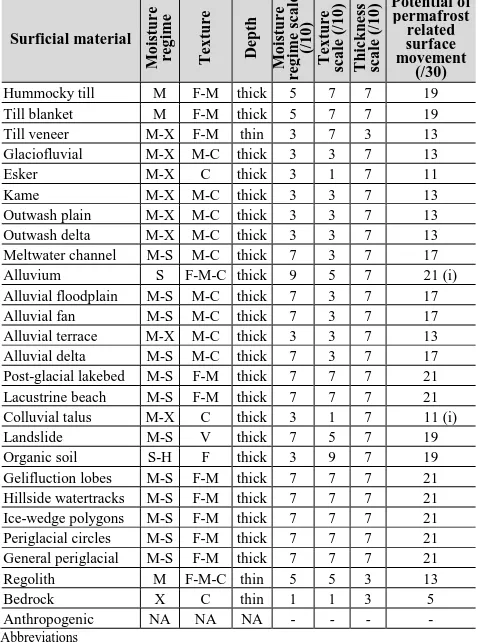
identification of landforms that are, with surface texture and colour, the principal elements used for the recognition and delineation of the different classes of surficial material, based on those used for the Map of Surficial Materials of Canada (Fulton, 1995), as listed in Table 2. Information on the glacial history of the area was obtained from Dyke and Hooper (2001) and Dyke (2004). Maps of surficial materials were used to calculate a new index to evaluate the « potential permafrost-related soil movement ». This approach estimates the potential level of freeze and thaw activity of the permafrost active layer based on the following:
-Depth of surficial material: a thick layer of surficial materials is prone to higher freeze and thaw activity than a thin layer; -Soil texture: soils with a finer texture retain more water than
coarse textured soils and are more sensitive to freeze and thaw driven movements;
-Soil moisture regime: some types of surficial material have specific topographic positions (e.g.: alluvial and organic deposits are generally found on valley floors and local depressions). These topographic positions combined to soil depth and texture determine soil moisture regime. For example, a soil with a ‘subhydric’ regime will accumulate more water than a soil with a ‘xeric’ moisture regime.
Each surficial deposit was given a value between 0 and 10 for each of these three parameters (0: very low potential of movement; 10: very high potential of movement). The total index of “potential of permafrost related surface movement” is the sum of the three partial indices related to soil depth, texture and moisture regime (Table 2).
Table 2. Potential of permafrost-related surface movement based on surficial material thickness, texture and moisture regime
Surficial material
4. RESULTS
4.1 Differential interferograms
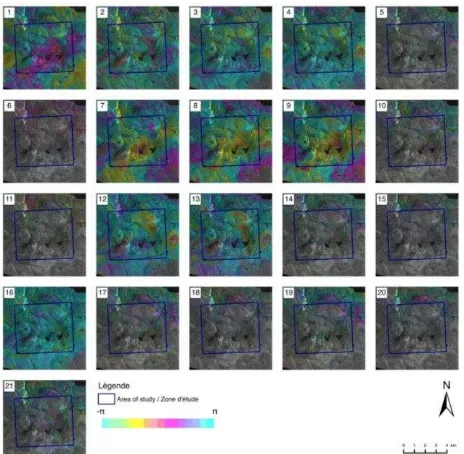
Differential interferograms of TerraSAR-X images show that pairs using images acquired in mid-September are of low coherence because of snow cover (interferograms 5, 6, 10, 11, 14, 15, 17, 18, 19, 20 and 21 in Figure 2). TerraSAR-X interferograms 1, 7, 8 and 9 are affected by the atmospheric effects of the 2014-08-01 image that were impossible to correct.
RADARSAT-2 U4(A) pairs are not coherent when they include the 2014-06-02 image (important snow cover) (interferograms 1, 2, 3 and 4 in Figure 3). The interferograms (no 7, 9 and 10) that included the 2014-09-06 image were rejected because surface heave had already started at this date.
Figure 2. TerraSAR-X interferograms (refer to Table 1)
Figure 3. RADARSAT-2 U4(A) interferograms
Figure 4. RADARSAT-2 U5(D) interferograms
RADARSAT-2 U5(D) pairs using the 2014-05-30 image (with important snow cover) are not coherent (interferograms 1, 2, 3 and 4 in Figure 4). As previously, the interferograms using the 2014-09-03 image (no 7, 9 and 10) were rejected because surface heave had already started at this date.
4.2 Surface vertical displacements measured using DInSAR
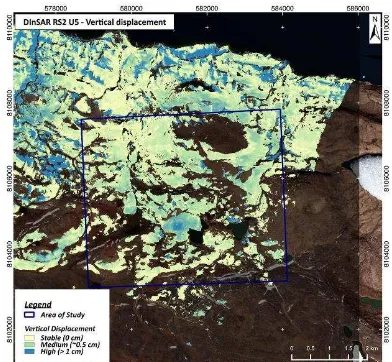
Interferometric pairs suitable for DInSAR processing (snow free, low atmospheric effects and period of subsidence) were used for calculating surface displacement between two acquisition dates separated by variable temporal baselines (see Table 1). Examples shown of figures 5, 6 and 7 correspond to longer temporal baselines (33 days for TerraSAR- X and 48 days for RADARSAT-2). Surface vertical displacements show important spatial variability, with a maximum of 2 cm for the June-August period. Spatial patterns of these displacements are similar for TerraSAR-X, RADARSAT-2 U4(A) and RADARSAT-2 U5(D).
Significant displacements are negative, which indicates surface subsidence owing to permafrost thawing in the study period. Iinfrastructures (residential and industrial buildings, reservoirs and water basin) are found to be stable (insignificant displacement) most likely because they are located on stable ground with low erosion risks (flat rocky terrain without near-by hydrographic features). In addition, these displacements are in accordance with surface properties, as described in the following section.
4.3 Relationship with surficial materials
Generally, surface stability is defined by a complex interaction between surficial geology, soil texture, topography, hydrology, and other natural or anthropogenic features. The spatial distribution of surface deformation obtained in this study was assessed against the surface materials map extracted from the GeoEye-1 stereoscopic pair (Figure 8). This map allowed generating a quantitative index called “potential of permafrost related surface movement” whose values can range from 0 to 30. This index was classified as follows: 0 to 10 for stable surfaces; 10 to 20 for surfaces with a medium potential of movement; 20 to 30 for surfaces with a high potential of movement (Figure 9).
Figure 5. DInSAR vertical surface displacements obtained with 21 July – 23 August TerraSAR-X pair
Figure 6. DInSAR vertical surface displacements obtained with 26 June – 13 August RADARSAT-2 U4(A) pair
Figure 7. DInSAR vertical surface displacements obtained with 23 June – 10 August RADARSAT-2 U5(D) pair
Figure 8. Map of surficial materials produced from a GeoEye-1 stereoscopic pair
Figure 9. Potential of permafrost related surface movement according to surficial materials
5. DISCUSSION
The DInSAR technique used with TerraSAR-X and RADARSAT-2 data allowed producting displacement maps with centimetre accuracy. The results are in accordance with scientific knowledge reported by several studies in the same type of environment that state that: (i) areas of significant deformation correspond to thicker permafrost active layers (thicker surficial deposition) prone to thaw instability; (ii) bedrock and thin surficial deposits are not affected by surface movements; (iii) affected surfaces are continuously subsiding during the permafrost thawing season; and (iv) the maximum extent of surface subsidence is about 3 cm during the summer season. This technology will enable the mining sector to benefit from the use of reliable EO-based information to ensure the safety and efficiency of several activities starting from the exploration and planning stages to the exploitation and site closure operations. This will contribute to improved risk management during all phases of a mine’s life cycle.
This type of information can improve the overall planning and management of mining processes and infrastructure deployment, thus significantly reducing the cost of any corrections to be undertaken as a consequence of changes in permafrost.
6. CONCLUSION
This paper contributes to demonstrate that SAR interferometry has great potential for operational applications related to risks induced by surface deformation in a mining environment affected by permafrost thawing. The advantages of such an EO-based solution include the wide coverage of satellite images and spatially continuous measurements (as opposed to ground truth measurements). The encouraging results of this study call for the continued development of SAR interferometry analysis using a wider range of data types, in particular multipolarized RADARSAT-2 images acquired with different geometries (ascending/descending, variable angles and resolutions). The combination of polarimetric and interferometric techniques to enhance the quality of information extracted from quad-pol RADARSAT-2 SLC data holds promise. PSinSAR is also a technology that deserves further investigation for more accurate infrastructure monitoring. Other SAR missions (RADARSAT Constellation Mission, the TerraSAR-X/PAZ constellation, ALOS-PALSAR 3 and Sentinel) are planned to be operational in the near future. This will improve the availability and likely reduce the cost of such data as well as enhance the potential of EO solutions for operational monitoring of mining operations. Moreover, this increased accessibility to high-resolution radar technology will eventually lead to near real-time reaction, contributing to improved emergency response and reduced risks. And given the increase of mining and industrial activities in northern regions, this technology is more than suitable for a better monitoring of environmental conditions over such remote areas.
ACKNOWLEDGEMENTS
Authors would like to acknowledge the Canadian Space Agency for supporting the project presented in this paper.
REFERENCES
Alasset, P.-J., J. Chamberland, J. English, D. Power and N. Volkov, 2010. Monitoring and Assessing Geohazards in Permafrost Terrain using Spaceborne Synthetic Aperture Radar (SAR), GEO 2010, Calgary, Alberta, pp. 1329-1337.
Brown, J. and H.J. Walker, 2007. Report from the international permafrost association: a brief history of the international permafrost conferences. Permafrost and Periglacial Processes, 18(4), pp. 385-392.
Chen, F., H. Lin, Z. Li, Q. Chen and J. Zhou, 2012. Interaction between permafrost and infrastructure along the Qinghai–Tibet Railway detected via jointly analysis of C- and L-band small baseline SAR interferometry. Remote Sensing of Environment, 123, pp. 532-540.
Couture, R., S. Smith, S.D. Robinson, M.M. Burgess and S. Solomon, 2003. On the hazards to infrastructure in the Canadian north associated with thawing of permafrost. In Proceedings of Geohazards 2003, 3rd Canadian Conference on Geotechnique and Natural Hazards, pp. 97-104.
Dyke, A.S. and J.M.G. Hooper, 2001. Deglaciation of northwest Baffin Island, Nunavut. Geological Survey of Canada, Map 199A, 1 : 500 000.
Dyke, A.S., 2004. An outline of North American deglaciation with emphasis on central and northern Canada. In: Ehlers, J. and Gibbard P.L. (eds) Quaternary glaciations extent and chronology, Part II: North America. Elsevier. Pp. 371-406.
Fulton, R.J., 1995. Surficial Materials of Canada. Geological Survey of Canada. Map 1880A.
Larsen, Y., T.R. Lauknes and H.H. Christiansen, 2011. Seasonal Periglacial Activity in Permafrost Landscapes Measured with High-Resolution InSAR Time Series. 4th TerraSAR-X Science Team Meeting, DLR – Oberpfaffenhofen, February 16, 2011.
Smith, S.L., M.M. Burgess, D. Riseborough and F.M. Nixon, 2005. Recent trends from Canadian permafrost thermal monitoring network sites. Permafrost and Periglacial Processes, 16(1), pp. 19-30.
Short, N., B. Brisco, N. Couture, W. Pollard, K. Murnaghan and P. Budkewitsch, 2011. A comparison of TerraSAR-X, RADARSAT-2 and ALOS-PALSAR interferometry for monitoring permafrost environments, case study from Herschel Island, Canada. Remote Sensing of Environment, 115(12), pp. 3491-3506.
Short, N., A.-M. LeBlanc, W. Sladen, G. Oldenborger, V. Mathon-Dufour and B. Brisco, 2014. RADARSAT-2 D-InSAR for ground displacement in permafrost terrain, validation from Iqaluit Airport, Baffin Island, Canada. Remote Sensing of Environment 141, pp. 40-51.