WORKFLOW FOR BUILDING A HYPERSPECTRAL UAV: CHALLENGES AND
OPPORTUNITIES
C. Proctor a, Y. He a*
a Department of Geography, University of Toronto Mississauga, 3359 Mississauga Road, Mississauga, Ontario, L5L 1C6, Canada – [email protected]
KEY WORDS: Hyperspectral Imager, UAV System, Workflow, Considerations, Challenges
ABSTRACT:
Owing to the limited payload capacities of most UAV platforms within an academic research budget, many UAV systems utilize commercial RGB cameras or modified sensors with some capacity for sensing in the NIR. However, many applications require higher spectral fidelity that only hyperspectral sensors can offer. For instance, the Photochemical Reflectance Index relies upon the narrow band absorbance of xanthophyll pigments at 531 and 570nm to quantify photosynthetic light use efficiency which are important indicators of productivity and stress in agricultural and forest ecosystems. Thus, our research group has been working on building a research paradigm around a commercial off-the-shelf hyperspectral sensor and UAV. This paper discusses some of the key decisions made regarding selection of equipment and navigating the regulatory and logistical landmines. The imagery collected to date and the options available to process and utilize hyperspectral data are discussed at the end.
1. INTRODUCTION
Utilizing pre-built systems or kits is the most common choice for UAV remote sensing since technological barriers to entry have been largely resolved and many systems are backed by positive user experience. Developing custom systems does not have these benefits. Custom systems require greater technical expertise at the engineering level and a strong familiarity with the fundamentals of avionics. Although commercial off the shelf technologies have largely eroded the need for improvisation of custom circuit boards, considerable foresight and organization is required to select and integrate electronic components and software.
The above-mentioned obligations are heightened for hyperspectral remote sensing as the bulk and weight of the sensor and its on-board high speed data acquisition and storage, requires greater integration of the sensor system into the autopilot and power supply system. Complete kits of the UAV and sensor are currently not commercially available, requiring at the minimum dealing with three parties: the sensor manufacturer, the UAV manufacturer, and a third party engineering company providing integration services. Since no party likely has a history of working with the others, there is considerable due diligence to ensure compatibility between hardware and software. All things considered, those undertaking custom UAV sensing systems at the cutting edge of commercial viability must have an appreciation for long lead times and tempered expectations.
Our research group has been working on building a research paradigm around a commercial off-the-shelf hyperspectral sensor and UAV within an academic research budget since 2013. This paper discusses some of the key decisions made regarding selection of equipment and navigating logistical landmines. At the end of the paper, we showcase the imagery collected to date and discuss the options available to process and utilize hyperspectral data.
* Corresponding author
2. EQUIPMENT CONSIDERATIONS TOWARDS A HYPERSPECTRAL UAV SYSTEM
2.1 Hyperspectral Imager
Like any remote sensing instrument, the spectral response characteristics of the sensor are key to understanding and utilizing the data. Unlike commercial RGB cameras hyperspectral imagers have considerable design improvements that improve the selectivity and uniformity of the radiance collected per band. Many hyperspectral cameras are push broom systems that utilize a diffraction grating to split monochromatic light into various wavelengths. This approach mimics that of Landsat and other satellite sensors in which a beam of light is split and subsequently filtered such that each array of light sensitive photoreceptions receives radiance independent of other wavelengths. In this case, a standard CCD assembly is utilized with rows representing the spatial dimension and columns the spectral dimension. In contrast, commercial RGB cameras utilize a Bayer filter overtop of a square of photoreceptors, resulting in a Bayer pattern image in which each pixel has recorded only of the three colors and requires interpolation to obtain a full color image.
The filtration aspect of RBG cameras is key to understanding their deficiencies as a precision scientific instrument. An ideal sensor system would have a 100% spectral response to only photons of the wavelength of interest within a defined band. Physical and engineering consideration however limit all sensors. Yet sensor performance can be quantified upon a spectrum. Typically spectral response is primarily quantified by the quantum efficiency, the likelihood that an incoming photon will generate an electronic force. The spectral filtering and use of high grade photoreceptions provide Landsat 8 with clearly defined regions of sensing, near uniform quantum efficiency and minimal overlap in wavelengths jointly sensed between two bands (Figure 1). In comparison, a Canon 1DMarkIII has more of a Gaussian spectral response with noticeable dips in many wavelength ranges. There is considerable overlap between bands such that at ~570nm green and red are approximately equal in spectral
response while wavelengths of ~525nm contribute to the radiance measured within the blue, green and red band. Lastly, the magnitude of quantum efficiency can vary considerably between bands, with red wavelengths counting for nearly half of green wavelengths.
Figure 1. Quantum efficiency of a Canon 1DMarkIII Cameron with more of a Gaussian spectral response vs that of Landsat 8 in the visible and near infrared (NIR) wavelength regions (Landsat data were from http://landsat.gsfc.nasa.gov/?p=5779 and the camera data from http://www.cis.rit.edu/jwgu/research/camspec/db.php)
Camera calibrations would require a stable monochromatic light source and sensor. As such they are currently typically not performed because of the added cost. Hence, there is a paucity of data on camera spectral response. The situation is even direr for near infrared (NIR) converted cameras. Most NIR converted cameras remove the filter that overlays the entire CCD to filter out NIR light which the CCD is sensitive to. The Bayer filter is replaced with one that either converts the blue channel to be sensitive to the NIR or replaces the filter over the red band with one that allow both red and NIR light to pass (more information in https://www.maxmax.com/spectral_response.htm). As a byproduct of removing the NIR filter blue and green bands may also be sensitive to NIR wavelengths, however the contribution to the total signal is slight. Hence, many bands in converted RBG cameras are contaminated with spectra from wavelengths not in the region of interest. Furthermore, there is some indication that the quantum efficiency is lowered compared to non-converted cameras although a direct comparison has not been performed to our knowledge. It is also unclear in NIR converted cameras how the electronics, calibrated to expect radiance within the visible light spectrum, perform once exposed to NIR light. Specifically, the analog to digital converter in most cameras is supposedly adjusted to convert radiance under a range real world conditions to the bit depth of the camera. It is unclear how the analog to digital converter will respond when asked to accept a wider spectral range and potentially more radiance. The response of the camera optics and automatic camera controls maybe less intuitive and require the camera to compensate with smaller apertures, lower exposure or adjustments to the focus.
Although hyperspectral systems avoid much of the limitations in filtration technology by optically splitting monochromatic light, there are considerable subtle technical parameters that determine a systems performance characteristics. Unfortunately the lack of common industry standard for measuring and documenting
instrument performance make it challenging to discriminate properly between different instruments. HySpex has produced an excellent buyer’s guide for anyone considering investing in a hyperspectral imaging system (http://www.hyspex.no/guide/). The main performance characteristics relate to the resolution of the system in the spatial and spectral dimensions. Ideally each pixel of the imager would receive only light from the point of ground being sensed for only the wavelengths within the band. Realistically a percentage of light leaks into the neighboring pixels the image may appear fuzzy spatially and spectrally there is bleed over from nearby wavelengths that contribute to the spectral response. Additionally the light from the slit in the sensor maybe unequally aligned against the imaging array due to distortions caused by the quality of optics or the dispersive element. Smile and keystone effects are commonly within most sensing systems are manufacturers often claim their system offers low or the lowest value of these negative performance characteristics in the industry, without providing data. It is also common to provide the “average” value of the system performance instead of its variability per wavelength which is arguable the more useful quantity especially if the interests target certain wavelength regions.
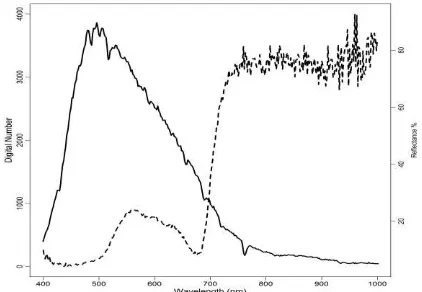
Another key parameter of system performance is the quantum efficiency and signal to noise ratio per wavelength, especially for those interested in the poles of the systems spectral range. Many hyperspectral sensors are based off commercial CCD or CMOS imaging arrays. Performance characteristics of these arrays differ considerably to the degree that is difficult to assign any general rules aside from their technological differences. While CCD’s may have higher sensitivity a high grade CMOS may have greater quantum efficiency in the NIR, and visa-versa. Regardless of performance, quantum efficiency decreases sharply in the NIR. The lower solar output and decreases sensitivity of the imager would result in a lower signal beyond 850 nm and greater noise (Figure 2). Regardless, initial tests with the imager have demonstrated its ability to capture the spectra for a wide range of vegetation (Figure 2). The imager clearly captures the green peak of vegetation, the red edge inflection point and is robust enough to determine the magnitude of the NIR plateau for vegetation. Further into the NIR its ability to quantify soil or water absorption at 970nm may be limited.
Figure 1. Plot of sensor digital number (solid line) and processed reflectance (dash line) showing the characteristic spectra of green vegetation.
Regardless of diminishing performance at longer NIR wavelengths, the greater spectral resolution permits a number of key quantities that require higher spectral fidelity that only hyperspectral sensors can offer. For instance, the Photochemical Reflectance Index (PRI) relies upon the narrow band absorbance 0
of xanthophyll pigments at 531 and 570nm to quantify photosynthetic light use efficiency which are important indicators of productivity and vegetation stress in agricultural and forest ecosystems (Gamon et al., 1992). Plant stress can also be quantified using the “Brown Pigments Index” developed by Peñuelas et al. (2004) who developed this index exploiting the position of the red edge and the wavelength with the minimum reflectance slope in the NIR to correlate the concentration of oxidized compounds due to plant stress. Water concentrations either in leaves or near surface soil can also be quantified by exploiting one of small absorption features of water at 970nm (Peñuelas et al. 1993). Lastly, the measurement of the entire spectra at narrow bands open a wide range of techniques such as spectral unmixing (Bioucas-Dias et al., 2012), continuum removal (Kokaly et al., 2003) and radiative transfer modelling (Verhoef, 1998). In many cases the added spectral information was found to be superior to multispectral vegetation indices for quantifying biophysical and biochemical parameters of vegetation (Huang et al., 2004).
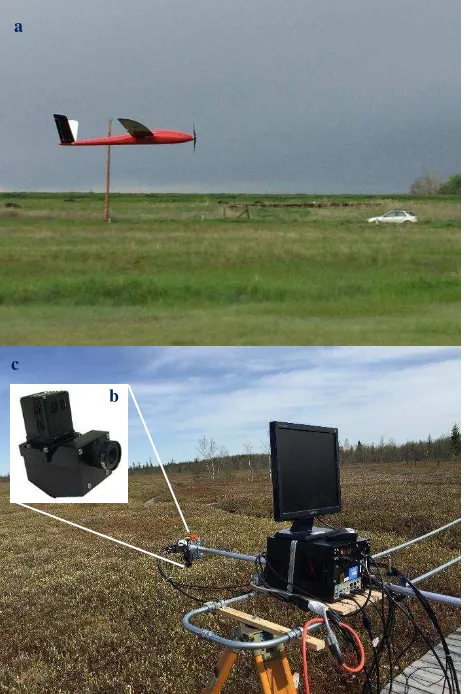
Costs for hyperspectral imaging systems suitable for UAVs may drop in the near future as new companies of offering their products in an attempt to hop on the booming UAV market. While competition is great for lowering costs, the current reality is that hyperspectral imagers are expensive and the capital required, coupled with the technical risk and potential for catastrophic system loss, means that these systems are out-priced for many research budgets. Taking all the facts into consideration and within limited budget, we purchased a Micro-Hyperspec® VNIR A-series concentric imaging sensor with spectral range from 400 to 1000 nm and 1004 spatial bands x 324 spectral bands. The imaging system include the imaging sensor and a data acquisition and processing computer which is not designed for UAVs, but more for ground measurements (Figure 3b&c). The imaging system thus needs to be modified so that it can be mounted on the UAV to collect data onboard without needing the ground data acquisition computer. The modification involves adding onboard data acquisition electronics and onboard power supply for the imager. Futher, the modified package needs to be considerably small, light, and with lower-power requirement to accommodate the limited payload capacities of the selected UAV. This modification work was done through a collaboration with Xiphos Systems Corporation. Those who wish to undertake such an initiate must have a clear understanding of the costs versus the capabilities of hyperspectral UAV systems.
2.2 UAV for Hyperspectral Imager
The main considerations on the UAV side relate to the choice of UAV median. The two main classes of UAV’s are fixed wing and rotor craft such as an octocopter and helicopter. Fixed wing aircraft are potentially more stable and feature longer endurance as their form is more aerodynamic and the wings provide much of the lift, conserving much of the limited battery lift. In contrast, many octocopter systems capable of heavy lifting are bulky and subject to larger wind shear resulting in greater pitch, roll and yaw. For a push room sensor stability is paramount as it is challenging to correct images, especially for pitch. Thus, many octocopter systems may elect to stability the camera using a gimbal. The added weight from the gimbal, coupled with the batteries proving the majority of the lift results in lower endurance. The main benefits of an octocopter are the simplicity of design. Space in fixed wing aircraft is at a premium and the bunched nature of the electronics gives rise to radio frequency interference. In addition, balancing the electronics such that the center of mass between the wings is an art form. Input and output ports must also be position in easily accessible locations in order
to remove the data and to adjust the sensors data acquisition parameters to the local conditions. Octocopters have space to spare and with a proper gimbal the camera stability maybe superior to a fixed wing craft whose sensor is tied to the craft’s body and have no room for camera stabilizers.
Protection of investment is also a key consideration. Octocopters typically feature roll cages that serve as the landing legs and protection for the camera. Landings are smoother as the operator can simply roll back the throttle. In contrast, fixed wing aircraft usually utilize a belly landing. Belly landings can be dangerous for the imager even though it is recessed inside the main body. Two potential options to protect the sensor are a clear protective plastic sheet overtop of the port or a shutter. Port shields would block dirt and absorb the brunt of the landing, but are likely to scratch and need replacing. Furthermore, shields are not 100% transparent and they tend to absorb 10% of the incoming light and perhaps more in certain wavelength regions. The shutter alternative can provide more of a shielding and be made of a stronger material, yet there is a risk it will be torn of during landing. Our preferred method of landing is thus via parachute with a backup shutter. The parachute softens the landing while the shutter shields the camera when the aircraft body hits. Our final customized UAV is provided by Xiphos Systems Corporation and displayed in Figure 3a.
Figure 3. The fixed wing craft (a) we chose to carry the headwall hyperspectral VNIR imager (b). The full headwall imager system including the imager and image processing unit which can be amounted in a ground imaging track for canopy level measurements (c).
a
c
b
3. WORKFLOW FOR DATA COLLECTION AND CALIBRATION
3.1 Data collection
The workflow for data collection is as follows. The hardware is setup and confirmed in working order. Both the imager and inertial measurement unit (IMU) must be calibrated. In the case of the IMU the axis must be positioned properly and adjusted to the local magnetic fields. The IMU magnetometer is utilized to orient the craft’s heading which can differ substantially from the crafts orientation due to wind (i.e. the craft’s nose maybe pointing north but the whole craft is moving north east). Hence the IMU must be calibrated against the Earth’s local magnetic field as iron ore or simply the locations position on the Earth can affect its orientation against flat terrain. Imager calibration relies upon setting the optics. Unlike RGB camera, this imaging sensor used a fixed focus lens. Essentially the imager is focused to infinity rather than a particular object on the ground. This design guards against the imager attempting to autofocus in flight, which commonly occurs as the distance between the imager and the ground is constantly changing with variations in flight height and terrain. The only optical control permitted is the aperture. The aperture is adjusted to reduce or increase the incoming light as per typical conditions experienced at flight height. As this setting is manual, proper estimation of the solar irradiance reflected off the ground is crucial. Typically the sensor is positioned towards the sky and the aperture adjusted to 85% of the bit depth to account for variations in solar output and BRDF which will change if the sensor becomes oriented towards the sun.
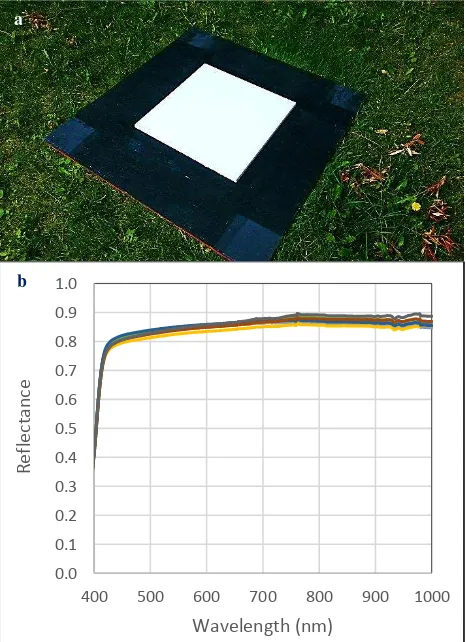
Figure 4. (a) The white reference that used BaSO4 paint and its reflectance curve in visible and NIR regions (b) measured by a ASD FieldSpec spectroradiometer.
Calibration of the camera under the aperture utilized in the field is necessary as it’s often unclear how the aperture affects the amount of incoming light. Theoretically it’s possible to apply a correction factor to the sensor gain and offset when converting digital number to radiance. Currently the simplest means to convert the sensor DN to reflectance is via relative reflectance. By placing a large spectrally white object in the field at the time of flight the radiance can be converted to reflectance via the white reference. It is therefore critical that the white reference be spectrally flat with high lamber behavior and reflectance. At the flight height (which varies) each pixel on the ground is approximately 10cm square. Hence, any white reference must be at least four pixel wide, preferably closer to 1m square. White paints can be used in a pinch (A Mixture of Barium Sulfate and White Paint is a Low-Cost Substitute Reflectance Standard for Spectralon), but at sinesterd PTFE plate is preferred. The cost of such a large the white reference is high but the cheaper option that we decided to go with is using BaSO4 paint to paint on a 50cm × 50cm wood board (Figure 4a). Although this white reference may lack long term durability, its reflectance in the visible and NIR regions is stable and over 80% (Figure 4b). The limitation of this method is that solar output is assumed constant and variations in the orientation of the plane are not corrected for. Future improvements may be adopting a small non imaging hyperspectral sensor oriented sky facing to record the solar output in lockstep with each scan line acquisition.
3.2 Hyperspectral Data Preprocessing
The collected hyperspectral data need to be corrected geometrically. This can be done by using Ortho Rectification function in the software HyperSpec Cube provided by Headwall Phtonics. The software reads the parameters from the imagery metadata (GPS/IMU file etc) and also requires a DEM file. Figure 5 shows some before and after corrected images for a grassland plot and wetland plot.
Figure 5. (a) An image collected by the sensor before processing from a tall grassland; (b) the georeferenced image converted to reflectance for the grassland image, and (c) a fully post processed image for a wetland plot.
0.0 0.1 0.2 0.3 0.4 0.5 0.6 0.7 0.8 0.9 1.0
400 500 600 700 800 900 1000
Refl
ectanc
e
Wavelength (nm)
a
b
a
b
c
4. CONCLUTION
In this paper, we described a two-year long effort for building a customized hyperspectral UAV system within limited research budget. Specific attention was paid on the key steps including the selection of imaging sensor (multispectral vs hyperspectral) and our spatial and spectral quality decisions (coverage, camera protection versus NIR signal loss), the selection of UAV body form (fixed wing vs octocopter), and the workflow of data collection and pre-processing. What we did not discuss but also critically important in terms of building a hyperspectral UAV system are making the decision on doing it yourself versus hiring (we did a hybrid partnership), training staff according to the requirements, the SFOC process, specific UAV data acquisition workflow (e.g. setup and mission planning), and radiometric correction (relative reflectance vs atmospheric correction). We showed the only images we collected using the imager to date and briefly discussed the options available to process and utilize hyperspectral data at the end. Although it is a high risk and complicated project and we have hit numerous snags along the way, the future is bright.
ACKNOWLEDGEMENTS
This research was supported by CFI/ORF #26492 and NSERC Discovery Grant RGPIN-386183 to Dr Yuhong He. We appreciate our collaborator Eric Edwards from Xiphos Systems Corporation and thank Headwall Phtonics for providing us continuous technical support. We are also grateful for our PhD student Bing Lu working on hyperspectral image correction and our field assistant Yunpei Lu for making the white references and measuring the spectral curves of the white references.
REFERENCES
Bioucas-Dias, J.M., Chanussot, J., Gader, P., Du, Q., Parente, M.,
Dobigeon, N., Plaza, A., 2012. Hyperspectral unmixing
overview: Geometrical, statistical, and sparse regression-based approaches. Selected Topics in Applied Earth Observations and Remote Sensing, IEEE Journal of, 5(2): 354-379.
Gamon J.A., Field, C.B., Peñuelas, J., 1992. A narrow-waveband spectral index that tracks diurnal changes in photosynthetic efficiency. Remote Sensing Environ., 41: 35-44.
Huang, Z., Turner, B.J., Dury, S.J., Wallis, I.R., Foley, W.J., 2004. Estimating foliage nitrogen concentration from HYMAP data using continuum removal analysis. Remote Sens. Environ., 93 (1–2): 18-29.
Kokaly, R.F., Despain, D.G., Clark, R.N., Livo. K.E., 2003. Mapping vegetation in Yellowstone National Park using spectral feature analysis of AVIRIS data. Remote Sensing Environ., 84: 437-456.
Verhoef, W., 1998. Theory of radiative transfer models applied in optical remote sensing of vegetation canopies, Grafish Service Centrum Van Gils, Wageningen.