IMPACT OF EL NIÑO AND LA NIÑA ON SOIL MOISTURE- PRECIPITATION
FEEDBACK OF INDIAN MONSOON OVER
CENTRAL INDIA
Abhishek Lodh*, Somnath Jha, Ramesh Raghava
Centre for Atmospheric Sciences, Indian Institute of Technology Delhi, Hauz Khas, New Delhi-110016, INDIA *Email: [email protected]
KEY WORDS: El Niño, La Niña, Soil Moisture, Evapotranspiration, BATS, CLM
ABSTRACT:
The processes across an interface between land surface and the atmosphere over central India have a strong impact on the Indian summer monsoon climate, particularly during extreme years. The soil moisture-climate interactions, i.e. impacts on temperature and precipitation for years of excess (1999,2010) and deficit (1987,2009) rainfall over central India are being analyzed. For this study, two land surface parameterization schemes the Biosphere Atmosphere Transfer scheme (BATS) and the Community Land Model (CLM) were coupled using the regional climate model RegCM4.0. Soil moisture-temperature coupling and soil moisture-precipitation feedbacks are important land surface atmosphere interactions in context of climate change scenario. As feedbacks between land and atmosphere are hard to measure directly, correlation between temperature and evapotranspiration is the diagnostic used for assessing soil moisture-evapotranspiration-temperature coupling strength and simple statistic called “normalized feedback parameter” λNC of soil moisture and precipitation is used to access the strength of soil moisture precipitation feedback at a regional scale. The soil moisture – atmosphere coupling strength in BATS scheme coupled with RegCM4.0 is more than the coupling strength in the CLM scheme enabled with RegCM4.0. From our study it is validated that central India is the region in the Indian monsoon domain where profound soil moisture-climate interactions take place at a regional scale.
1.INTRODUCTION
Recent Atmospheric general circulation (AGCM) studies coordinated by GLACE, the Global Land-Atmosphere Coupling Experiment has concluded that over inlands during summer soil moisture exerts deeper impact than oceanic component (i.e. SST) on precipitation. This is because soil moisture influences weather through its impact on evaporation and other surface energy fluxes. Hence, the atmosphere responds to the perturbations in the lower boundary conditions through a complex set of processes and feedbacks that impacts rainfall patterns and results in a regional climate change. Precipitation influences soil moisture; the resulting anomalies in soil moisture feed back to impact precipitation, which further influences soil moisture through the water, energy, and momentum exchanges between land and atmosphere. An anomaly of soil moisture last long in comparison to anomalies in atmosphere and is important for predicting extreme climate events, especially droughts and floods. A positive feedback would be characterized by an increase in precipitation resulting from high soil moisture or a continued suppression of precipitation resulting from anomalously dry soils. In the case of a negative feedback, increased precipitation would be associated with dry soils, while moist soils would act to suppress precipitation. In other words, a positive feedback acts to reinforce the initial change in the system while a negative feedback causes the system to diverge from the initial change.
2. THEORY
Soil Moisture generally refers to the amount of water stored in the unsaturated soil zone (or vadose zone) and is source of water for atmosphere through processes leading to evapotranspiration from land which include mainly plant transpiration and bare soil evaporation. Evapotranspiration returns as much as 60% of the
whole land precipitation back to the atmosphere. Soil moisture has its impact on the partitioning of the incoming energy in the latent and sensible heat fluxes, and additional impacts particular on air temperature, boundary-layer stability and precipitation. Hence, the seasonal predictability of atmospheric surface climate anomalies depends on the interannual variability of the soil moisture. Hence, soil Moisture impacts summer precipitation in the interiors of continents (Namias et al. 1952, 1960).
2.1 Soil Moisture, and land energy and water balances
Soil moisture plays an important role in the land energy and water balance budgets through its impact on evapotranspiration E (or latent heat flux LvE, where Lv is the latent heat of vaporization). The land water balance for a surface soil layer including vegetation can be expressed as:
dS
dt
=
P
−
E
−
R
s−
R
g (1)where dS/dt is the rate of change of water content (S) within the given layer. P is the precipitation, E is the evapotranspiration, Rs is the surface runoff, and Rg is the drainage or baseflow in case of groundwater.
The land energy balance for the same surface soil layer can be expressed as:
dH
dt
=
R
n−
Q
E−
Q
H−
Q
G (2)is the latent heat flux, QH is the sensible heat flux and QG is the ground heat flux to deeper layers. From equations (1) and (2) we can see that land energy and water balances are coupled through evapotranspiration term (E, QE). Thus, soil moisture plays a key role both for the water and energy cycles through its impact on the energy partitioning at the surface. These effects are important in regions where soil moisture is the main controlling factor for evapotranspiration.
Hence, in our study, we primarily focus on central India, one of the hotspot for soil moisture-precipitation coupling regions identified by the GLACE team. For our study central Indian region is lying between 73°E - 83.5° E and 18°N - 27.5 °N comprising of semi-arid, arid and humid sub-tropical biotic zones. Surface height map of central India region is shown in Figure 2. It includes Madhya Pradesh, Chattisgarh, and parts of Rajasthan, Maharashtra, Andhra Pradesh, Gujarat, Orissa, Uttar Pradesh. The significance of this region is also reported by Goswami et al. (2006) that substantial increase in heavy rain events is expected over central India. India with 2.4% of the world's area has over 8% of the world's total biodiversity, making it one of the 12-mega diversity countries in the world.
Figure 3. Schematic diagram of the land water balance (left) and land energy balance (right) for a given surface soil layer.
Figure 4. Surface elevation (metres) map of central India region.
2.2 Indirect soil moisture-precipitation feedback mechanism
Koster et al. (2006) and Guo et al. (2006) concluded that the intense hotspots of coupling appear in the transition zones between dry and wet climates. The Indian monsoon season starts with dry climate and progresses to wet climates. During June to
September (JJAS) season of Indian summer monsoon i.e. during wet climate,soil moisture is plentiful and evaporation is controlled by atmospheric demand. Whereas in dry climates i.e. before rainy season the typical variations in evaporation are too small to affect precipitation. Between these extremes, evaporation is large enough to influence precipitation, but the magnitude still depends on soil moisture. Hence, central India is an interesting case to study land-atmosphere feedbacks because of the large-scale modification of the landsurface.
The “direct” feedback between soil moisture and precipitation works such that over wet soil enhanced surface evaporation is recycled as rainfall. The outline of the “indirect” soil-moisture precipitation feedback by Eltahir et al. (1998) works such that over anomalously wet soil induces a strong evapotranspiration response through enhanced plant transpiration and soil evaporation. Consequently, more of the available surface energy is devoted to latent heat rather than sensible heat flux, and the Bowen ratio is correspondingly low, resulting in a boundary layer that is not very deep. The enhanced moisture flux into the shallow boundary layer leads to an anomalously moist and therefore less stable boundary layer. The wet soil tends to be dark and cool, leads to absorption of more solar radiation and reduced longwave radiation, resulting to greater total heat flux into the boundary layer. These factors lead to larger moist static energy (MSE = Enthalpy per unit mass of air + Potential energy + Latent heat content = CpT + Φ + Lvq) per unit mass of boundary layer air over wet soils compared to over dry soils. Here, T is temperature of air parcel, Cp is specific heat at constant pressure, Φ is geopotential, and q is the specific humidity. This leads to enhanced precipitation under conditions when deep moist convection is triggered by boundary layer instability.
2.3 Soil – moisture precipitation feedback
Following N08 (Notaro et al. 2008) the feedback or the linear influence of a slowly varying quantity s (say soil moisture or SST) at time t on a faster atmospheric variable a (precipitation or temperature) at time t+dt can be expressed as follows:
a
(
t
+
dt
)
=
λ
s
(
t
)
+
ε
(
t
+
dt
)
(3)where λ is called the feedback parameter and ε(t+dt) represents atmospheric noise. The feedback parameter λ is given as
λ
=
cov[
s
(
t
−
τ
),
a
(
t
)]
cov[
s
(
t
−
τ
),
s
(
t
)]
(4)where λ measures the instantaneous feedback of s on a at time t. Typically, we use τ = 1 month as the soil moisture memory. Therefore, λ(soil moisture, precipitation) represents the fraction of precipitation change attributed to variations in monthly soil moisture. The equation (4) can be written in terms of normalized covariance (or correlation), λNC as
λ
NC=
ρ
[
s
(
t
−
τ
),
a
(
t
)]
3. MODEL DESCRIPTION AND EXPERIMENTAL DESIGN
The Regional Climate model RegCM4.0 (Pal et al. 2007) is used in the present study. The choice of the model is because RegCM3 successfully simulates Indian summer monsoon circulation features and rainfall (Dash et al. 2006, Saha et al. 2010). RegCM4.0 is a hydro-static, compressible, sigma- p vertical coordinate model run on an Arakawa B-grid in which wind and thermo dynamical variables [eg. eastward (u), northward (v) and vertical (
ω
) velocity, Temperature (T) at vertical levels, relative humidity (q), surface pressure (P), mean sea-level pressure, relative humidity (q) etc.] are horizontally staggered using a time-splitting explicit integration scheme in which the two fastest gravity modes are first separated from the model solution and then integrated with smaller time steps. The dynamical core of the RegCM is similar to that of the hydrostatic version of Mesoscale Model version 5 (MM5). The physical parameterizations employed in the simulations include the radiative transfer package of the NCAR Community Climate Model version 3 (CCM3, Kiehl et al. 1996), the boundary layer scheme by Holtslag et al. (1990) and the cumulus cloud scheme of Grell (1993) with Fritsch and Chappell (1980) closure, Subex moisture flux scheme by Pal et al. (2000) and Ocean Flux scheme by Zeng et al. (1998). The chosen confurigation results in the most realistic representation of summer monsoon hydroclimate. RegCM4.0 was run at 50-km horizontal resolution with Normal Mercator map projection with 18 vertical levels in the atmosphere (sigma coordinate) and model domain is from 40°E-130°E, 15°S-40°N to include all the significant geographical features of the South-Asian Monsoon region. The lateral and lower boundary conditions for ground temperature (Tg), surface pressure (ps), sea surface temperature (SST) (except for soil moisture) were provided by the National Centers for Environmental Prediction, NCEP-DOE AMIP-II Reanalysis (R-2) (Kanamitsu et al. 2002) 6-hourly data and Reynolds weekly sea surface temperature (SST) (Reynolds et al. 2002) respectively.In the RegCM4.0 modelling system the terrestrial variables including elevation, landuse and sea surface temperature and three-dimensional isobaric meteorological data are horizontally interpolated from a latitude-longitude mesh to a high-resolution domain. Vertical interpolation from pressure levels to the σ coordinate system of RegCM4.0 is also performed.σ surfaces near the ground closely follow the terrain, and the higher-level σ surfaces tend to approximate isobaric surfaces.
The model is integrated over South–Asian domain for the period of April to December for the years 1987, 1999, 2009 and 2010. The years of 1999 and 2010 are years of excess rainfall whereas, 1987 and 2009 are years of deficit rainfall. Moreover, the years of 1999 and 2010 are years when Ocean Niño Index is less than -0.5 i.e. negative SST anomalies over Nino 3.4 region (5°N -5°S, 120°-170° W) and years of 1987 and 2009 are years when Ocean Niño Index is greater than +0.5 i.e. positive SST anomalies over Niño 3.4 region (5°N -5°S, 120°-170° W).
For our study purpose, two land surface parameterization schemes, the Bio-sphere Atmosphere Transfer scheme (BATS) and the Community Land Model (CLM) were coupled in the model RegCM4.0. The Bio-sphere Atmosphere Transfer scheme (BATS; Dickinson et al. 1993) is a state of the art land-surface
model designed to describe the role of vegetation and interactive soil moisture in modifying the surface-atmosphere exchanges of momentum, energy and water vapor. The soil hydrology calculations include predictive equations for the water content of the soil layers. These equations account for precipitation, snowmelt, canopy foiliage drip, evapo-transpiration, surface runoff, infiltration below the root zone, and diffusive exchange of water between soil layers. The model has a vegetation layer, a snow layer, a surface soil layer, 10 cm thick, or root zone layer, 1-2 m thick, and a third deep soil layer 3 m thick. The temperature of the canopy and canopy foilage is calculated diagnostically via an energy balance formulation including sensible, radiative, and latent heat fluxes. Sensible heat, water vapor, and momentum fluxes at the surface are calculated using a standard surface drag coefficient formulation based on surface-layer similarity theory. The drag coefficient depends on the surface roughness length and on the atmospheric stability in the surface layer. The surface evaporation rates depend on the availability of soil water. BATS has 20 vegetation types, soil textures ranging from coarse (sand), to intermediate (loam), to fine (clay) and different soil colors for the soil albedo calculations. Also, mosaic-type approach is used for subgrid variability of topography and landcover. Different land use types for urban and sub-urban environments are implemented in latest version of BATS for RegCM4.0. Urban development modifies surface albedo and alters surface energy balance.
The Community Land model (CLM; Oleson et al. 2008) is the land surface model developed by NCAR as a part of Community Climate System model. CLM contains five possible snow layers with additional representations of trace snow and fifteen unevenly spaced soil layers with explicitly solutions of temperature, liquid water and ice water in each layer. The soil column is discretized into fifteen layers where the depth of soil layer or node depth is exponentially related to soil number. The thickness of the layers is so distributed that more soil layers are near the soil surface where the soil water gradient is generally strong. Each CLM grid cell contains up to four different land cover types (glacier, wetland, lake, and vegetated), where the vegetated fraction can be further divided into 17 different plant functional types. The CLM module includes a detailed soil model, the distinction between soil ice and water phases, a linked photosynthesis-stomatal conductance model, a multilayer snow model, and an improved runoff parameterization. Soil moisture initialization in CLM is based on a climatological soil moisture average (Giorgi and Bates, 1989) over the use of constant soil moisture content throughout the grid generally used for CLM. Photosynthesis rates are calculated in CLM by calculating stomatal conductance for sunlight and shaded fractions.
4. RESULTS AND DISCUSSION
Impacts of soil moisture on climate system are induced by its role for evapotranspiration. A number of processes are important for the relationship between soil moisture and evapotranspiration. Since direct comparisons between modelled soil moisture for a numerical model grid cell (say 50 km x 50 km) and point soil moisture observations are ambiguous so spatial averaging is used in our study to extract a more robust signal. For our study we spatially average statistical parameters (i.e. correlation) of land atmosphere coupling variables over central India.
4.1 Soil moisture-evapotranspiration-temperature coupling
The correlation between temperature (Tg) and evapotranspiration (E), ρ (E, T) has been used as diagnostic for soil moisture-temperature coupling. Figure 3 and Figure 4 displays strength of soil moisture – temperature coupling in summer monsoon period of JJAS based on modelling datasets obtained from climate model RegCM4.0 coupled BATS and CLM run. Regions of negative correlation (red coloured) are regions of soil moisture-limited evapotranspiration and hence, strong soil moisture-temperature coupling whereas regions of positive correlation (green coloured) are energy-limited evapotranspiration regions and hence low soil moisture-temperature coupling. Hence, we conclude that over regions of negative correlation land impacts atmosphere and vice-versa over regions of positive correlation.
Correlation
(E, T) 1987 1999 2009 2010
BATS 0.174498 0.037842 -0.10537 -0.20084 CLM -0.07195 0.315572 0.143259 -0.15882
Table 1. Correlation (averaged over central India) between evapotranspiration (mm/day) and temperature (K) ρ (E, T) for El Niño (1987,2009), La Niña (1999,2010) years using BATS and CLM scheme.
Spatially averaged correlation between temperature and evapotranspiration over central India confirms that soil moisture – temperature-coupling strength is more during recent years of 2009 and 2010 than previous years of 1987 and 1999 (See Table 1.). The monthly variation of the drivers of evapotranspiration: sensible heat flux, latent heat flux, and net radiation averaged over the central India is shown in Figure 5. The net radiation reaching the ground surface decreases during the start of monsoon season i.e. during July (because of increase in cloud cover), consequently sensible heat flux also shows the same trend, as sensible heat is directly proportional to temperature, which is affected by net radiation. Simultaneously, the peak in latent heat flux shows increase at the start of the monsoon month.
The correlation of evapotranspiration with radiation ρ(E,Rn) roughly agrees with estimates of evapotranspiration regimes. (See Figure 6 and Figure 7). Both the BATS and CLM scheme agrees that over Central India less or negative correlation between temperature and evapotranspiration ρ (E, T) and net radiation and evapotranspiration ȡ (E,Rn) exists. This shows the importance of
central India region in terms of soil moisture – evapotranspiration coupling and a hotspot for soil moisture climate interactions as estimated by the GLACE team.
4.2 Soil moisture - precipitation feedback
The model average precipitation over central India during JJAS season is 8.71 mm/day and 7.26 mm/day respectively during La Nina years (1999,2010) and 4.39 mm/day and 7.19 mm/day during El Nino (1987,2009) years. Consequently, the accumulated soil moisture during JJAS season is more during La Nina year than during El Nino year. The statistical analysis reveals that the co-efficient of determination (R2) between soil moisture and precipitation is greater using BATS scheme whereas the same using CLM scheme shows a crude relationship. The correlation between precipitation and soil moisture is more during the year 2010 (excess monsoon year) than during the year 2009 (deficit monsoon year) over the central India region. The negative soil moisture anomalies created before the start of 2010 rainy season have also resulted in creating positive precipitation anomalies during JJAS 2010.
Table 2. Correlation (averaged over central India) and R2 between soil moisture and precipitation using BATS and CLM scheme for El Niño (1987,2009), La Niña (1999,2010) years.
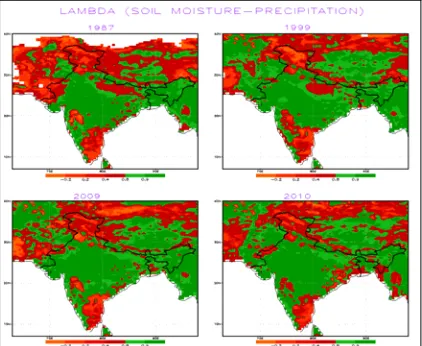
The soil moisture precipitation feedback parameter λNC(SM, P) is used to access the contribution of soil moisture-precipitation coupling. The RegCM4.0 enabled BATS scheme shows higher values of soil moisture-precipitation feedback in comparison to RegCM4.0 enabled CLM scheme. (See Figure 8. and Figure 9.)
5. ACRONYMS AND SYMBOLS
E Evapotranspiration
Lv Latent heat of vaporization
T Ground temperature
Rn Net radiation
ρ (E, T) Correlation between evapotranspiration and temperature (coupling diagnostic)
ρ(E, Rn) Correlation between evapotranspiration and global radiation
λNC Normalized feedback parameter λ Feedback parameter
λNC(SM, P) Normalized Soil moisture precipitation feedback parameter
AMIP Atmospheric model Intercomparison Project BATS Bio-sphere Atmosphere Transfer scheme
GLACE Global Land-Atmosphere Coupling Experiment
GPCC Global Precipitation Climatology Centre GLCC Global Land Cover Characterization IMD India Meteorological Department
NCEP National Center for Environmental Prediction NCAR National Center for Atmospheric Research RegCM Regional Climate model
REFERENCES
Dash, S. K., M. S. Shekhar, and G.P.Singh, 2004, Simulation of Indian summer monsoon Circulation and rainfall using RegCM3, Journal of Theoretical and Applied Climatology 86:161-172
Dickinson, R. E., A. Henderson-Sellers, and P. J. Kennedy, Bios-phere-atmosphere transfer scheme (bats) version 1e as coupled to the NCAR community climate model, Tech. rep., National Center for Atmospheric Research, 1993.
Eltahir, E. A. B. (1998), A soil moisture-rainfall feedback me-chanism: 1.Theory and observations, Water Resources Res., 34, 765– 776.
Fritsch, J. M., and C. F. Chappell, Numerical prediction of con-vectively driven mesoscale pressure systems. Part i: Convective parameterization, J. Atmos. Sci., 37, 1722–1733, 1980.
Giorgi F, Bates GT (1989) On the climatological skill of a region-al model over complex terrain. Mon Weather Rev 117: 2325– 2347
Goswami B. N., Venugopal V., Sengupta D., Madhusoodanan M. S, Xavier Prince K., 2006 Increasing Trend of Extreme Rain Events Over India in a Warming Environment, Current Science. Grell, G., Prognostic evaluation of assumptions used by cumulus parameterizations, Mon.Wea. Rev., 121, 764–787, 1993.
Guo, Z. -C., and Coauthors, 2006: GLACE: The Global Land– Atmosphere Coupling Experiment. Part II: Analysis. J. Hydro-meteor. , 7, 611–625.
Holtslag, A. A. M., E. I. F. de Bruijn, and H. -L. Pan, A high-resolution air mass transformation model for short-range weather forecasting, Mon. Weather. Rev., 118, 1561–1575, 1990
Kanamitsu, W. Ebisuzaki, J. Woollen, S-K Yang, J.J. Hnilo, M. Fiorino, and G. L. Potter. NCEP-DEO AMIP-II Reanalysis (R-2) 21631-1643, Nov 2002, Bulletin of the Atmos. Met. Soc.
Kiehl, J. T., J. J. Hack, G. B. Bonan, B. A. Boville, B. P. Breig-leb, D. Williamson, and P. Rasch, Description of
Koster, R. D., and Coauthors, 2004: Regions of strong coupling between soil moisture and precipitation. Science, 305, 1138–1140.
Koster, R. D., and Coauthors, 2006: GLACE: The Global Land– Atmosphere Coupling Experiment. Part I: Overview. J. Hydrometeor. , 7, 590–610.
Namias, J., Factors in the initiation, perturbation and termination of drought, Int. Assoc. Sci. Hydrol. Publ., 51,81-94,1960
Namias, J., The annual course of month-to-month persistence in climatic anomalies, Bull. Am. Meteorol. Soc. 71(11), 1601-1609,1990
Oleson, K. W., et al., Improvements to the Community Land Model and their impact on the hydrological cycle, Journal of Geophysical Research-Biogeosciences, 113(G1), 2008.
Pal, J. S., and E. A. B. Eltahir, 2000. On the pathways relating soil moisture conditions to future summer rainfall within a model of the land atmosphere system, Journal of Climate
Pal, J. S., E. E. Small, and E. A. B. Eltahir, Simulation of region-al-scale water and energy budgets: Representation of subgrid cloud and precipitation processes within RegCM, J. Geophysical. Res.-Atmospheres, 105(D24), 29,579–29,594, 2000.
Pal, J. S., F. Giorgi, X. Bi, et al., The ICTP RegCM3 and RegC-NET: Regional climate modeling for the developing World, Bull. Amer. Meteor. Soc., 88, 1395–1409, 2007.
Reynolds RW, Rayner NA, Smith TM, Stokes DC, Wang W (2002) An improved in situ and satellite SST analysis for climate. J Climate 15:1609–1625
Steiner A.L., Pal J.S., Giorgi F., Dickinson R.E., and Chameides W.L., 2005 The coupling of the Common Land Model (CLM0) to a regional climate model (RegCM) Journal of Theoretical and Applied Climatology
Subodh K. Saha, Subhadeep Halder, K. Krishna Kumar, B. N. Goswami (2010) Pre-onset land surface processes and ‘internal’ interannual variabilities of the Indian summer monsoon. Climate Dynamics, DOI 10.1007/s00382-010-0886-z
the NCAR community climate model (ccm3), Tech. Rep. NCAR/TN-420+STR, National Center for Atmospheric Research, 1996
Zeng, X., M. Zhao, and R. E. Dickinson, Intercomparison of bulk aerodynamic algorithms for the computation of sea surface fluxes using toga coare and tao data, J. Climate, 11, 2628–2644, 1998
ACKNOWLEDGEMENT
Figure 3. Correlation between temperature (K) and evapotranspiration (mm/day) ρ (E, T) using BATS scheme for El Niño (1987,2009), La Niña (1999,2010) years.
Figure 4. Correlation between temperature (K) and evapotranspiration (mm/day) ρ (E, T) using CLM scheme for El Niño (1987,2009), La Niña (1999,2010) years.
Figure 5. Monthly (averaged over the central India) net radiation (Rn) (W/m2), latent heat flux (QE) (W/m2) and sensible heat flux (QH) (W/m2) for El Niño (1987,2009), La Niña (1999,2010) years.
Figure 6. Correlation between evapotranspiration (mm/day) and radiation (W/m2) ȡ (E,R
n) using BATS scheme for El Niño (1987,2009), La Niña (1999,2010) years.
Figure 7. Correlation between evapotranspiration (mm/day) and radiation (W/m2) ρ(E,R
n) using BATS scheme for El Niño (1987,2009), La Niña (1999,2010) years.
Figure 9. Soil moisture precipitation feedback λNC(SM, P) using CLM scheme for El Niño (1987,2009), La Niña (1999,2010) years.