LANDSLIDE MAPPING USING IMAGERY ACQUIRED BY A FIXED-WING UAV
J. Y. Rau a J. P. Jhan a, C. F. Lob, Y. S. Linb a
Department of Geomatics, National Cheng Kung University, Tainan City 701, Taiwan – jyrau@mail.ncku.edu.tw, riddle0104@hotmail.com
b Geosat Informatics & Technology Co., Tainan City 701, Taiwan – (ceo, yi_shiang)@geosat.com.tw
Commission I, WG I/V
KEY WORDS: UAV, Mapping, Landslides Detection
ABSTRACT:
In Taiwan, the average annual rainfall is about 2,500 mm, about three times the world average. Hill slopes where are mostly under meta-stable conditions due to fragmented surface materials can easily be disturbed by heavy typhoon rainfall and/or earthquakes, resulting in landslides and debris flows. Thus, an efficient data acquisition and disaster surveying method is critical for decision making. Comparing with satellite and airplane, the unmanned aerial vehicle (UAV) is a portable and dynamic platform for data acquisition. In particularly when a small target area is required. In this study, a fixed-wing UAV that equipped with a consumer grade digital camera, i.e. Canon EOS 450D, a flight control computer, a Garmin GPS receiver and an attitude heading reference system (AHRS) are proposed. The adopted UAV has about two hours flight duration time with a flight control range of 20 km and has a payload of 3 kg, which is suitable for a medium scale mapping and surveying mission. In the paper, a test area with 21.3 km2 in size containing hundreds of landslides induced by Typhoon Morakot is used for landslides mapping. The flight height is around 1,400 meters and the ground sampling distance of the acquired imagery is about 17 cm. The aerial triangulation, ortho-image generation and mosaicking are applied to the acquired images in advance. An automatic landslides detection algorithm is proposed based on the object-based image analysis (OBIA) technique. The color ortho-image and a digital elevation model (DEM) are used. The ortho-images before and after typhoon are utilized to estimate new landslide regions. Experimental results show that the developed algorithm can achieve a producer’s accuracy up to 91%, user’s accuracy 84%, and a Kappa index of 0.87. It demonstrates the feasibility of the landslide detection algorithm and the applicability of a fixed-wing UAV for landslide mapping.
1. INTRODUCTION
1.1 Motivation
On average, there was 3 to 4 typhoons attack Taiwan Island in one year. Generally, each typhoon brings more than 800 mm cumulative rainfall. In Aug. 7-9, 2009, Typhoon Morakot struck Taiwan for three days and brought a maximum cumulative rainfall of 2,542 mm. It triggered more than ten thousand landslides in the mountainous area and cause serious flooding at the plains. According to the official report from the Department of Household Registration, Ministry of the Interior, Taiwan, this catastrophic typhoon has caused 699 death. According to the reports from many agencies, the total area of landslides induced by Typhoon Morakot is ranging from 183.1 km2 to 396 km2 in size. Among them two agencies utilized Formosat-2 satellite images and change detection technique for landslide mapping but the results are quite different; one is 259 km2 and the other 349 km2. Although, a fast landslide surveying result can be achieved using satellite imagery, the difference in area, i.e. 90 km2, is high, thus an accurate and reliable total landslide area still remains unknown. For some applications, such as landslide susceptibility, forestry and water resource management, precise landslide coverage is necessary. Meanwhile, the smallest detectable area is also important because a small landslide also has high possibility that will be broaden by another heavy rainfall.
1.2 Aims
There are many remote sensing platforms that can be used for collecting landslide imagery, such as satellite, airborne, car, unmanned aerial vehicle (UAV), human being, etc. In this research, a Digital Single Lens Reflex (DSLR) camera installed on a fixed-wing UAV is suggested for data collection. The
reason we choose UAV is it has high mobility and high image resolution comparing to satellite and airborne imagery. Although UAV has shorter duration time and smaller ground coverage, for a small target area it is sometime more cost-effective than other platforms.
1.3 Related work
In terms of landslide study, different remote sensing data are available including both terrestrial- and aerial-based photography and laser scanning, and satellite-based optical and synthetic aperture radar imagery (Delacourt et al., 2009). Although digital stereoscopic aerial photography is still often used to derive diagnostic features (e.g., disruptions in vegetation and protrusion of scarps) and qualitative characteristics (e.g., number, distribution, and type) (Metternicht et al., 2005), laser scanning technology has attracted more interest in landslide studies in recent years. These studies include (1) landslide detection and characterization, (2) hazard assessment and susceptibility mapping (Metternicht et al. 2005), (3) modelling, and (4) monitoring (Arattano and Marchi, 2008). A comprehensive review of laser scanning technology and its applications in landslides investigation can be found in (Jaboyedoff et al., 2010).
On the other hand, using image analysis for landslide study is still an important technology and wildly used in the field of earth science, because visual inspection cannot be avoided. In contrast to pixel-based image classification, the object-based image analysis (OBIA) partition land-cover parcel into image objects and classified by expert rules. The result is more reasonable comparing to pixel-based classification method which generally creates pepper-salt effect and is difficult to be identified on-site. Object-based image analysis is particularly useful for high-resolution image that contains homogeneous International Archives of the Photogrammetry, Remote Sensing and Spatial Information Sciences, Volume XXXVIII-1/C22, 2011
area. OBIA, some researchers call GEOBIA (geographic object-based image analysis) (Blaschke, 2010), is a knowledge-driven method, whereby spectral, morphometric, and contextual diagnostic features of an object can be integrated based on expert knowledge (Barlow et al., 2003). It allows the user incorporating both spectral information (tone, color) and spatial features (size, shape, texture, pattern, relation to neighbouring objects) which is similar to human visual interpretation from images (Laliberte et al., 2004).
1.4 Overview
The goal for this study is to adopt the Object-based Image Analysis technique for the detection of landslide coverage from the collected UAV DSLR images. Figure 1 illustrates the flowchart of this study. For precise mapping, a traditional aerial triangulation procedure is performed and the images were ortho-rectified before mosaicking. In order to estimate the coverage of rainfall-induced new landslides, a pre-event airborne RMK TOP 15 ortho-image is compared. In the beginning, two landslide map, i.e. pre-event and post-event, are produced independently by integrating the ortho-image with a digital elevation model (DEM) into eCognition Developer©. Then, the difference between them is considered as new landslides.
Figure 1. Flow-chart of new landslides detection
2. UAV IMAGERY
2.1 Specification of the Used UAV
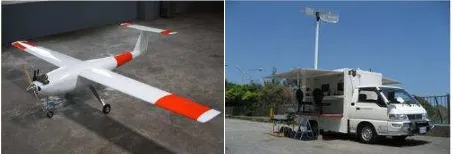
In this study, a fixed-wing UAV (as shown in Figure 2) that equipped with a consumer grade digital camera, i.e. Canon EOS 450D, a flight control computer, a Garmin GPS receiver and an attitude heading reference system (AHRS) are proposed. The adopted UAV has two hours of flight duration time and has 3 kg of payload, which is suitable for a medium scale mapping and surveying mission. For the purpose of out-of-sight flight a ground control station is designed (as shown in Figure 2) which can perform a flight control range of 20 km and real-time video signal downlink within 15 km radius.
Figure 2. The adopted UAV and ground control station.
2.2 Specification of the Acquired Imagery
The Canon EOS 450D digital camera has an image size of 4272 x 2848 and 5.2 m pixel size. The focal length of adopted lens is about 24 mm. Since the average above ground flying height is around 1,400 meters and the average terrain height is 610 meters, it results in a nominal ground sampling distance (GSD) of 17 cm. Thus, after ortho-rectification the image was resampled into 20 cm of GSD. The acquired images are stored in a memory card using JPEG image format. The total of images used in this study is 158.
3. METHODOLOGY
The detail of the developed algorithms and how to perform accuracy assessment is described in the following sections.
3.1 Landslide Detection
In contrary to conventional OBIA classification scheme that perform image segmentation and classification only once, in this study a three-stage landslide classification scheme is proposed. The concept is to search for reliable landslide seeds in advance and then growing the landslide regions based on the detected landslide seed regions. Finally, another multi-resolution segmentation that focuses on the detected landslides is performed in order to remove any vegetation within the detected landslide. Figure 3 illustrates the diagram of the developed algorithm for landslide detection. Detail description about the used algorithm and image features is described in the following.
Figure 3. The proposed OBIA landslide detection algorithm.
3.1.1 Multiresolution segmentation
The multiresolution segmentation is a optimization procedure which locally minimizes the average heterogeneity of image objects for a given resolution and maximizes their respective homogeneity. The segmentation used in eCognition Developer is a bottom-up pairwise region merging algorithm, which starts with single image object (i.e. one pixel) and consecutively merging neighbour pixels or image objects, based on the chosen scale, spectral, and shape parameters. A larger scale parameter International Archives of the Photogrammetry, Remote Sensing and Spatial Information Sciences, Volume XXXVIII-1/C22, 2011
will result in larger image objects. On the other hand, choosing smaller scale will lead to over-segmentation and small objects (Laliberte et al., 2004). Although there are some tools for scale parameter estimation, it is difficult to find an appropriate value of scale parameter without performing trial-and-error test (Dragut and Blaschke, 2006).
In this paper, we also adopt the trial-and-error attempt to determine the scale parameter. During the multiresolution segmentation, except for the color information (Red, Green, and Blue) the topographic feature (Slope) is used as well. The slope gradient is derived from a 5-meters DEM. For landslide detection, i.e. we classify ground objects into landslide and non-landslide classes, a series of filtering process are applied after segmentation by means of Green-Red Vegetation Index (GRVI), Density and Brightness. The definition of these indices will be discussed later.
In addition to conventional single step segmentation and classification, this paper proposes the use of multiple steps image segmentation and classification for precise landslide mapping. At the first step, the segmentation on pixel level and classification using some rules similar to conventional OBIA procedure is adopted, the purpose is to detect reliable and small landslide regions that have high possibility of landslides. At the second step, another multiresolution segmentation on object level is performed using region growing in order to expand the landslides as large as possible by choosing a larger scale parameter. However, the Green channel is ignored during region growing in order to avoid miss-inclusion of vegetation into landslide. The Density feature is no longer use after first step, because the road have already avoided. At the third step, the multiresolution segmentation on object level is applied again, but focus on the resulting landslide regions. The purpose for this additional step is to remove the vegetation region enclosed by a larger landslide. Thus, a smaller scale parameter is assigned, the Green channel is considered again, and the weighting of Slope is higher than the color information.
3.1.2 GRVI
Since the adopted ortho-image does not cover near-infrared channel, the Green-Red Vegetation Index (GRVI) (Motohka et al., 2010; Tucker, 1979) was adopted as the spectral feature in this study. The GRVI is computed from the Green and Red channels, as shown in equation (1).
Red green vegetation (GRVI > 0) , soils (GRVI < 0) , and water/snow (GRVI close to 0) (Motohka et al., 2010). Because the images used in this study were not radiometrically calibrated but enhanced, we considered the estimated GRVI a relative value not an absolute one. They are used to remove the vegetation regions from the segmentation results in the proposed algorithm.
3.1.3 Density
According to the reference book of eCognition Developer©, the Density feature describes the distribution in space of the pixels of an image object. The most "dense" shape is a square; the more an object is shaped like a filament, the lower its density. The Density is calculated by the number of pixels forming the image object divided by its approximated radius, based on the covariance matrix (detail explanation can be found from the reference book of eCognition Developer©). This is an important
feature to filter out the road, which are shaped like a filament and observed without vegetation, from the bare ground objects.
3.1.4 Brightness
In eCognition Developer©, the Brightness means the weighting average of image intensity for each image object. Due to the
In this study, the ground truth (reference) is generated by visual inspection and selected manually from the multiresolution segmentation results. Considering the fact that the landslide is mass movement from slope terrain, thus during the selection of landslide objects, a 3D dynamic manipulated landscape is utilized for comparison by rendering the ortho-image on top of the DEM. However, due to shadow will deteriorate the image quality and affect the grey level distribution; the landslides under the shadow of mountains were eliminated. The ground truth of “new landslides” is obtained by the subtraction of “pre-event landslide ground truth” from “post-event landslide ground truth”. The accuracy assessment is performed by a confusion matrix provided by the eCognition Developer© that contains only two classes, i.e. landslide and non-landslide. The producer’s accuracy, user’s accuracy, and Kappa index are estimated for performance evaluation of landslide detection.
4. CASE STUDY & DISCUSSIONS
4.1 Study Area
A test site with 21.3 km2 in size, containing more than hundreds of landslides induced by Typhoon Morakot is used for landslide surveying. It is located at the southern part of Taiwan Island on a mountainous area. Figure 4 illustrate two pseudo color map of the elevation and slope variation for the test site. The terrain elevation varies from 580 to 1,600 meters and the slope gradient ranges from 0 to 76 degrees. In the figure, the blue tends to smaller value whereas the red tends to higher value. The land-cover types within the study area are majorly forest, river, bare soil (including landslides), farm-land, roads, and a few man-made buildings.
4.2 Accuracy Assessment
The classification of the image objects was performed by using membership functions, based on fuzzy logic theory combined with user-defined rules. A membership function ranges from 0 to 1 for each object’s feature values with regard to the object’s class. Table 1 tabulates all parameters used in the developed algorithm including the accuracy assessment results and some statistics of the detected landslides for both pre- and post-event cases. In this table, the symbols “<” and “>” mean “fuzzy smaller than” and “fuzzy larger than” that are within a specified upper and lower limits. For example, “GRVI ( < ) 0.01 ~ 0.03” means any image object has average GRVI value fuzzily smaller International Archives of the Photogrammetry, Remote Sensing and Spatial Information Sciences, Volume XXXVIII-1/C22, 2011
than (0.01~0.03) will be classified as possible landslides. The values (0.01~0.03) are the lower and upper limits of GRVI in the smaller fuzzy curve and corresponding to membership function (1 ~ 0). On the contrary, “Slope ( > ) 25~30” means any image object has average Slope fuzzily greater than (25~30) degrees will be classified as possible landslides. The values (25~30) are the lower and upper limits of Slope in the larger fuzzy curve and corresponding to membership function (0~1).
(a) elevation (b) slope
Figure 4. Pseudo color of elevation and slope variation of the test site. The blue tends to smaller value whereas the red tends
to higher value.
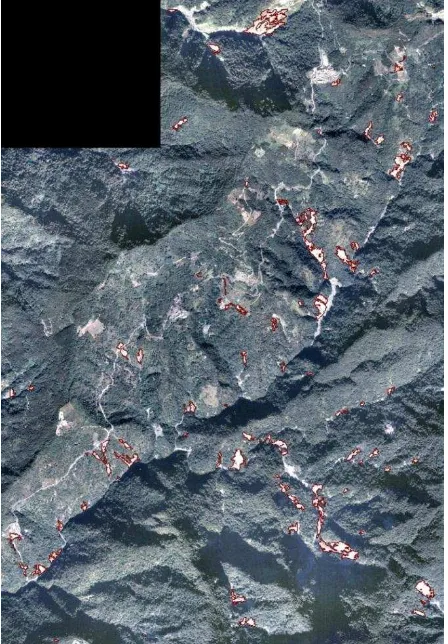
Figure 5 illustrates the final landslide detection results overlaid on the image taken before Typhoon Morakot. On the other hand, figure 6 demonstrate the results after Typhoon Morakot. The red polygons are the detected landslides. By visual inspection, one may realize that the detection results are almost correctly overlaid on the corresponding landslides.
4.3 Discussions
4.3.1 Detected landslides
Table 1 reveals the total area of the landslides after Typhoon Morakot is 129 hectares and the induced new landslides is 94.4 hectares. It means that the total area of landslides has increased for 3.7 times after Typhoon Morakot.
4.3.2 Overall accuracy
In table 1, all three stages of classification and accuracy assessment results are demonstrated as well. We realize that the proposed landslide detection scheme for post-event data can achieve up to 91% of producer’s accuracy, 84% of user’s accuracy, and a Kappa index of 0.87. Figures 7 and 8 show the trend of accuracy assessment are improved including the producer’s accuracy, user’s accuracy and Kappa index. One may observed that those three indices move from stage 1 to 3 toward to similar accuracy. That means both commission and omission errors are minimized and the overall accuracy was maximized through the suggested three-stage classification scheme.
4.3.3 Slope
A preliminary analysis for the slope distribution of detected landslides ranges from 26.4 degrees to 61.8 degrees. The lower bound is restricted by the input slope limitation during the classification stage. The upper bound reflects the topographic feature of the detected landslides. Omission might be found along the valley with lower terrain slope and the mud-flow happened frequently.
Figure 5. Landslide detection results (red) overlaid on the used aerial image taken before Typhoon Morakot.
Figure 6. Landslide detection results (red) overlaid on the used UAV image taken after Typhoon Morakot.
Figure 7. Accuracy improvement of pre-event case.
Figure 8. Accuracy improvement of post-event case.
4.3.4 Road
The roads obtain similar spectral feature to the bare ground but different shape, thus they can be separated from susceptible landslides using the Density feature easily at the first stage. Figure 9 depicts the landslide detection results that remove the roads effectively.
Figure 9. Roads are removed from susceptible landslides (blue).
4.3.5 GRVI & Brightness
The fallow, i.e. farm-land in restoration period that has no vegetation, located on the slope terrain has similar spectral and topographic characteristic to the landslide. Thus, it is difficult to remove them from the susceptible landslides. Since the adopted vegetation index is a relative value and dependent on the input image quality and pre-processing method, such as image enhancement or color adjustment, the GRVI cannot perfectly identifying vegetation area. On the other hand, the Brightness is
somewhere more useful to distinguish the landslide from farm-land and forestry.
4.3.6 Shadow
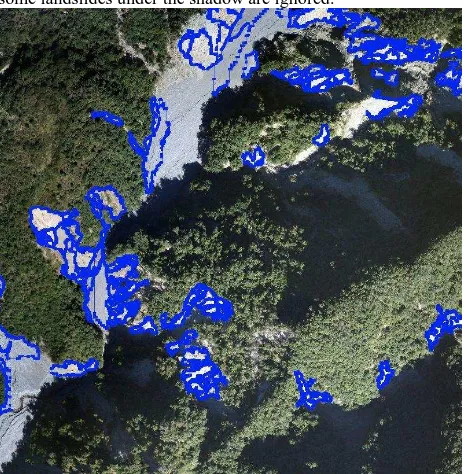
Since shadow will degrade the image quality and introduce different grey level distribution, thus they were ignored during the classification stage. Figure 10 illustrates one example of shadow effect that affect the landslide detection. One may found some landslides under the shadow are ignored.
Figure 10. Shadow effect that degrade the landslide detection results (blue).
4.3.7 Sensor
Since the used sensors have different spatial resolution and spectral response, the image size for UAV / Canon EOS 5D Mark 2 image is 3 times larger than the one taken by Airborne / RMK TOP 15. In the meantime, due to a three-stage segmentation and classification process is suggested; the total of process time has increased three times of conventional workflow. Since the commission and omission errors were minimized, the overall classification accuracy has increased, and the proposed scheme is in proceed in fully automatic way, the drawback of intensive computation time is acceptable and can be solved by more powerful computer.
5. CONCLUSIONS
For landslide mapping purpose, this paper suggests the use of a fix-wing UAV for image collection. The landslide detection procedure is performed fully automatically, except for parameters setup, through an object-based image analysis algorithm. The input data is simply the ortho-image and digital elevation model, but a three-stage segmentation and classification scheme is proposed. Experimental results show that the total area of the landslides after Typhoon Morakot is 129 hectares which is 3.7 times of landslide area before the event. In accuracy assessment, the developed landslide detection algorithm can achieve up to 91% of producer’s accuracy, 84% of user’s accuracy, and a Kappa index of 0.87. Comparing with the accuracies obtained from all three stages, the overall accuracy is maximized due to the commission and omission errors are minimized. It demonstrates that the proposed three-stage classification scheme is applicable and has high potential for precise landslide mapping purpose.
ACKONOWLEDGMENT
This research was financially supported by the National Science Council, Taiwan, with project number NSC 100-2119-M-006-006, The authors are grateful to Aerial Surveying Office, Bureau of Forestry, Taiwan, for providing the aerial image.
REFERENCES
Arattano, M., Marchi, L., 2008. Systems and sensors for debris-flow monitoring and warning. Sensors 8, pp:2436-2452. Barlow, J., Martin, Y., Franklin, S., 2003. Detecting translational landslide scars using segmentation of Landsat ETM+ and DEM data in the northern Cascade Mountains, British Columbia. Canadian journal of remote sensing 29, pp.510-517.
Blaschke, T., 2010. Object based image analysis for remote sensing. ISPRS Journal of Photogrammetry and Remote Sensing 65, pp.2-16.
Delacourt, C., Raucoules, D., Le Mouélic, S., Carnec, C., Feurer, D., Allemand, P., Cruchet, M., 2009. Observation of a large landslide on La Reunion Island using differential SAR interferometry (JERS and Radarsat) and correlation of optical (Spot5 and Aerial) images. Sensors 9, pp.616-630.
Dragut, L., Blaschke, T., 2006. Automated classification of landform elements using object-based image analysis. Geomorphology 81, pp.330-344.
Jaboyedoff, M., Oppikofer, T., Abellán, A., Derron, M.-H., Loye, A., Metzger, R., Pedrazzini, A., 2010. Use of LIDAR in landslide investigations: a review. Natural Hazards.
Laliberte, a., Rango, a., Havstad, K., Paris, J., Beck, R., Mcneely, R., Gonzalez, a., 2004. Object-oriented image analysis for mapping shrub encroachment from 1937 to 2003 in southern New Mexico. Remote Sensing of Environment 93, pp.198-210. Metternicht, G., Hurni, L., Gogu, R., 2005. Remote sensing of landslides : an analysis of the potential contribution to geo-spatial systems for hazard assessment in mountainous environments. Remote Sensing of Environment 98, pp.284 - 303.
Motohka, T., Nasahara, K.N., Oguma, H., Tsuchida, S., 2010. Applicability of Green-Red Vegetation Index for Remote Sensing of Vegetation Phenology. Remote Sensing 2, pp.2369-2387.
Tucker, C.J., 1979. Red and photographic infrared linear combinations for monitoring vegetation. Remote Sensing of Environment 8, pp.127-150.
Table 1. Statistics and accuracy assessment of landslide detection results