CO-REGISTRATION OF TERRESTRIAL LASER SCANNING POINTS AND 2D FLOOR
PLANS BASED ON MAXIMUM SEQUENTIAL SIMILARITY REASONING
L. Wang*, G. Sohn
GeoICT Lab, York University, 4700 Keele St., Toronto, ON M3J 1P3, Canada - (wangly, gsohn)@yorku.ca
Commission V, WG V/3
KEY WORDS: TLS, Point Cloud, Floor Plan, Integration, CAD, Matching, Registration
ABSTRACT:
This paper presents a Maximum Sequential Similarity Reasoning (MSSR) algorithm based method for co-registration of 3D TLS data and 2D floor plans. The co-registration consists of two tasks: estimating a transformation between the two datasets and finding the vertical locations of windows and doors. The method first extracts TLS line sequences and floor plan line sequences from a series of horizontal cross-section bands of the TLS points and floor plans respectively. Then each line sequence is further decomposed into column vectors defined by using local transformation invariant information between two neighbouring line segments. Based on a normalized cross-correlation based similarity score function, the proposed MSSR algorithm is then used to iteratively estimate the vertical and horizontal locations of each floor plan by finding the longest matched consecutive column vectors between floor plan line sequences and TLS line sequences. A group matching algorithm is applied to simultaneously determine final matching results across floor plans and estimate the transformation parameters between floor plans and TLS points. With real datasets, the proposed method demonstrates its ability to deal with occlusions and multiple matching problems. It also shows the potential to detect conflict between floor plan and as-built, which makes it a promising method that can find many applications in many industrial fields.
* Corresponding author. This is useful to know for communication with the appropriate person in cases with more than one author.
1. INTRODUCTION
Terrestrial Laser Scanning (TLS) can provide dense, highly accurate 3D information, which makes it become a key data acquisition tool providing accurate, detailed spatial information. TLS data has been proven to be a valuable source for 3D building reconstruction, especially for facade modelling. The main task of façade reconstruction using TLS data is to accurately recognize the façade features and delineate their boundaries. Despite some promising results have been demonstrated (Pu, 2010; Ripperda et al, 2009; Luo & Sohn, 2010), it can be seen that extracting correct semantic information and meaningful structures from TLS data is not a trivial problem. Most of the existing methods have reported difficulties to achieve its success to detect all details required for façade modelling.
(Wang & Sohn, 2011) proposed a framework to reconstruct integrated 3D building models with both indoor, facade and roof structure and semantic information. By integrating floor plans with TLS data, some of the above-mentioned problems can be solved and integrated 3D facade and indoor models can be reconstructed.
Nowadays, using TLS to assess damage and modification, to make adaptive reuse of buildings, and to perform as-built verification is becoming the next-step in the application of TLS. In all these applications, architectural floor plans can play an important role to facilitate the TLS data processing. In order to take advantage of many benefits that architectural floor plans can provide, how to co-register 3D TLS points with these 2D architectural floor plans becomes the problem needs to be solved first.
Even though there are large demands of integrating TLS with architectural drawings, not many research works have been reported in this field. In (Wang & Sohn, 2010), integrating semantic and geometric information for outline matching was proposed for co-registration of 3D TLS data and 2D floor plans. It demonstrated its potential to georeference floor plans by using TLS points. However, it also showed its limitation to deal with occlusion and multiple matching problems efficiently. For example, when the facade features (e.g., windows and doors) have similar structures or some parts of a facade are occluded, it may produce wrong results.
Another related research is (Khoshelham et al., 2009), in which a method for automated point cloud-to-map registration using a plane matching technique is presented to georeference the 3D point clouds using 2D maps. Because it uses 2D building footprint maps for the registration, which have less detailed building semantic and geometric information than floor plans, the registration cannot further facilitate TLS data processing towards 3D building modelling and other aforementioned industrial applications.
In this paper, we present a Maximum Sequential Similarity Reasoning (MSSR) algorithm based method for co-registration of 3D TLS data and 2D floor plans. An overview of the proposed method is presented in Section 2. Section 3 introduces the main data processing steps. The proposed MSSR method is presented in detail in Section 4. The final results and some discussions are presented in Section 5.
2. OVERVIEW OF THE PROPOSED METHOD
The co-registration method performs two main tasks: estimating a transformation between the two datasets and finding the vertical locations of facade features such as windows and doors. The main steps of the proposed method are shown in Figure 1. First, in order to solve the dimensional difference (i.e., 3D TLS vs. 2D plan) and find the comparable parts between the two datasets, wall line segments are extracted from the two datasets respectively. 2D TLS wall lines are extracted from horizontal cross-sections of the TLS points at each certain height interval.
Figure 1. A flowchart of the main steps of the proposed method Then TLS wall lines at each cross-section level and floor plan wall lines of each storey are connected into line sequences respectively. Each line sequence is further decomposed into and represented by column vectors defined by using local transformation invariant information between two neighbouring line segments.
The proposed MSSR algorithm is based on the fact that the vertical location of windows and doors is where the longest matched line sequences between floor plan line sequences and TLS line sequences exist. The MSSR algorithm iteratively estimate the vertical and horizontal locations of each floor plan by using normalized cross-correlation based similarity score function to find the longest matched line sequences between the floor plan line sequence and TLS line sequences at each certain height level. Finally, a group matching algorithm is applied to prune matching errors and simultaneously determine final matching results across floor plans and estimate the transformation parameters between floor plans and TLS points.
3. DATA PRE-PROCESSING
We will demonstrate our proposed method using real datasets. As shown in Figure 2, the test building (chemistry building at York University) is a four-storey building with two wings. We scanned the south facade of the building, which corresponds to the bottom part of the sample floor plan in Figure 2(b), using Riegl-Z390i with an angular resolution of 0.05 degree. As can be seen in Figure 2(a), the facade of the ground floor is
occluded by some trees and flowers in the flowerbed in front of the building, which will pose some problems in the TLS outline extraction and line matching.
3.1 Floor Plan Pre-processing
Nowadays, most floor plans are in digital CAD-format files, in which building features like walls, windows and doors are stored in different layers. This makes it easier to extract wall lines.
(a) Photo of the facade (b) The second floor plan
(c) Original TLS data of the facade shown in (a)
Figure 2. A photo, original TLS point clouds and floor plan of the test building
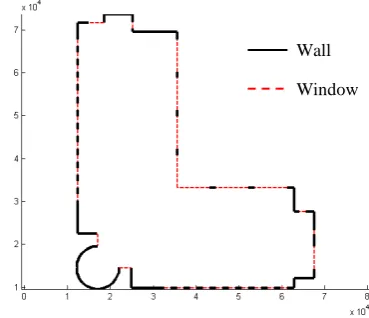
Figure 3. A sample extracted floor plan outline
3.1.1 Floor Plan Line Sequences Extraction: Figure 3
shows an example of the extracted floor plan outline of the second floor. The solid black lines represent wall lines which are originally extracted from the floor plan data. The dashed red line segments are those virtually added which indicate the facade features that cause the gaps between two wall lines.
Floor Plans TLS Points
Floor Plan Wall Lines Extraction
Vertical Alignment of Floor Plans
TLS Wall Lines Extraction
Maximum Sequential Similarity Reasoning (MSSR)
Group Matching
Data Pre-processing
Wall Window Line Sequence Representation
3.1.2 Vertical Alignment of Floor Plans: One problem of
floor plans is that when the floor plans were designed or digitized from paper drawings, most of the time they were not drawn with respect to the same origin. It’s also possible that they even have different scales or directions. We use a histogram cross-correlation based polygon matching method to automatically register the floor plan line. The advantage of getting all the floor plans aligned before registration is that, as shown later in the group matching section, even if one floor is totally occluded it still can get the transformation parameters from the other floors.
3.2 TLS Data Pre-processing
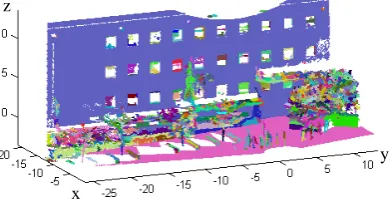
3.2.1 Segmentation: The planar surface growing algorithm
described in (Vosselman et al, 2004) is used to segment the original TLS point clouds. Figure 4 shows the segmentation result.
Figure 4. Segmentation result (unit:m)
(a) Extracted facade points with a horizontal cross-section plane at 10.1m
(b) Cut TLS points between 10m and 10.2m
(c) Extracted TLS outline from (b) Figure 5. TLS line sequence extraction (unit: m)
3.2.2 Facade Points Extraction: Using the information (i.e.,
width, height, area and plane normal direction) of the detected planar segments, ground points are distinguished and the noisy non-facade points (i.e., points on trees and cars) are removed. Figure 5(a) shows the extracted facade points after this process. It can be seen that most of the TLS points of the ground floor are missing due to the occlusions.
3.2.3 TLS Line Sequences Extraction: In order to extract
2D wall line segments from TLS points, we cut the facade points into a series of small bands of points with constant height of 0.2 meter from bottom to top. Each band of 3D TLS points are projected onto the horizontal cross-section plane at the average height of these points. Then, wall line segments are extracted from these projected TLS points using RANSAC algorithm. These wall lines can be regarded as 2D lines at a certain height. Figure 5(b) shows an example of TLS band located between 10 and 10.2 meters. In Figure 5(c), the red lines are the corresponding wall lines estimated from Figure 5(b).
In a similar way, we also connect the wall lines using virtual line segments to form TLS line sequences and attribute these virtual lines as unknown.
4. MAXIMUM SEQUENTIAL SIMILARITY REASONING
After data pre-processing, the problem is converted to line sequence matching problem. In order to overcome the difficulty and uncertainties caused by occlusions and similar building feature structures, we propose a Maximum Sequential Similarity Reasoning (MSSR) based method to re-represent the line sequences and estimate the locations of windows and doors.
=
i i i i
i
AR AL r
u
θ
where li,li+1: two consecutive line segments Ɵi: angle between two line segments
ri: ratio between two line segments
ALi : Attribute of li
ARi : Attribute of li+1
if the line sequence is closed then i=1,2,… n, and when i=n, i+1=1
else i=1,2,… n-1
Figure 6. Transforming from two consecutive line segments to a column vector
4.1 Line sequence Representation
Given a line sequence consists of n line segments. We transform every two connected line segments to a column vector as shown in Figure 6, where li,li+1 are two consecutive line segments. Ɵi
represents the angle between the ith and i+1th line segments; and the unit is radian. ri represents the length ratio between the ith
and i+1th line segments, which is unitless. AL
i and ARi represent y
z
y z
Wall Unknown
y x
z
Wall Unknown or window or door
li li+1
Ɵi
ri
ALi ARi
the line attribute of the ith and i+1th line segments respectively. The line attribute could be wall, window, door or unknown. For the sake of calculating the similarity score, we assign 1 to wall and 0 to window, door and unknown. It’s clear that all the information and attributes are invariant to translation, rotation, and scale changes.
Then, by putting the column vectors of a whole line sequence or part of any length of the line sequence in one matrix we can get a “line” matrix as (1). The “line” matrix has 4 rows and i
After defining the line matrix representation of the line sequence, the line sequence matching problem is converted to compare the similarity between two line matrices. Then given a TLS line sequence matrix T, and a floor plan line sequence matrix F, the similarity can be calculated using the normalized cross-correlation function (2). The similarity measurement S ranges from -1 to 1, with 1 indicating exact match.
[
]
4.3 Maximum Sequential Similarity Reasoning
Given a TLS line sequence matrix T and a floor plan line sequence F, the Maximum Sequential Similarity (MSS) is defined as the number of the longest consecutive matching column vectors between T and F when the similarity score is within a pre-specified threshold.
As shown in Algorithm 1, in general the proposed MSSR algorithm matches each column vector from floor plan line matrix F with each column vector from TLS line matrix T. Once a matched pair is found, it will add the next column vector to
the two current matrices respectively to form two new expended matrices and then, recalculates the similarity score based on the two new matrices. This procedure will continue until similarity score becomes lower than the threshold. When expending matrix F, if it exceeds the end of the matrix, it will return to the first column and continue the expansion.
After iteratively matching all the column vectors, in the end the algorithm will find the MSS , which is the maximum number of the matched consecutive column vectors, and corresponding longest matched line sequences between the two line sequences.
Algorithm 1: Maximum Sequential Similarity Reasoning
Set similarity score threshold SH (in our case =0.99) For i=1 to Fnum //the number of columns of F Find the maximum C and corresponding column vectors from CH
4.4 Finding Maximum Sequential Similarity for Each Floor
The vertical locations of windows and doors are estimated by finding the MMS for each floor. The number of storeys of a building is known. The façade height of the building can also be estimated by calculating the difference between the highest elevation of the façade and the ground. Then, the average storey height can be calculated. To make the method more effective, for each floor, the floor plan line sequence is only compared with TLS line sequences within its vertical extent. Then, from all the MSS at each height level within this storey, the one with the maximum value is selected and used as the floor MSS. The vertical location where the floor MSS is found is the potential location of the windows and doors. Figure 6 shows the MMS result for the whole façade. The floor MSS are those peaks and the potential vertical locations of windows and doors are their corresponding heights.
As shown in Figure 6, there might exist multiple floor MSS. In our case, the fourth floor and third floor have five floor MSS respectively; whereas, the second floor has one and the first floor have 3 floor MSS. The final floor MSS will be determined after calculating the transformation parameters.
One problem found is that for the ground floor, at one floor MMS vertical location, there are totally 5 MMS pairs that turn International Archives of the Photogrammetry, Remote Sensing and Spatial Information Sciences, Volume XXXVIII-5/W12, 2011
out to have the same score and length. As shown in Figure 7, the green dotted rectangle indicates the correct horizontal location of the detected TLS line sequence. The purple dotted rectangle shows the locations of the found MMS, obviously all of them are not at the correct horizontal location. This problem is mainly caused by occlusions and the similar window structure of the ground floor.
Figure 6. Result of maximum sequential similarity
Figure 7. Multiple matches of the ground floor plan Another finding is that a small difference between the floor plan and the as-built also contributes to the problem. These is a rectangular concave area on the facade (indicated by the red dotted circle in let image of Figure 6), which detected by the TLS, is not indicated in the floor plan. This shows the potential to detect the difference between the floor plan and as-built using TLS data after registration of the two datasets.
4.5 Group Matching
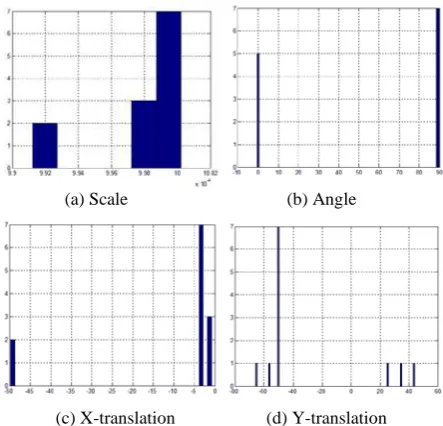
In order to deal with the multiple matching and mismatching errors like shown in Figure 7, we propose a group matching scheme to prune those mismatches and calculate the correct transformation parameters. We use all the maximum matched line sequences of each floor to estimate the final transformation parameters. First, each MMS pair from TLS and floor plan is used to compute a similarity transformation using well-know least-square method. The transformation parameters, the scale, rotation and X- and Y- direction translations, are extracted separately.
As shown in Figure 8, for each parameter, we create an accumulator array (like the Hough transformation accumulator array). The x-axis represents the parameter values from the calculation. We split the range of the parameter value into equal-sized bins. Then we vote for each bin using the values calculated for this parameter and accumulate the count. The y-axis represents the count for each bin value. In the end, we scan for the accumulator of each parameter searching for the bins which have the highest count. The final transformation parameters will be determined using the bin values with the highest counts in their respective accumulator.
(a) Scale (b) Angle
(c) X-translation (d) Y-translation Figure 8. Accumulators for voting for the transformation
parameters
4.6 Finding Final Floor MSS
After calculating the correct transformation parameters, all the floor line sequences of the floor MSS pairs will be transformed to the TLS coordinate system. The distances between all the end points of the transformed floor plan line sequence and those of the corresponding TLS line sequences will be calculated. Then the Root Mean Square Errors (RMSE) of the distance is calculated. Floor MSS pair that has the minimum RMSE are used as the final floor MSS and its vertical location is the final vertical location of the windows and doors.
5. TEST RESULTS AND DISCUSSIONS
Figure 8 shows the final co-registered TLS point cloud and 2D floor plan outlines. Table 1 shows the co-registration accuracy of each floor. The accuracy is calculated using the final floor MSS pairs. the accuracy measure is the RMSE of the distances between the end points of transformed floor plan line sequences of final floor MSS and those of the corresponding TLS line sequences. As can be seen, the higher floors have better accuracy, which makes sense since the lower floors have occlusions.
It is worth mentioning that after calculating the transformation parameters, when we transform all floor plan outlines to TLS data, all the potential matching TLS lines can be found, including those of the ground floor plan. This shows one of the MSS
Height
y Height
Wall Window Door
Real location Wrongly matched location
advantages of the group voting method, which can deal with multiple matching and spurious matching problems. For those TLS line segments that cannot find a match, they will not be window or door line segments. These line segments may be created by occlusions and also possibly be the differences between the floor plan and as-built. Further research can be done to develop more detailed algorithms to detect this kind of conflicts.
Figure 8. Co-registered original TLS data and floor plan outlines
Ground Floor
Second Floor
Third Floor
Fourth Floor RMSE(m) 0.0368 0.0507 0.0267 0.022
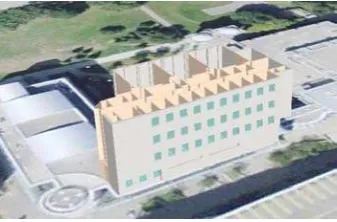
Table 1. Co-registration accuracy of each floor The co-registration of TLS data and floor plans also has many other applications. It provides a basic step towards 2D CAD data and 3D GIS data integration and automatic integrated 3D indoor and façade modelling. Figure 9, shows an example of a 3D building model with integrated indoor and facade geometric and semantic information. The model is reconstructed based on the co-registration of TLS points and floor plans in Figure 2 using MSSR based method. It can be seen that after co-registration of TLS and floor plans, this kind of building models can be reconstructed easily and more automatically.
Figure 9. An example of integrated 3D facade and indoor model can be reconstructed based on co-registration
6. CONCLUSION
We have proposed a Maximum Sequential Similarity Reasoning (MSSR) based method for co-registration of 3D TLS data and 2D floor plans. The method decomposes the TLS and floor plan
line sequences into column vector and use line matrix to represent the line sequences. A group matching scheme is developed to estimate the transformation parameters, which makes it be able to deal with occlusions and multiple matching problems. The promising results shows the feasibility to use floor plans and TLS data for 2D CAD and 3D GIS integration and 3D building modelling. This idea can be extended to use other architectural drawing and provide a new way to bridge the gap between CAD and GIS.
The proposed method also has the potential to detect conflict between floor plan and as-built, which makes it a promising method that can find many applications in many industrial fields such as civil engineering, construction, as-built of buildings, plants and facilities. In the future, more tests will be done to improve the applicability for different building types. In the meantime, more possible applications based on the proposed method will also be further explored.
ACKNOWLEDGEMENTS
The authors would like to thank GEOIDE, Ontario Centres of Excellence (OCE), Natural Sciences and Engineering Research Council of Canada (NSERC) for their support in this research.
REFERENCES
Khoshelham, K., Gorte, B.G.H., 2009. Registering pointclouds of polyhedral buildings to 2d maps. In: Proceedings of the 3rd ISPRS International Workshop 3D-ARCH 2009: "3D Virtual Reconstruction and Visualization of Complex Architectures", Trento, Italy, Volume XXXVIII-5/W1, pp. 1-7.
Luo, C., Sohn, G., 2010. Deriving structural knowledge from terrestrial laser scanning data for 3D facade reconstruction. In: Proceedings of Canadian Geomatics Conference 2010 and ISPRS COM I Symposium, Calgary, Canada, June 14-18, 2010 Pu, S., 2010. Knowledge based building facade reconstruction from laser point clouds and images. Ph.D. thesis, International Institute for Geo-information Science and Earth Observation, Twente University of Technology
Ripperda, N., Brenner, C., 2009. Application of a formal grammar to facade reconstruction in semiautomatic and automatic environments. In: Proceedings of 12th AGILE Conference on GIScience, Hannove, Germany
Vosselman, G., B. Gorte, G. Sithole and Rabbani, T., 2004. Recognizing Structure in Laser Scanner Point Clouds. International Archives of Photogrammetry, Remote Sensing and Spatial Information Sciences, vol. 46, part 8/W2, Freiburg, Germany, October 4-6, pp. 33-38.
Wang, L., Sohn, G., 2010. Automatic co-registration of terrestrial laser scanning data and 2D floor plan. In: Proceedings of Canadian Geomatics Conference 2010 and ISPRS COM I Symposium, Calgary, Canada, June 14-18, 2010 Wang, L., Sohn, G., 2011. An Integrated Framework for Reconstructing Full 3D Building Models. Advances in 3D Geo-Information Sciences. T. H. Kolbe, G. König and C. Nagel, Springer Berlin Heidelberg: 261-274.