IMPACT OF BUILDING HEIGHTS ON 3D URBAN DENSITY ESTIMATION FROM
SPACEBORNE STEREO IMAGERY
Feifei Peng a, Jianya Gong a, b, c , Le Wang c, d, Huayi Wu a, c, Jiansi Yang e
a State Key Laboratory of Information Engineering in Surveying, Mapping and Remote Sensing (LIESMARS), Wuhan University, Wuhan, China - (feifpeng, gongjy, wuhuayi)@whu.edu.cn
b School of Remote Sensing and Information Engineering, Wuhan University, Wuhan, China c Collaborative Innovation Center of Geospatial Technology, Wuhan, China
d Department of Geography, The State University of New York at Buffalo, Buffalo, NY, USA - [email protected] e School of Urban Design, Wuhan University, Wuhan, China - [email protected]
Commission III, WG III/4
KEY WORDS: Urban Density, Building Density, 3D Density, Building, Height, Floor Area Ratio, Stereo Imagery, Impact
ABSTRACT:
In urban planning and design applications, visualization of built up areas in three dimensions (3D) is critical for understanding building density, but the accurate building heights required for 3D density calculation are not always available. To solve this problem, spaceborne stereo imagery is often used to estimate building heights; however estimated building heights might include errors. These errors vary between local areas within a study area and related to the heights of the building themselves, distorting 3D density estimation. The impact of building height accuracy on 3D density estimation must be determined across and within a study area. In our research, accurate planar information from city authorities is used during 3D density estimation as reference data, to avoid the errors inherent to planar information extracted from remotely sensed imagery. Our experimental results show that underestimation of building heights is correlated to underestimation of the Floor Area Ratio (FAR). In local areas, experimental results show that land use blocks with low FAR values often have small errors due to small building height errors for low buildings in the blocks; and blocks with high FAR values often have large errors due to large building height errors for high buildings in the blocks. Our study reveals that the accuracy of 3D density estimated from spaceborne stereo imagery is correlated to heights of buildings in a scene; therefore building heights must be considered when spaceborne stereo imagery is used to estimate 3D density to improve precision.
1. INTRODUCTION
Urban density is considered as an important factor in urban planning and design (Susaki et al., 2014). Urban density usually can refer to either population density or building density depending on the discipline (Susaki et al., 2014). In this study, we consider urban density as building density. Building density can be measured in two dimensions (2D) or three dimensions (3D) (Berger et al., 2013). 2D density measurement takes building footprint size alone into consideration, while 3D density considers building height as well as building footprint size. 3D density is effective when distinguishing between areas found to be confusing in 2D density measurement approaches. For instance, in areal classification, slums with compact low buildings and central business districts with high buildings both have high 2D density. But, the former has a low 3D density, while the latter has a high 3D density.
The effectiveness of 3D density for distinguishing between areas similar in 2D stems from the use of building heights in density calculation. Accurate building heights however; are not always available, and are frequently estimated from remotely sensed imagery such as spaceborne stereo imagery (Wurm et al., 2014), airborne LIDAR data (Berger et al., 2013; Yu et al., 2010), and polarimetric SAR images (Kajimoto and Susaki, 2013; Susaki et al., 2014). These estimated building heights inevitably have some errors that may negatively influence 3D density estimation.
The impact of building height accuracy on 3D density estimation from spaceborne stereo imagery must be determined given the widespread and increasing usage of this imagery. A lot of stereo images are currently available due to many satellite systems with stereo observation capabilities (Peng et al., 2015), and are frequently used as data source in a variety of approaches for obtaining building heights (Haala and Kada, 2010). Most of these methods (Brunn and Weidner, 1997; San and Turker, 2007; Tian et al., 2014) obtain building height from stereo-extracted digital surface model (DSM) by subtracting the digital terrain model (DTM) without above-ground objects. Building heights can also be calculated using the parallax method (Lemoine et al., 2012), attribute filters and geometric invariant moments method (Licciardi et al., 2012), and other methods (Haala and Kada, 2010).
The impact of building height accuracy on 3D density estimation must be determined for an entire study area, as well as for local areas within a study area. The methods discussed have some common limitations, such as variable height accuracy in different local areas (Poli et al., 2015; Sirmacek et al., 2012; Toutin, 2004), and variable height accuracy for buildings with different heights (Zeng et al., 2014). For instance, extremely high buildings have large height errors because of large image parallax (Zeng et al., 2014). Variable building height accuracy may result in unstable 3D density accuracy in different local areas.
Existing accurate planar information can be used as 2D reference data during 3D density estimation, to avoid the errors The International Archives of the Photogrammetry, Remote Sensing and Spatial Information Sciences, Volume XLI-B3, 2016
inherent to planar information extracted from remotely sensed imagery. Besides building heights, planar information (e.g. building footprint) is required during 3D density calculation. If a building footprint is inaccurate, it negatively influences the building height estimated with the footprint (Haala and Kada, 2010; Zeng et al., 2014), and further influences 3D density estimation. Moreover, land use block data is required when calculating the frequently used floor area ratio and other 3D density indicators, but is difficult to obtain from remotely sensed imagery. Fortunately, accurate planar information including building footprints and land use blocks, is available from city authorities or from volunteered geographic information (Elwood, 2008; Goodchild and Li, 2012), such as OpenStreetMap (OpenStreetMap, 2015).
2. METHODOLOGY
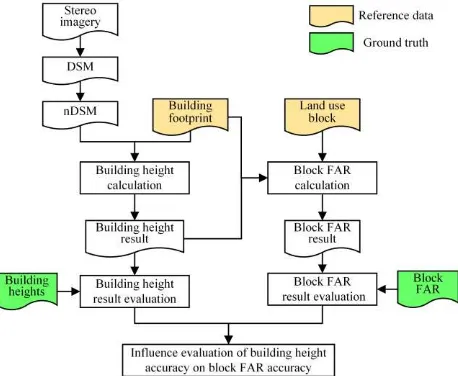
A flowchart of the proposed method to investigate the impact of building heights on 3D urban density estimation from spaceborne stereo imagery is shown in Figure 1. The Floor Area Ratio (FAR) is a popular 3D density indicator (Berger et al., The proposed method uses two 2D reference data sets: building footprints, and land use blocks. Two ground truth data sets, including building heights and block FAR values, were used in the evaluation step.
Figure 1. A flowchart of our method to investigate the influence of building heights on block FAR accuracy.
2.1 Building Height Calculation
For each building footprint in the reference data, the building height was calculated from a normalized digital surface model (nDSM). The nDSM was obtained from a DSM extracted from spaceborne stereo imagery (Yu et al., 2010) and the building height was estimated for each building footprint as Equation (1).
( )
Height = height of the building Building i( )
pm = total pixel number of the building Building i( ) FAR was calculated as Equation (2).
( ) (i)
Floors is calculated as Equation (3).
( )
total floor number of the building Building i( )k
AvgFloorH = average building floor height
During block FAR calculation, estimated or true building heights were used. For the same land use block, the FAR value calculated with estimated building heights is the estimated value, while the FAR value calculated with true building heights was used as the ground truth.
2.3 Evaluation of results
The evaluation included the building height results, block FAR results, and an evaluation of the influence of building height accuracy on block FAR accuracy. The building height results were evaluated through a comparison of the estimated and true building heights. The block FAR results were evaluated through a comparison of estimated and true FAR values. The impact of building height accuracy the block FAR accuracy was evaluated by comparing trends.
Result evaluation was executed not only in the entire study area but also for local areas. Local areas were obtained by classifying land use blocks into several levels, and grouping continuous FAR values into ranges. Different block FAR levels were compared in three ways: building height distribution, building height accuracy, and block FAR accuracy. At each block FAR level, the impact of building height accuracy on block FAR accuracy was investigated.
3. EXPERIMENTAL RESULTS
3.1 Study Data
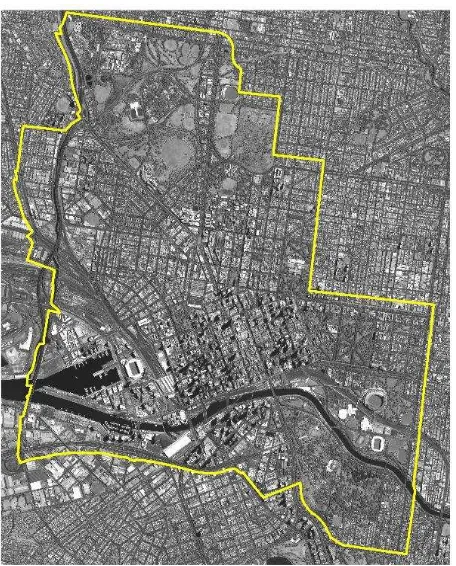
As shown in Figure 2, the study site is 23 square kilometres, located in Melbourne (37°48’S, 144°57’E), Australia. For the study site, the available data includes a Pleiades-1A stereo pair, and two 2D reference data sets, building footprints and land use blocks. The stereo pair was acquired at 00:25 on February 25, 2012. Two images of the stereo pair were both at the ground sample distance (GSD) 0.5m, and were taken with off-nadir looking angles +16.2º and -16.5º, respectively. The image with the off-nadir looking angles +16.2º is shown. The convergence angle of the stereo pair was 32.3º. The base-height-ratio of the stereo pair was 0.57. The two reference data sets were current as of July, 2014. There were 481 land use blocks in the study area, with 13754 building footprints.
Figure 2. Pleiades-1A stereo imagery with the study area identified by the yellow boundary line.
3.2 Building Height Results
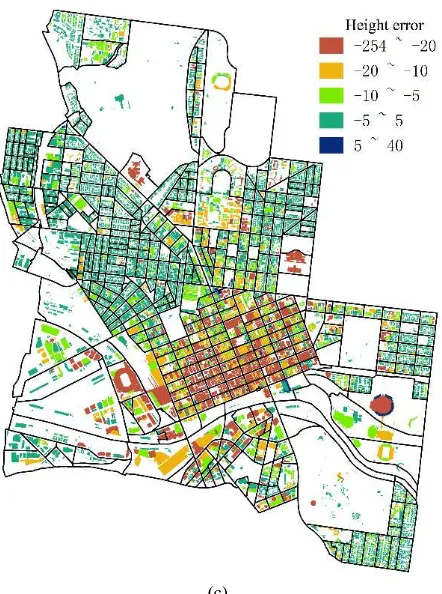
It can be seen from Figure 3 that the heights of most buildings were underestimated during stereo image processing. The polygons with the black colour border are land use blocks, while the coloured polygons are building footprints whose heights or errors are indicated in the legend. There are more buildings in green colour (low heights) in the estimated building height map (a) than in the true building height map (b). Most buildings were significantly underestimated especially the tall buildings in the central area of the study site; this aligns with the negative building height errors in the centre as seen in the building height error map (c). Most low buildings had errors ranging from -5 and 5 meters, while most tall buildings had large errors.
Experimental results show that a large number of buildings had negative height errors, while only a small number of buildings had positive height errors. The distributions of building height
values and errors are shown in Figure 4 (a) and (b), respectively. There were less tall buildings but more short buildings in the estimated results than found in the ground truth data. Most building height errors were close to zero.
(a)
(b)
(c)
Figure 3. Building height results. (a) Estimated building height map. (b) True building height map. (c) Building height error map.
(a)
(b)
Figure 4. Distributions of building height values and errors. (a) Building height value distribution comparison between result and ground truth. (b) Building height error distribution.
3.3 Block FAR Results
It can be seen from Figure 5 that FAR values for most blocks were underestimated. During FAR calculation, the average building floor height AvgFloorH required in Equation (3) was set at three meters. Many blocks in red colour (high FAR values) in the true FAR map (b) are seen in the orange colour (moderate FAR values) in the estimated FAR map (a), such as in the central area of the study site. Many blocks in orange colour (moderate FAR values) in (b) were in light green colour (low FAR values) in (a), such as in the left upper part of the study site. As seen in the FAR error map (c), most blocks have negative errors.
Experimental results show that a large number of blocks had negative errors, while only a small number of blocks had positive errors. The distributions of block FAR values and errors are shown in Figure 6(a) and (b), respectively. It can be seen from Figure 6 (a) that there were less blocks with high FAR values, but more blocks with low FAR values in the estimated results than in the ground truth data. In Figure 6(b), the FAR errors for most blocks were close to zero.
(a)
(b)
(c)
Figure 5. Block Floor Area Ratio (FAR) results. (a) Estimated FAR map. (b) True FAR map. (c) FAR error map.
(a)
(b)
Figure 6. Distributions of block FAR values and errors. (a) Block FAR value distribution comparison between result and ground truth. (b) Block FAR error distribution.
3.4 Impact of Building Heights on FAR Accuracy in the
Whole Study Area
In the whole study area, underestimation of building heights was related to underestimation of block FAR values from
spaceborne stereo imagery. Most buildings had negative height errors, thus most blocks also had negative FAR errors. Height errors for most buildings were close to zero, resulting in small FAR errors for most blocks.
3.5 Impact of Building Heights on FAR Accuracy in Local
Areas
The impact of building heights on block FAR accuracy was investigated in local areas as well as for the whole study area. The land use blocks in the study site were almost evenly divided into four levels according to their true FAR values. The four block FAR levels are identified from low to high level as L1 ( 0.0FAR0.9 ), L2 ( 0.9FAR1.5 ), L3 ( 1.5FAR3.3 ), and L4 (FAR3.3 ), respectively. The block counts for the four levels; the counts of buildings belonging to blocks of the four levels are shown in Table 1.
Counts L1 L2 L3 L4 Total
Blocks 120 120 120 121 481
(25%) (25%) (25%) (25%)
Buildings 3145 4919 3442 2248 13754 (22.9%) (35.8%) (25.0%) (16.3%)
Table 1. Block and building counts for the four block FAR levels.
Although the four block FAR levels have almost the same block counts, they had different buildings counts. The building count is not so important however for determining the block FAR level as FAR calculations involve building heights rather than building counts alone. The four block FAR levels were compared in three ways: building height value distribution, building height error distribution, and block FAR error distribution.
3.5.1 Building Height Distribution Comparison: As shown
in Figure 7, the four block FAR levels vary in building height value distribution. In general, building heights increased when the block FAR level increases. Most buildings lower than 14 meters were in the low and moderate block FAR levels; L1, L2, and L3, while almost all buildings higher than 30 meters were in the high block FAR level, L4. The maximum frequency of building heights increased with the increase in block FAR levels: 6 meters for block FAR level L1, 10 meters for the levels L2 and L3, 12 meters for the level L4. Among the four block FAR levels, the level L2 had the largest building count (about 1400) when the maximum frequency of building height (10 meters) was achieved.
Figure 7. Building height distribution comparison among four block FAR levels.
3.5.2 Building Height Error Distribution Comparison: As
shown in Figure 8, the four block FAR levels vary in building height error distribution. Most buildings with height errors close to zero were in the low and moderate block FAR levels; L1, L2, and L3, while almost all buildings with height errors larger than 10 meters were in the high block FAR level, L4. The moderate level L3 had more buildings with negative large height errors in comparison to the low levels, L1 and L2. Among the four block FAR levels, the level L2 had the largest building count (about 1500) when the maximum frequency of building height error (around zero) was achieved.
Figure 8. Building height error distribution comparison among four block FAR levels.
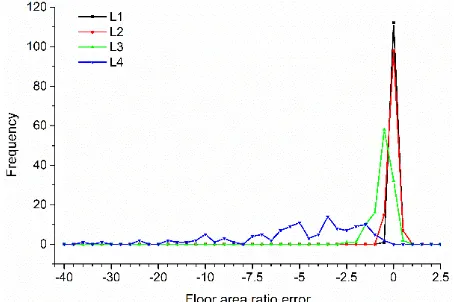
3.5.3 Block FAR Error Distribution Comparison: As
shown in Figure 9, four block FAR levels vary in block FAR
Figure 9. Block FAR error distribution comparison among four block FAR levels.
3.5.4 Correlation Between Building Height Errors and Block FAR Errors: It can be seen from Figures 8 and 9 that the
block FAR error distribution and the building height error distribution have a similar trend. Blocks with high FAR values, such as blocks in the block FAR level L4, often have large errors due to large building height errors for high buildings in the blocks. Blocks with low FAR values, such as blocks in the block FAR levels L1 and L2, often have small errors due to small building height errors for low buildings in the blocks. Blocks with moderate FAR values, such as blocks in the block
FAR level L3, often have moderate errors due to moderate building height errors for buildings in the blocks.
Block FAR accuracy is also influenced by the total count of buildings in the block. As seen in Figures 7 and 8, the block FAR levels L1 and L2 have different building height error distributions, and different total building counts. However, most buildings in both the block FAR levels L1 and L2 had small height errors; hence, most blocks in both two block FAR levels had small FAR errors. Therefore, they have a similar block FAR error distribution, shown in Figure 9.
4. CONCLUSION
Our study investigated the impact of building heights on 3D urban density, the frequently used Floor Area Ratio (FAR), estimation from spaceborne stereo imagery. Two 2D reference data sets, including building footprints and land use blocks, were used in order to avoid the errors inherent to planar information extracted from remotely sensed imagery. Our experimental results show that underestimation of building heights was related to underestimation of the FAR, a popular 3D density indicator in the whole study area. In local areas, experimental results show that land use blocks with low FAR values often have small errors due to small building height errors for low buildings in the blocks; and blocks with high FAR values often have large errors due to large building height errors for high buildings in the blocks. Our study reveals that the accuracy of 3D density estimated from spaceborne stereo imagery is correlated to heights of buildings in a scene; therefore building heights must be considered when spaceborne stereo imagery is used to estimate 3D density to improve precision.
ACKNOWLEDGMENT
The work was supported by the National Key Basic Research and Development Program of China under Grant 2012CB719906, and the National Science and Technology Major Project on High Resolution Earth Observation Systems under Grant 07-Y30B10-9001-14/16. Special thanks are given to the data providers: CNES for the provision of the Pleiades-Salepci, N., Hese, S., Schmullius, C., Tao, J., Auer, S., Bamler, R., Ewald, K., Gartley, M., Jacobson, J., Buswell, A., Du, Q., Pacifici, F., 2013. Multi-Modal and Multi-Temporal Data Fusion: Outcome of the 2012 GRSS Data Fusion Contest. IEEE Journal of Selected Topics in Applied Earth Observations and Remote Sensing 6, 1324-1340.
Brunn, A., Weidner, U., 1997. Extracting Buildings From Digital Surface Models 3D Reconstruction and Modeling of Topographic Objects, Stuttgart, pp. 27-34.
Elwood, S., 2008. Volunteered geographic information: future research directions motivated by critical, participatory, and feminist GIS. GeoJournal 72, 173-183.
Goodchild, M.F., Li, L., 2012. Assuring the quality of volunteered geographic information. Spatial Statistics 1, 110-120.
Haala, N., Kada, M., 2010. An update on automatic 3D building reconstruction. ISPRS Journal of Photogrammetry and Remote Sensing 65, 570-580.
Kajimoto, M., Susaki, J., 2013. Urban Density Estimation From Polarimetric SAR Images Based on a POA Correction Method. IEEE Journal of Selected Topics in Applied Earth Observations and Remote Sensing 6, 1418-1429.
Lemoine, G., Bielski, C.M., Syryczynski, J., 2012. Fast Surface Height Determination Using Multi-Angular WorldView-2 Ortho Ready Urban Scenes. IEEE Journal of Selected Topics in Applied Earth Observations and Remote Sensing 5, 80-88.
Licciardi, G.A., Villa, A., Dalla Mura, M., Bruzzone, L., Chanussot, J., Benediktsson, J.A., 2012. Retrieval of the Height of Buildings From WorldView-2 Multi-Angular Imagery Using Attribute Filters and Geometric Invariant Moments. IEEE Journal of Selected Topics in Applied Earth Observations and Remote Sensing 5, 71-79.
OpenStreetMap, 2015. http://www.openstreetmap.org.
Peng, F., Wang, L., Gong, J., Wu, H., 2015. Development of a Framework for Stereo Image Retrieval With Both Height and Planar Features. IEEE Journal of Selected Topics in Applied Earth Observations and Remote Sensing 8, 800-815.
Poli, D., Remondino, F., Angiuli, E., Agugiaro, G., 2015. Radiometric and geometric evaluation of GeoEye-1, WorldView-2 and Pléiades-1A stereo images for 3D information extraction. ISPRS Journal of Photogrammetry and Remote Sensing 100, 35-47.
San, D.K., Turker, M., 2007. Automatic building extraction from high resolution stereo satellite images, Proceedings of ISPRS Conference on Information Extraction from SAR and Optical Data with Emphasis on Developing Countries, Istanbul, Turkey.
Sirmacek, B., Taubenboeck, H., Reinartz, P., Ehlers, M., 2012. Performance Evaluation for 3-D City Model Generation of Six Different DSMs From Air- and Spaceborne Sensors. IEEE Journal of Selected Topics in Applied Earth Observations and Remote Sensing 5, 59-70.
Susaki, J., Kajimoto, M., Kishimoto, M., 2014. Urban density mapping of global megacities from polarimetric SAR images. Remote Sensing of Environment 155, 334-348.
Tian, J., Cui, S., Reinartz, P., 2014. Building Change Detection Based on Satellite Stereo Imagery and Digital Surface Models. IEEE Transactions on Geoscience and Remote Sensing 52, 406-417.
Toutin, T., 2004. Comparison of stereo-extracted DTM from different high-resolution sensors: SPOT-5, EROS-a, IKONOS-II, and QuickBird. IEEE Transactions on Geoscience and Remote Sensing 42, 2121-2129.
Wurm, M., d Angelo, P., Reinartz, P., Taubenbock, H., 2014. Investigating the Applicability of Cartosat-1 DEMs and Topographic Maps to Localize Large-Area Urban Mass Concentrations. IEEE Journal of Selected Topics in Applied Earth Observations and Remote Sensing 7, 4138-4152.
Yu, B., Liu, H., Wu, J., Hu, Y., Zhang, L., 2010. Automated derivation of urban building density information using airborne LiDAR data and object-based method. Landscape and Urban Planning 98, 210-219.
Zeng, C., Wang, J., Zhan, W., Shi, P., Gambles, A., 2014. An elevation difference model for building height extraction from stereo-image-derived DSMs. International Journal of Remote Sensing 35, 7614-7630.