THE USE OF UAS FOR RAPID 3D MAPPING IN GEOMATICS EDUCATION
Tee-Ann Teoa, Peter Tian-Yuan Shihb*, Sz-Cheng Yuc, Fuan Tsaid
a Dept. of Civil Engineering, National Chiao Tung University, Hsinchu, Taiwan 30010 - [email protected] b Dept. of Civil Engineering, National Chiao Tung University, Hsinchu, Taiwan 30010 - [email protected] c Dept. of Civil Engineering, National Chiao Tung University, Hsinchu, Taiwan 30010 - [email protected] d Center for Space and Remote Sensing Research, National Central University, Taoyuan, Taiwan 32001 -
Commission VI
KEY WORDS: Unmanned Aerial Vehicle, Rapid Mapping, Education
ABSTRACT:
With the development of technology, UAS is an advance technology to support rapid mapping for disaster response. The aim of this study is to develop educational modules for UAS data processing in rapid 3D mapping. The designed modules for this study are focused on UAV data processing from available freeware or trial software for education purpose. The key modules include orientation modelling, 3D point clouds generation, image georeferencing and visualization. The orientation modelling modules adopts VisualSFM to determine the projection matrix for each image station. Besides, the approximate ground control points are measured from OpenStreetMap for absolute orientation. The second module uses SURE and the orientation files from previous module for 3D point clouds generation. Then, the ground point selection and digital terrain model generation can be archived by LAStools. The third module stitches individual rectified images into a mosaic image using Microsoft ICE (Image Composite Editor). The last module visualizes and measures the generated dense point clouds in CloudCompare. These comprehensive UAS processing modules allow the students to gain the skills to process and deliver UAS photogrammetric products in rapid 3D mapping. Moreover, they can also apply the photogrammetric products for analysis in practice.
1. INTRODUCTION
Unmanned Aerial System (UAS) is a term used to represent an uninhabited and reusable motorized aerial vehicle that are remotely controlled, semi-autonomous and autonomous (Eisenbeiss, 2011). It was firstly developed during World War I for military purpose. With the development of technology, UAS is not only applied to military purpose but is also used for many civilian applications such as topographic mapping, disaster relief, environmental monitoring and others. To meet the requirements of different applications, different types of UAS have been developed, for example, fixed-wing UAS and multi-copters UAS. The fixed-wing UAS is similar to airplane, and is usually used in the wide range monitoring; while multi-copters UAS is similar to helicopter, it tends to do the small range investigation. Apart from the above types, other UASs (i.e., balloon, kite and so on) also have their unique features and applications
Nowadays, UAS draws the increasing attention in various domains and disciplines. During the emergency response, geospatial data plays an important role for decision support system (Tampubolon and Reinhardt, 2015). The traditional data resources such as satellite images and aerial images have high-cost and they are unable to get the timely information for analysis. They will slow down the decision-making processes and unable to control the timely situation. With the development of UAS’s technology, the rapid mapping by UAS
technology for disaster response can overcome the shortcomings of traditional ways. UAS has several advantages such as high flexibility, low-cost, weatherproof, timely acquisition and so forth. Also, it can collect very high spatial resolution images and 3D point clouds as well. All of them can be utilized to support the decision-making processes. Besides, the Humanitarian UAV Network (http://uaviators.org/) also demonstrates the capability of using UAS in emergency response. Therefore, the development of rapid mapping using UAS for disaster response is an important trend.
The development of UAS is not only accelerating the data acquisition but also increase the needs of photogrammetry in academic and commercial applications. Hence the ability to operate a UAS is a desirable skill in the job market and in the world of science. Jeziorska (2014) proposed the syllabus for UAS course including introduction, flight preparation, flight, processing data and interpretation of results. This newly course gives students an opportunity to learn a series of procedures for UAS’s application. Most importantly, it also allows students to extend skills and to enhance the competitiveness in the job market (Jeziorska, 2014). On the other hand, some companies also provide online learning materials for UAS data processing. For example, UAS Mapping Post Processing Tutorial (https://www.youtube.com/watch?v=wBKidr0e-XA,
model (DSM) and so forth. Thus, we can see that learning the relevant skills of UAS has become important.
According to the above backgrounds, we can find that more and more applications use the spatial data acquired from UAS; on the other hand, the relevant abilities to operate a UAS also draws the increasing attention. Thus, combining these two conclusions, our study would like to develop educational modules for UAS data processing from available freeware or trial software systematically. Meanwhile, the background of the curriculum is designed in rapid 3D mapping for emergency response by using UAS acquired data.
2. TEACHING PROGRAM
The concept of the proposed educational modules is based on the crisis map by crowdsourcing for disaster response. Nowadays, more and more journalists are using small UASs during disasters. By crowdsourcing the collection of aerial footage, they can be used to augment the damage assessments and situational awareness (iRevolutions, 2014). Thus, the objective of our study is to establish some learning materials to support the need of crowdsourcing for UAS mapping.
As the processing time is the critical issue in rapid mapping, crowdsourcing by volunteer is needed. In order to do the rapid 3D mapping from UAS imagery, getting familiar with UAS post-processing is necessary. However, the data processing of UAS still has a variety of procedures that needs to be understood in advance. We assume that, the UAS data is acquired by professional team and this study only focus on UAS data processing. On the other hand, there are several teaching materials that have been applied in the modules. All of them are available freeware or trial software including VisualSFM, SURE, LAStools, Microsoft Image Composite Editor (ICE) and CloudCompare. Therefore, students is able to download these tools from the internet for UAS data processing in rapid mapping. Notice that the UAS data acquisition is not included. For educational purpose, the UAS test images can also be downloaded from the several websites.
3. COURSE MODULES
3.1 Overview
The overall course objective is getting familiar with UAS post-processing. The key modules include five processes, depicted in Figure 1. Each of them has their own work to do and the methods and tools to be used are not the same. In the first stage, VisualSFM is adopted to determine the orientation parameters for each image. After that, SURE and the orientation file are used for generating 3D point clouds. Then, the ground point selection and digital elevation model (DEM) generation are archived by LAStools. Later, stitching individual rectified images into a mosaic image is operated in image georeferencing process by using Microsoft ICE. Lastly, the generated dense point clouds are used for visualization and measurement in CloudCompare. Moreover, point clouds from individual image block can be merged via CloudCompare. Table 1 presents the overall curriculum of these modules, and the outline for each process is also described.
Figure 1. Main processes of proposed educational modules
Table 1. Overall curriculum of educational modules Modules
Tasks and learning objectives Process Tool
Determining the orientation parameters for each image station.
1. Computing missing pairwise matches. 2. Running full 3D reconstruction. 3. Computing bundle adjustment. 4. Running dense reconstruction.
3D
Generating 3D point clouds.
1. Analyzing orientations of UAS data. 2. Generating dense point clouds. 3. Generating DSM.
4. Running cloud filter. 5. Meshing the generated model.
D
ls Selecting ground point and generating DEM.
1. Merging all the point clouds. 2. Classifying ground points. 3. Generating DEM model.
Im
1.Generating rectified images.
M
1. Stitching individual rectified images into a mosaic image.
V
Displaying the generated products. 1. 3D point clouds.
2. Ground points. 3. Mosaicked image.
3.2 Learning Materials
there was a gas explosion happened in Kaohsiung City, Taiwan. It caused serious damage at Yixin Road, Sanduo Road and Kaixuan Road. A few days later, National University of Kaohsiung used UAS to acquire data in the disaster area and released the data set (http://140.127.218.152) under Creative Commons licenses. The camera was RICOH GRD4 with 6mm focal and image size was 2736 x 3648 pixels. The flying height was about 150m. Table 2 summarized the related information of the UAS data. Besides, Humanitarian UAV Network (http://uaviators.org) also provided the links of UAS data (e.g. video of disaster area from UAS) in the website.
Table 2. Related information of educational test data
File name File size Number determine the projection matrix for each image station. This process refers to the process of estimating 3D structures from 2D image sequences (Wikipedia, 2016). SfM extracts and tracks the Scale- Invariant Feature Transform (SIFT) (Lowe, 1999) characteristics in images and estimate the geometric relationship through the changes of characteristics in the continuous images. At the same time, it also computes the relevance of characteristics between images and reconstructs the 3D structured model. Because of the successful 3D reconstruction, this technique has been widely used.
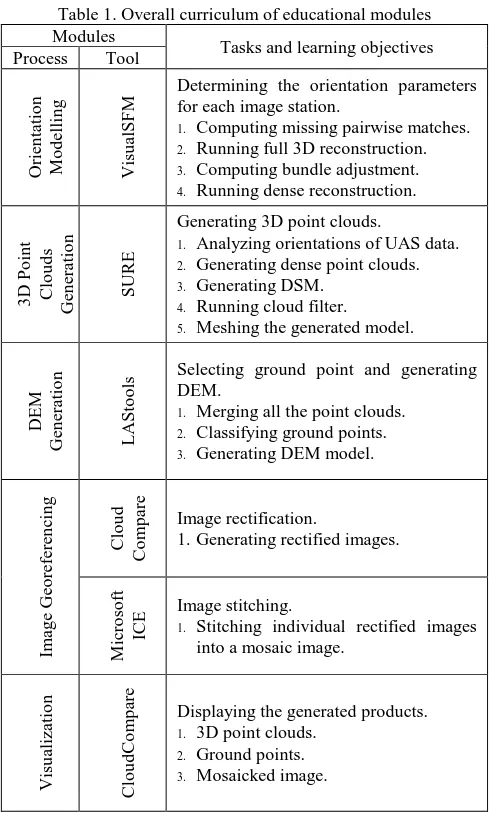
VisualSFM (http://ccwu.me/vsfm) is a freeware for 3D reconstruction using structure from motion (Wu, 2011). It includes feature detection, feature matching, bundle adjustment and dense reconstruction. Moreover, it can also export the NView Match file (*.nvm) to record the orientation parameters for further applications. Figure 2 shows the input data and the output NView Match file by VisualSFM.
Once the UAS images are downloaded, the procedure of VisualSFM consists of the following steps:
Import multiple images that would like to determine the project matrix.
Perform the SIFT image matching by “Compute Missing Matches”.
Build-up the relation between stations by “Compute 3D reconstruction”.
Do the “bundle adjustment” for the reconstructed model. Convert the reconstructed model from relative coordinate
to world mapping system. We measure at least four ground control points (GCP) manually from OpenStreetMap (http://www.openstreetmap.org) and perform the absolute transformation by “GCP-based Transform”. The accuracy of transformation is listed on the log window. The GCP measurement is a time consuming process. One of the possibilities to accelerate this process is the “GPS-based Transformation”. It uses the GPS in EXIF header for 3D similarity transformation.
The output object coordinate is WGS84 in longitudes and latitudes.
Run “CMVS” dense reconstruction for the following image mosaicking process (section 3.6).
Save the “NView Match” (NVM) file for the next process. All the calculated orientation parameters are saved in NVM file.
(a) Import UAS images
(b) Export NView Match file Figure 2. User interface of VisualSFM
3.4 3D Point Clouds Generation
In the second modular, we use Semi-Global Matching (SGM) (Hirschmüllerm, 2011) technique to generate dense 3D point clouds. SGM combines the ideas of global and local stereo methods for accurate, pixel-wise matching at a low runtime. By selecting the disparity of each pixel to form the disparity map and setting up a related global cost function, the aim of SGM is to minimize the function and solve the optimize disparity. This dense point matching has several advantages, for example, real-time capability and preserve disparity discontinuities. As the UAS usually provides highly overlapped multi-view images, SGM is usually selected for dense 3D point generation.
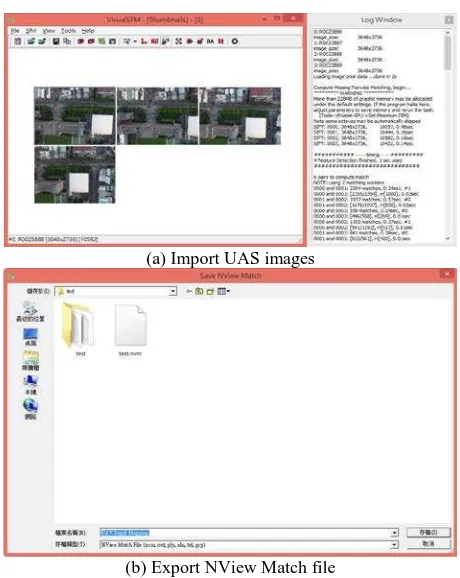
SURE (http://nframes.com) is a software using SGM (Rothermel et al., 2012). We use the trial version with full function in this module to generate 3D point clouds. It is a multi-stereo solution that is able to derive dense point clouds from a given set of images (e.g. multi-view UAS images) and its orientations (e.g. NVM file from VisualSFM). These orientations can be calculated from other approaches (e.g. VisualSFM). After importing the NView Match file, 3D point clouds can be generated through the following steps:
Import the orientation file (*.nvm) which is calculated from the previous module.
Enable every procedure including analysis, dense cloud, DSM, cloud filter and mesh.
coloured points are saved in ASPRS LAS format and can be visualized in CloudCompare (section 3.6).
Figure 3. Operation in SURE
3.5 DEM Generation
LAStools (http://rapidlasso.com/lastools) is a lidar processing suite that we use in the third module. It is a collection of tools and each of them is designed for lidar data. For example, merging all point clouds into one file, classifying ground points and interpolating DEM model. Since it is highly efficient and is heavily used in different domains, we use LAStools for ground point selection and DEM generation. LAStools is not freeware but it can be used freely for non-profit educational or non-profit humanitarian purposes without license.
(a) Merging point clouds in las2las
(b) Generating DEM model in las2dem Figure 4. Operation in LAStools
The point clouds generated from SURE include ground points and surface points. In this study, the DSM is generated by SURE and the DEM is generated by LAStools. The lasground is a Triangulated Irregular Network TIN-based ground point selection. The idea of TIN-based ground point selection is to create an initial ground surface by seed ground points. Then, repeatedly examine every unclassified point on each triangle with the predefined threshold, and construct a new TIN using classified ground points iteratively (Yang and Li, 2012).
In this process, we use las2las, lasground and las2dem in LAStools to achieve our goals. Figure 4 shows the interface of las2las and las2dem. The standard operation procedure is listed as below:
In las2las, merging all the point clouds (*.las) into one single file.
In lasground, classifying ground and non-ground points in point clouds. Notice that, the point coordinates should be map projection coordinate system (e.g. UTM). The geographic coordinate system (i.e. longitude and latitude) is not suitable for this function.
In las2dem, generating DEM model by predefined size using ground points.
3.6 Image Georeferencing
In this module, we stitch individual rectified images into a mosaic image by using CloudCompare (http://www.danielgm.net/cc) and Microsoft ICE (http://research.microsoft.com/en-us/um/redmond/projects/ice). CloudCompare is a 3D point clouds and triangular mesh data processing software. It has many advanced algorithms including resample, statistics computation and segmentation. Moreover, it can generate rectified images by CMVS files (section 3.2). On the other hand, Microsoft ICE is a panoramic image stitcher to create a high-resolution panorama image from a set of overlapping photographs. Due to the quality and performance, Microsoft ICE is a good choice for stitching the rectified images.
(a) Visualization of coloured points in CloudCompare
In this process, we firstly use CloudCompare to generate the rectified images from CMVS files, then, stitching them into mosaic image using Microsoft ICE. Figure 5 shows the coloured point clouds in CloudCompare and stitching process in Microsoft ICE. Two major steps are listed as below:
In CloudCompare, importing CMVS files (fromVisualSFM) to generate rectified images.
In Microsoft ICE, stitching rectified images into a mosaic image by importing rectified images. Notice that, the mosaicked image from Microsoft ICE does not have world coordinate, we have to create a world file for mosaicked image manually.
3.7 Visualization
The last module is to visualize the dense 3D point clouds (section 3.4), ground points (section 3.5), and mosaicked image (section 3.6) in CloudCompare. The CloudCompare can be used in the visualization and measure of 3D point clouds, triangular mesh data and 2D orthoimage. Therefore, in the last process, we use CloudCompare to integrate different produces.
4. OUTCOME AND EVALUATION
After finishing all the processes, the final products include 3D point clouds, DEM and mosaicked image. All of them can be displayed in CloudCompare (Figure 6). We also examined the computation time in each process (Table 3). Notice that the OS adopted to calculate was Windows 8.1, 64-bit, the CPU was Intel Core i5-4460, 3.20 GHz, the graphics card was NVIDIA GeForce GTX 550 Ti, and the RAM was 8GB. The input data include 4 UAS images. In Table 3, we can see that all of the software can process data at low runtime except dense matching. That is because dense cloud generation needs to consume large amounts of efficiency of computer, it will spend more time to process. The computational time is accepted for educational purpose. These modules have been successfully adopted in the Remote Sensing course in NCTU, Taiwan. The students were able to process UAS images via the designed teaching program.
Table 3. Computational time for 4 overlapped UAS images
Tool Process Time
VisualSFM Orientation modelling 5min
SURE Dense point matching 20min
LAStools DEM generation 5min
CloudCompare Image rectification 5min Microsoft ICE Image stitching 10min
Total 45min
5. CONCLUSIONS
As the UAS draws the increasing attention in various domains, the UAS photogrammetry plays an important role in educational and commercial applications. The aim of this study is to develop educational modules for UAS data processing in rapid 3D mapping for disaster response. From the results, we can see that the UAS data can be used to generate various product including 3D point clouds, DEM and mosaicked image, and all of them can be generated by the proposed procedure. This newly modules will give students an ability to master the skills of processing and delivering UAS photogrammetric products in rapid 3D mapping as well as applying them for analysis in the practice.
(a) 3D point clouds
(b) Ground points
(c) Mosaicked image
Figure 6. Visualization in CloudCompare
REFERENCES
Eisenbeiss, H., 2011. Tutorial UAV-g Introduction. International Conference on Unmanned Aerial Vehicles in Geomatics. Zurich, Switzerland.
Hirschmüller, H., 2011. Semi-Global Matching - Motivation, Developments and Applications. Photogrammetric Week ’11. Dieter Fritsch (Ed.), pp. 173-184.
iRevolutions, 2014. Crowdsourcing a Crisis Map of UAV/Aerial Videos for Disaster Response, http://irevolutions.org/2014/06/18/crowdsourcing-a-crisis-map-of-uavaerial-videos-for-disaster-response/ (23 Feb. 2016).
Jeziorska, J., 2014. Unmanned Aerial Vehicle – A Tool for Acquiring Spatial Data for Research and Commercial Purposes. New Course in the Geography and Cartography Curriculum in Higher Education. The International Archives of the Photogrammetry, Remote Sensing and Spatial Information Science. Vol. XL. Part 6, pp. 37-42.
Rothermel, M., Wenzel, K., Fritsch, D. and Haala, N., 2012. SURE: Photogrammetric Surface Reconstruction from Imagery. LC3D Workshop. Berlin, Germany.
Tampubolon, W. and Reinhardt, W., 2015. UAV Data Processing for Rapid Mapping Activities. The International Archives of the Photogrammetry, Remote Sensing and Spatial Information Science. Vol. XL. Part 3/W3., pp. 371-377.
Wikipedia, 2016. Structure from motion, https://en.wikipedia.org/wiki/Structure_from_motion (1 Mar. 2016).
Wu, C., 2011. VisualSFM: A Visual Structure from Motion System, http://ccwu.me/vsfm/ (1 Mar, 2016).