DAFTAR PUSTAKA
1. Nurdjanah S. Sirosis hati. Dalam: Sudoyo WA, Setiyohadi B, Alwi I, et al,
editor. Buku ajar ilmu penyakit dalam jilid I. Edisi keempat. Jakarta: Pusat
Penerbitan Departemen Ilmu Penyakit Dalam FK UI, 2007.
2. Thorn, Adams, Braunwald, Isselbacher, & Petersdorf. Harrison's Principles of
Internal Medicine. Edisi IX. Jakarta Utara: Penerbit Buku Kedokteran; 1991.
3. The Global Burden Of Deseases 2004 [database on the internet]. WHO. 2008
[cited 16 November 2013]. Available from: www.who.int/evidence/bod.
4. Liver cirrhosis mortality rates in Britain from 1950 to 2002 an analysis of
routine data [database on the internet]. Leon,D. 2006 [cited 2 Desember
2013]. Available from: http:// www.thelancet.com.
5. Statistics About Liver of Cirrhosis [database on the internet]. NCHS. 2003
[cited
5
November
2013].
Available
from:
http://www.wrongdiagnosis.com/c/cirrhosis_of_the_liver/stats.htm.
6. National Vital Statistics Reports [database on the internet]. Xu dkk. 2010
[cited
16
Desember
2013].
Available
from:
http://www.cdc.gov/nchs/data_access/Vitalstatsonline.htm.
7. Muttaqin, A., & Sari, K. Gangguan Gastrointestinal. Jakarta: Penerbit
Salemba Medika; 2011.
8. Farrell, G. C., 2008, Cirrhosis in Asians: Less common than in Europeans
Journal of Gastroenterology and Hepatology, Volume 23, Issue 4, pages 508–
511 http://onlinelibrary.wiley.com/doi.
9. Kusumobroto O Hernomo. Sirosis Hati dalam buku ajar Ilmu Penyakit Hati.
Edisi I. Jakarta: Jayabadi; 2007.
10. Karina. Faktor Risiko Kematian Penderita Sirosis Hati Di RSUP Dr. Kariadi
Semarang Tahun 2002–2006, Jurnal Media Medika Muda [internet]. 2007
[cited
2014
Maret
11].
Available
from:
http://eprints.undip.ac.id/view/divisions/sch=5Fmed/2007.html#group_K.
11. Sulaiman A. Gasrtoenterologi Hepatologi. Jakarta: CV. Sagung Seto; 1997.
12. Global Burden of Viral Hepatitis [database on the internet]. WHO Geneva.
2010
[cited
12
Desember
2013].
Available
from:
http://
www.who.int/evidence/bod.
13. Hepatitis B and HIV Coinfecton Clinical Protocol [database on the internet].
WHO European Region. 2010 [cited 16 Desember 2013].
14. Laporan Hasil Riset Kesehatan Dasar RISKESDAS Indonesia [database on
the internet]. Departemen Kesehatan. 2007 [ cited 2 Januari 2014].
15. Profil Kesehatan 2008 [database on the internet]. Departemen Kesehatan.
2009 [cited 2 Januari 2014]. Available from: http//www.depkes.go.id .
16. Setiawati, M. Perbandingan Validitas Maddrey’s Discriminant Function dan
Skor Child-Pugh dalam Memprediksi Ketahanan Hidup 12 Minggu pada
Pasien Sirosis Hepatis. Semarang: Fakultas Kedokteran Universitas
Diponegoro; 2009.
17. Deep vein thrombosis in patient with cirrhosis [database on the internet].
Lesmana, dkk. 2009 [cited 16 Januari 2014]. Available from:
http://www.who.int/research/en.
18. Simamora, C. T. Hubungan Komplikasi, Skor Child-Turcotte dan Usia Lanjut
Sebagai Faktor Resiko Kematian Pada Pasien Sirosis Hati di RSUD Dr.
Soedarso Pontianak. Pontianak; 2013.
19. Malau, A. S. Karakteristik Penderita Sirosis Hati Yang Dirawat Inap Di
Rumah Sakit Martha Friska Medan Tahun 2006-2010. Medan; 2011.
20. Report of The Regional Committee for the Eastern Mediterranean Fifty-sixth
Session Fez, Morocco 5–8 October 2009 [database on the internet]. Mohsni.
2009 [cited 6 Pebruari 2014]. Available from: http://search.who.int/.
21. Statistics by Country for Cirrhosis of the liver [database on the internet]. US
Census Bureau, International Data Base. 2005 [cited 11 Januari 2014].
Available from:
http://www.cureresearch.com/c/cirrhosis_of_the_liver/stats-country_ printer.htm.
22. Ndraha. The Indonesian Journal of Gastroenterology, Hepatology, and
Digestive Endoscopy. Volume 10, Number 3; 2009.
24. Liver cirrhosis–Epidemiological and Clinical Aspects Department of Internal
Medicine Sahlgrenska University Hospital, Goteborg University, Sweden
[database on the internet]. Gunnarsdottir. 2008 [cited 3 Pebruari 2014].
Available from:
www.gupea.ub.gu.se/bitstream/2077/10132/1/Ramen-Avh-SAG.pdf.
25. Rasyid. Temuan Ultrasonografi Kanker Hati Hepatoseluler Hepatoma.
Majalah Kedokteran Nusantara. Volume 39 No 2; 2006.
26. Sulaiman A. Harapan Baru Dalam Penatalaksanaan Sirosis Hati, Dalam
Pertemuan Ilmiah Tahunan Perkembangan Muktahir Ilmu Penyakit Dalam.
Jakarta: Balai Penerbit FK UI; 2003.
27. Death Rates [database on the internet]. WHO. 2004 [cited 8 Pebruari 2014].
Available from: http://www.who.int.
28. Studi Penggunaan Obat Pada Pasien Sirosis Hepatik [database on the internet].
Rencianisari.
2008
[cited
4
Pebruari
2014].
Available
from:
http://adln.lib.unair.ac.id/go.php?id=gdlhub-gdl-s1-2011-.
29. Percentage of total deaths, death rates, age-adjusted death rates for 2007,
percentage change in age-adjusted death rates in 2007 from 2006, and ratio of
age-adjusted death rates, by race and sex for the 15 leading causes of death
for the total population in 2007 [database on the internet]. National Vital
Statistics Reports. 2010 [cited 15 Pebruari 2014]. Available from:
http://www.cdc.gov/nchs.
30. Avunduk, C. Manual of Gastroenterology Diagnosis and Therapy. Edisi IV.
Philadelphia: Lippincott Williams & Wilkins; 2008.
31. Sherlock S, Dooley J. Disease of the liver and biliary system. Edisi IX.
Oxford: Blackwell Scientific Publications, 1993: 357-67.
32. Rigas B, Spiro HM. Clinical Gastroenterology: companion book. Edisi IV.
New York: Mc Graw Hill, 1995: 588-611.
33. Global Burden of Diseases in 2002 [database on the internet]. WHO Global.
2008 [cited 9 Pebruari 2014]. Available from: http://www.wpro.who.int.
34. Arguedes MR, Fallon MB. Cirrhosis of the liver and its complications. In:
Carpenter CCJ, Griggs RC, Loscalzo J, editors. Cecil essentials of medicine.
Edisi XI. Pennsylvania: Saunders, 2004: 411-7.
35. Price S.A. Patofisiologi konsep Klinis Proses-proses Penyakit, Edisi VI.
Jakarta: EGC; 2006.
36. Kayacetin E, Efe D, Dogan C. Portal and splenic hemodynamics in cirrhotic
patients: relationship between esophageal variceal bleeding and the severity
of hepatic failure. Journal of Gastroenterology, 2004; 39: 661-7.
37. Friedman SL, McQuaid KR, Grendell JH. Current diagnosis and treatment in
gastroenterology. 2nd ed. New York: Mc Graw Hill, 2003: 644-62.
38. Porth CM. Pathophysiology: concepts of altered health states. 5th ed.
Philadelphia, 1998: 761-6.
39. Weiss GR. Clinical oncology. Connecticut: Appleton & Lange; 1993.
40. Cardenas A, Arroyo V. Mechanism of water and sodium retension in
cirrhosis and the phatogenesis of ascites. Best Pract Res Clin Endokrinol
Metab 2003; 17: 607-22.
41. Cheney CP, Goldberg EM, Chopra S. Cirrhosis and portal hypertension: an
overview. In: Friedman LS, Keeffe EB, editors. Handbook of liver disease.
2nd ed. China: Churchill Livingstone, 2004: 125-37.
42. Gilroy J. Basic neurology. 3rd ed. New York: Mc Graw Hill, 2000: 517-8.
43. Hassan HA. Spontaneous Bacterial Peritonitis. Dalam: Adi S, editor. Naskah
lengkap pendidikan kedokteran berkelanjutan XVI. Surabaya: Laboratorium
SMF Penyakit Dalam FK Unair RSUD Dr. Sutomo, 2001: 41-59.
44. Hirlan. Nutrisi enteral dan parenteral pada penderita penyakit hati kronik.
Dalam: Soeroso S, Haryoko W, Setiati TE, Kosim HMS, Triwara B, editor.
Gizi klinik: Nutrisi enteral dan parenteral. Badan Penerbit Universitas
Diponegoro; 1994.
45. Doubatty, AC. 2009. Perbandingan validitas skor mayo end stage liver
disease dan skor child-pugh dalam memprediksi ketahanan hidup 12 minggu
pada pasien sirosis hepatis. Semarang: Universitas Diponegoro.
46. Shibli, AB; Tachauer, A; Mohanty, SR.; 2006, Outpatient Management of
Cirrhosis, Southern Medicaal Journal, 99 (6), 559-561.
47. Clinical profile of patients with cirrhosis of liver in a tertiary carehospital,
Dharan, Nepal [database on the internet]. Maskey R,
Karki P, Ahmed S V
,Manandhar D N. 2011 [cited 3 Maret 2014]. Available from:
http://www.ncbi.nlm.nih.gov/pubmed/22364095.
48. Sarin SK, Chari S, Sundaram KR, Ahuja RK, Anand BS, Broor SL. Young
versus adult cirrhosis: a prospective comparative analysis of the clinical
profile, natural course and survival. Gut 1988; 29: 101-7.
49. Etiology of Liver Cirrhosis in Mexico [database on the internet].
Méndez-Sánchez N, Aguilar-Ramírez JR, Reyes A, Dehesa M, Juárez A, Castañeda B,
et
al.
2004
[cited
22
Juli
2014].
Available
from:
http://new.medigraphic.com/cgibin/resumenMainI.cgi?IDARTICULO=12532.
50. Complications of liver cirrhosis [database on the internet]. Wittenburg H,
Tennert U, Berg T. 2011 [cited 22 Juli 2014]. Available from:
http://europepmc.org/abstract/MED/21611819.
Lampiran 1. Analisis Univariat beberapa Variabel
NPar Tests
Statistics 303 245 259 226 303 2 60 46 79 2 54.17 4.4606 2.3448 8.1827 10.46 54.00 1.9800 2.3000 5.3000 9.00 11.755 5.92105 .60094 12.46432 7.626 16 .11 .90 -.90 0 81 36.31 4.66 106.30 48 Valid Missing N Mean Median St d. Dev iation Minimum MaximumUsia Bilirubin Total
Albumin
serum PPT
Lama perawatan
One-Sample Kolmogorov-Smirnov Test
303 245 259 226 303 54.17 4.4606 2.3448 8.1827 10.46 11.755 5.92105 .60094 12.46432 7.626 .062 .231 .064 .239 .145 .062 .221 .064 .232 .145 -.055 -.231 -.040 -.239 -.101 1.080 3.620 1.023 3.589 2.522 .193 .000 .246 .000 .000 N Mean St d. Dev iation Normal Parametersa,b
Absolute Positiv e Negativ e Most Extreme Dif f erences Kolmogorov -Smirnov Z Asy mp. Sig. (2-tailed)
Usia Bilirubin Total
Albumin
serum PPT
Lama perawatan
Test distribution is Normal. a.
Calculated f rom data. b.
Frequency Table
Jenis kel amin
205 67,7 67,7 67,7 98 32,3 32,3 100,0 303 100,0 100,0 Laki-laki Perempuan Total Valid
Frequency Percent Valid Percent
Cumulat iv e Percent Usia 10 3.3 3.3 3.3 21 6.9 6.9 10.2 79 26.1 26.1 36.3 104 34.3 34.3 70.6 59 19.5 19.5 90.1 30 9.9 9.9 100.0 303 100.0 100.0 < 31 31 - 40 41 - 50 51 - 60 61 - 70 > 70 Total Valid
Frequency Percent Valid Percent
Cumulat iv e Percent HBV 184 60.7 60.7 60.7 119 39.3 39.3 100.0 303 100.0 100.0 Y a Tidak Total Valid
Frequency Percent Valid Percent
Cumulativ e Percent HCV 55 18.2 18.2 18.2 248 81.8 81.8 100.0 303 100.0 100.0 Y a Tidak Total Valid
Frequency Percent Valid Percent
Cumulativ e Percent
NAFL 21 6.9 6.9 6.9 282 93.1 93.1 100.0 303 100.0 100.0 Y a Tidak Total Valid
Frequency Percent Valid Percent
Cumulativ e Percent Alkohol 303 100.0 100.0 100.0 Tidak Valid
Frequency Percent Valid Percent
Cumulativ e Percent Lain-lain 59 19.5 19.5 19.5 244 80.5 80.5 100.0 303 100.0 100.0 Y a Tidak Total Valid
Frequency Percent Valid Percent
Cumulativ e Percent Klasifikasi CHILD-PUGH 15 5,0 6,4 6,4 75 24,8 32,1 38,5 144 47,5 61,5 100,0 234 77,2 100,0 69 22,8 303 100,0 A B C Total Valid Sy stem Missing Total
Frequency Percent Valid Percent
Cumulat iv e Percent
Perdarahan var. Esof 59 19,5 19,5 19,5 244 80,5 80,5 100,0 303 100,0 100,0 Y a Tidak Total Valid
Frequency Percent Valid Percent
Cumulativ e Percent Ensefalopati Hepatikum 66 21,8 21,8 21,8 237 78,2 78,2 100,0 303 100,0 100,0 Y a Tidak Total Valid
Frequency Percent Valid Percent
Cumulativ e Percent Karsinoma Hepatoseluler 34 11,2 11,2 11,2 269 88,8 88,8 100,0 303 100,0 100,0 Y a Tidak Total Valid
Frequency Percent Valid Percent
Cumulativ e Percent Sindr. Hepatorenal 5 1,7 1,7 1,7 298 98,3 98,3 100,0 303 100,0 100,0 Y a Tidak Total Valid
Frequency Percent Valid Percent
Cumulativ e Percent
Hematemesis 79 26,1 26,1 26,1 224 73,9 73,9 100,0 303 100,0 100,0 Y a Tidak Total Valid
Frequency Percent Valid Percent
Cumulativ e Percent Melena 85 28,1 28,1 28,1 218 71,9 71,9 100,0 303 100,0 100,0 Y a Tidak Total Valid
Frequency Percent Valid Percent
Cumulativ e Percent Ascites 224 73,9 73,9 73,9 79 26,1 26,1 100,0 303 100,0 100,0 Y a Tidak Total Valid
Frequency Percent Valid Percent
Cumulativ e Percent
Peritonitis bakterial spontan
1 ,3 ,3 ,3 302 99,7 99,7 100,0 303 100,0 100,0 Y a Tidak Total Valid
Frequency Percent Valid Percent
Cumulativ e Percent Gastropati HT Porta 39 12,9 12,9 12,9 264 87,1 87,1 100,0 303 100,0 100,0 Y a Tidak Total Valid
Frequency Percent Valid Percent
Cumulativ e Percent
Efusi pleura 38 12,5 12,5 12,5 265 87,5 87,5 100,0 303 100,0 100,0 Y a Tidak Total Valid
Frequency Percent Valid Percent
Cumulativ e Percent Pneumonia 37 12,2 12,2 12,2 266 87,8 87,8 100,0 303 100,0 100,0 Y a Tidak Total Valid
Frequency Percent Valid Percent
Cumulativ e Percent TB paru 5 1,7 1,7 1,7 298 98,3 98,3 100,0 303 100,0 100,0 Y a Tidak Total Valid
Frequency Percent Valid Percent
Cumulativ e Percent Syok 7 2,3 2,3 2,3 296 97,7 97,7 100,0 303 100,0 100,0 Y a Tidak Total Valid
Frequency Percent Valid Percent
Cumulativ e Percent
Sepsi s 19 6,3 6,3 6,3 284 93,7 93,7 100,0 303 100,0 100,0 Y a Tidak Total Valid
Frequency Percent Valid Percent
Cumulativ e Percent Penyakit ginjal 10 3,3 3,3 3,3 293 96,7 96,7 100,0 303 100,0 100,0 Y a Tidak Total Valid
Frequency Percent Valid Percent
Cumulativ e Percent Penyakit jantung 3 1,0 1,0 1,0 300 99,0 99,0 100,0 303 100,0 100,0 Y a Tidak Total Valid
Frequency Percent Valid Percent
Cumulativ e Percent Survival rate 60 19,8 19,8 19,8 243 80,2 80,2 100,0 303 100,0 100,0 Meninggal Hidup Total Valid
Frequency Percent Valid Percent
Cumulat iv e Percent Perut membesar 111 36.4 36.4 36.4 194 63.6 63.6 100.0 305 100.0 100.0 Y a Tidak Total Valid
Frequency Percent Valid Percent
Cumulativ e Percent
Nyeri perut 17 5.6 5.6 5.6 288 94.4 94.4 100.0 305 100.0 100.0 Y a Tidak Total Valid
Frequency Percent Valid Percent
Cumulativ e Percent Berak darah 32 10.5 10.5 10.5 273 89.5 89.5 100.0 305 100.0 100.0 Y a Tidak Total Valid
Frequency Percent Valid Percent
Cumulativ e Percent Muntah darah 63 20.7 20.7 20.7 242 79.3 79.3 100.0 305 100.0 100.0 Y a Tidak Total Valid
Frequency Percent Valid Percent
Cumulativ e Percent Badan lemas 15 4.9 4.9 4.9 290 95.1 95.1 100.0 305 100.0 100.0 Y a Tidak Total Valid
Frequency Percent Valid Percent
Cumulativ e Percent Penurunan kesadaran 18 5.9 5.9 5.9 287 94.1 94.1 100.0 305 100.0 100.0 Y a Tidak Total Valid
Frequency Percent Valid Percent
Cumulativ e Percent
Mata kuni ng 13 4.3 4.3 4.3 292 95.7 95.7 100.0 305 100.0 100.0 Y a Tidak Total Valid
Frequency Percent Valid Percent
Cumulativ e Percent Lain2 48 15.7 15.7 15.7 257 84.3 84.3 100.0 305 100.0 100.0 Y a Tidak Total Valid
Frequency Percent Valid Percent
Cumulativ e Percent Ensefalopati 32 10.5 44.4 44.4 40 13.1 55.6 100.0 72 23.6 100.0 233 76.4 305 100.0 grade I-I I grade III -IV Total Valid
Sy stem Missing
Total
Frequency Percent Valid Percent
Cumulat iv e Percent Ascites 180 59.0 80.4 80.4 44 14.4 19.6 100.0 224 73.4 100.0 81 26.6 305 100.0 ringan-sedang berat Total Valid Sy stem Missing Total
Frequency Percent Valid Percent
Cumulat iv e Percent
Lampiran 2. Analisis Bivariat beberapa Variabel terhadap Survival Rate
Jenis kelamin * Survival rate Crosstabul ation
39 166 205 65,0% 68,3% 67,7% 12,9% 54,8% 67,7% 21 77 98 35,0% 31,7% 32,3% 6,9% 25,4% 32,3% 60 243 303 100,0% 100,0% 100,0% 19,8% 80,2% 100,0% Count
% wit hin Surv iv al rate % of Total
Count
% wit hin Surv iv al rate % of Total
Count
% wit hin Surv iv al rate % of Total Laki-laki Perempuan Jenis kelamin Total Meninggal Hidup Surv iv al rate Total
HBV * Survival rate Crosstabul ation 35 149 184 58.3% 61.3% 60.7% 11.6% 49.2% 60.7% 25 94 119 41.7% 38.7% 39.3% 8.3% 31.0% 39.3% 60 243 303 100.0% 100.0% 100.0% 19.8% 80.2% 100.0% Count
% wit hin Surv iv al rat e % of Total
Count
% wit hin Surv iv al rat e % of Total
Count
% wit hin Surv iv al rat e % of Total Y a Tidak HBV Total Meninggal Hidup Surv iv al rate Total
HCV * Survival rate Crosstabul ation
8 47 55 13.3% 19.3% 18.2% 2.6% 15.5% 18.2% 52 196 248 86.7% 80.7% 81.8% 17.2% 64.7% 81.8% 60 243 303 100.0% 100.0% 100.0% 19.8% 80.2% 100.0% Count
% wit hin Surv iv al rat e % of Total
Count
% wit hin Surv iv al rat e % of Total
Count
% wit hin Surv iv al rat e % of Total Y a Tidak HCV Total Meninggal Hidup Surv iv al rate Total
NAFL * Survi val rate Crosstabulation
3 18 21 5.0% 7.4% 6.9% 1.0% 5.9% 6.9% 57 225 282 95.0% 92.6% 93.1% 18.8% 74.3% 93.1% 60 243 303 100.0% 100.0% 100.0% 19.8% 80.2% 100.0% Count
% wit hin Surv iv al rat e % of Total
Count
% wit hin Surv iv al rat e % of Total
Count
% wit hin Surv iv al rat e % of Total Y a Tidak NAFL Total Meninggal Hidup Surv iv al rate Total
Alkohol * Survival rate Crosstabul ation 60 243 303 100.0% 100.0% 100.0% 19.8% 80.2% 100.0% 60 243 303 100.0% 100.0% 100.0% 19.8% 80.2% 100.0% Count
% wit hin Surv iv al rate % of Total
Count
% wit hin Surv iv al rate % of Total Tidak Alkohol Total Meninggal Hidup Surv iv al rate Total
Lain-lain * Survi val rate Crosstabulation
18 41 59 30.0% 16.9% 19.5% 5.9% 13.5% 19.5% 42 202 244 70.0% 83.1% 80.5% 13.9% 66.7% 80.5% 60 243 303 100.0% 100.0% 100.0% 19.8% 80.2% 100.0% Count
% within Surv iv al rate % of Total
Count
% within Surv iv al rate % of Total
Count
% within Surv iv al rate % of Total Y a Tidak Lain-lain Total Meninggal Hidup Surv iv al rate Total
Klasifikasi CHILD-PUGH * Survi val rate Crosstabulation 0 15 15 ,0% 8,2% 6,4% ,0% 6,4% 6,4% 4 71 75 7,7% 39,0% 32,1% 1,7% 30,3% 32,1% 48 96 144 92,3% 52,7% 61,5% 20,5% 41,0% 61,5% 52 182 234 100,0% 100,0% 100,0% 22,2% 77,8% 100,0% Count
% within Surv iv al rate % of Total
Count
% within Surv iv al rate % of Total
Count
% within Surv iv al rate % of Total
Count
% within Surv iv al rate % of Total A B C Klasif ikasi CHI LD-PUGH Total Meninggal Hidup Surv iv al rate Total
Usia * Survival rate
Crosstab 1 9 10 2.0 8.0 10.0 1.7% 3.7% 3.3% .3% 3.0% 3.3% 3 18 21 4.2 16.8 21.0 5.0% 7.4% 6.9% 1.0% 5.9% 6.9% 15 64 79 15.6 63.4 79.0 25.0% 26.3% 26.1% 5.0% 21.1% 26.1% 19 85 104 20.6 83.4 104.0 31.7% 35.0% 34.3% 6.3% 28.1% 34.3% 15 44 59 11.7 47.3 59.0 25.0% 18.1% 19.5% 5.0% 14.5% 19.5% 7 23 30 5.9 24.1 30.0 11.7% 9.5% 9.9% 2.3% 7.6% 9.9% 60 243 303 60.0 243.0 303.0 100.0% 100.0% 100.0% 19.8% 80.2% 100.0% Count Expected Count % wit hin Surv iv al rate % of TotalCount
Expected Count % wit hin Surv iv al rate % of Total
Count
Expected Count % wit hin Surv iv al rate % of Total
Count
Expected Count % wit hin Surv iv al rate % of Total
Count
Expected Count % wit hin Surv iv al rate % of Total
Count
Expected Count % wit hin Surv iv al rate % of Total
Count
Expected Count % wit hin Surv iv al rate % of Total < 31 31 - 40 41 - 50 51 - 60 61 - 70 > 70 Usia Total Meninggal Hidup Surv iv al rate Total Chi-Square Tests 2.604a 5 .761 2.663 5 .752 1.882 1 .170 303 Pearson Chi-Square Likelihood Ratio Linear-by -Linear Association N of Valid Cases Value df Asy mp. Sig. (2-sided)
2 cells (16.7%) hav e expected count less t han 5. The minimum expected count is 1.98.
Efusi pleura * Survival rate
Crosstab 3 35 38 7.5 30.5 38.0 5.0% 14.4% 12.5% 1.0% 11.6% 12.5% 57 208 265 52.5 212.5 265.0 95.0% 85.6% 87.5% 18.8% 68.6% 87.5% 60 243 303 60.0 243.0 303.0 100.0% 100.0% 100.0% 19.8% 80.2% 100.0% Count Expected Count % wit hin Surv iv al rate % of TotalCount
Expected Count % wit hin Surv iv al rate % of Total
Count
Expected Count % wit hin Surv iv al rate % of Total Y a Tidak Ef usi pleura Total Meninggal Hidup Surv iv al rate Total Chi-Square Tests 3.879b 1 .049 3.069 1 .080 4.649 1 .031 .051 .032 3.866 1 .049 303 Pearson Chi-Square Continuity Correctiona Likelihood Ratio Fisher's Exact Test Linear-by -Linear Association N of Valid Cases Value df Asy mp. Sig. (2-sided) Exact Sig. (2-sided) Exact Sig. (1-sided)
Computed only f or a 2x2 table a.
0 cells (.0%) hav e expected count less than 5. The minimum expected count is 7. 52.
Pneumonia * Survival rate
Crosstab 15 22 37 7.3 29.7 37.0 25.0% 9.1% 12.2% 5.0% 7.3% 12.2% 45 221 266 52.7 213.3 266.0 75.0% 90.9% 87.8% 14.9% 72.9% 87.8% 60 243 303 60.0 243.0 303.0 100.0% 100.0% 100.0% 19.8% 80.2% 100.0% Count Expected Count % wit hin Surv iv al rate % of TotalCount
Expected Count % wit hin Surv iv al rate % of Total
Count
Expected Count % wit hin Surv iv al rate % of Total Y a Tidak Pneumonia Total Meninggal Hidup Surv iv al rate Total Chi-Square Tests 11.414b 1 .001 9.975 1 .002 9.780 1 .002 .002 .002 11.377 1 .001 303 Pearson Chi-Square Continuity Correctiona Likelihood Ratio Fisher's Exact Test Linear-by -Linear Association N of Valid Cases Value df Asy mp. Sig. (2-sided) Exact Sig. (2-sided) Exact Sig. (1-sided)
Computed only f or a 2x2 table a.
0 cells (.0%) hav e expected count less than 5. The minimum expected count is 7. 33.
TB paru * Survival rate
Crosstab 0 5 5 1.0 4.0 5.0 .0% 2.1% 1.7% .0% 1.7% 1.7% 60 238 298 59.0 239.0 298.0 100.0% 97.9% 98.3% 19.8% 78.5% 98.3% 60 243 303 60.0 243.0 303.0 100.0% 100.0% 100.0% 19.8% 80.2% 100.0% Count Expected Count % wit hin Surv iv al rate % of TotalCount
Expected Count % wit hin Surv iv al rate % of Total
Count
Expected Count % wit hin Surv iv al rate % of Total Y a Tidak TB paru Total Meninggal Hidup Surv iv al rate Total Chi-Square Tests 1.255b 1 .263 .308 1 .579 2.227 1 .136 .587 .329 1.251 1 .263 303 Pearson Chi-Square Continuity Correctiona Likelihood Ratio Fisher's Exact Test Linear-by -Linear Association N of Valid Cases Value df Asy mp. Sig. (2-sided) Exact Sig. (2-sided) Exact Sig. (1-sided)
Computed only f or a 2x2 table a.
2 cells (50.0%) hav e expected count less than 5. The minimum expected count is . 99.
Syok * Survival rate
Crosstab 7 0 7 1.4 5.6 7.0 11.7% .0% 2.3% 2.3% .0% 2.3% 53 243 296 58.6 237.4 296.0 88.3% 100.0% 97.7% 17.5% 80.2% 97.7% 60 243 303 60.0 243.0 303.0 100.0% 100.0% 100.0% 19.8% 80.2% 100.0% Count Expected Count % wit hin Surv iv al rat e % of TotalCount
Expected Count % wit hin Surv iv al rat e % of Total
Count
Expected Count % wit hin Surv iv al rat e % of Total Y a Tidak Sy ok Total Meninggal Hidup Surv iv al rate Total Chi-Square Tests 29.020b 1 .000 24.081 1 .000 23.359 1 .000 .000 .000 28.925 1 .000 303 Pearson Chi-Square Continuity Correctiona Likelihood Ratio Fisher's Exact Test Linear-by -Linear Association N of Valid Cases Value df Asy mp. Sig. (2-sided) Exact Sig. (2-sided) Exact Sig. (1-sided)
Computed only f or a 2x2 table a.
1 cells (25.0%) hav e expected count less than 5. The minimum expected count is 1. 39.
Sepsis * Survival rate
Crosstab 18 1 19 3.8 15.2 19.0 30.0% .4% 6.3% 5.9% .3% 6.3% 42 242 284 56.2 227.8 284.0 70.0% 99.6% 93.7% 13.9% 79.9% 93.7% 60 243 303 60.0 243.0 303.0 100.0% 100.0% 100.0% 19.8% 80.2% 100.0% Count Expected Count % wit hin Surv iv al rate % of TotalCount
Expected Count % wit hin Surv iv al rate % of Total
Count
Expected Count % wit hin Surv iv al rate % of Total Y a Tidak Sepsis Total Meninggal Hidup Surv iv al rate Total Chi-Square Tests 71.676b 1 .000 66.730 1 .000 55.730 1 .000 .000 .000 71.439 1 .000 303 Pearson Chi-Square Continuity Correctiona Likelihood Ratio Fisher's Exact Test Linear-by -Linear Association N of Valid Cases Value df Asy mp. Sig. (2-sided) Exact Sig. (2-sided) Exact Sig. (1-sided)
Computed only f or a 2x2 table a.
1 cells (25.0%) hav e expected count less than 5. The minimum expected count is 3. 76.
Penyakit ginjal * Survival rate
Crosstab 4 6 10 2.0 8.0 10.0 6.7% 2.5% 3.3% 1.3% 2.0% 3.3% 56 237 293 58.0 235.0 293.0 93.3% 97.5% 96.7% 18.5% 78.2% 96.7% 60 243 303 60.0 243.0 303.0 100.0% 100.0% 100.0% 19.8% 80.2% 100.0% Count Expected Count % wit hin Surv iv al rate % of TotalCount
Expected Count % wit hin Surv iv al rate % of Total
Count
Expected Count % wit hin Surv iv al rate % of Total Y a Tidak Peny akit ginjal Total Meninggal Hidup Surv iv al rate Total Chi-Square Tests 2.657b 1 .103 1.504 1 .220 2.231 1 .135 .114 .114 2.648 1 .104 303 Pearson Chi-Square Continuity Correctiona Likelihood Ratio Fisher's Exact Test Linear-by -Linear Association N of Valid Cases Value df Asy mp. Sig. (2-sided) Exact Sig. (2-sided) Exact Sig. (1-sided)
Computed only f or a 2x2 table a.
1 cells (25.0%) hav e expected count less than 5. The minimum expected count is 1. 98.
Penyakit jantung * Survival rate
Crosstab 0 3 3 .6 2.4 3.0 .0% 1.2% 1.0% .0% 1.0% 1.0% 60 240 300 59.4 240.6 300.0 100.0% 98.8% 99.0% 19.8% 79.2% 99.0% 60 243 303 60.0 243.0 303.0 100.0% 100.0% 100.0% 19.8% 80.2% 100.0% Count Expected Count % wit hin Surv iv al rate % of TotalCount
Expected Count % wit hin Surv iv al rate % of Total
Count
Expected Count % wit hin Surv iv al rate % of Total Y a Tidak Peny akit jantung Total Meninggal Hidup Surv iv al rate Total Chi-Square Tests .748b 1 .387 .019 1 .891 1.331 1 .249 1.000 .515 .746 1 .388 303 Pearson Chi-Square Continuity Correctiona Likelihood Ratio Fisher's Exact Test Linear-by -Linear Association N of Valid Cases Value df Asy mp. Sig. (2-sided) Exact Sig. (2-sided) Exact Sig. (1-sided)
Computed only f or a 2x2 table a.
2 cells (50.0%) hav e expected count less than 5. The minimum expected count is . 59.
Perdarahan var. Esof * Survival rate
Crosstab 7 52 59 11.7 47.3 59.0 11.7% 21.4% 19.5% 2.3% 17.2% 19.5% 53 191 244 48.3 195.7 244.0 88.3% 78.6% 80.5% 17.5% 63.0% 80.5% 60 243 303 60.0 243.0 303.0 100.0% 100.0% 100.0% 19.8% 80.2% 100.0% Count Expected Count % wit hin Surv iv al rate % of TotalCount
Expected Count % wit hin Surv iv al rate % of Total
Count
Expected Count % wit hin Surv iv al rate % of Total Y a Tidak Perdarahan v ar. Esof Total Meninggal Hidup Surv iv al rate Total Chi-Square Tests 2.907b 1 .088 2.319 1 .128 3.197 1 .074 .102 .059 2.897 1 .089 303 Pearson Chi-Square Continuity Correctiona Likelihood Ratio Fisher's Exact Test Linear-by -Linear Association N of Valid Cases Value df Asy mp. Sig. (2-sided) Exact Sig. (2-sided) Exact Sig. (1-sided)
Computed only f or a 2x2 table a.
0 cells (.0%) hav e expected count less than 5. The minimum expected count is 11. 68.
Ensefalopati Hepatikum * Survival rate
Crosstab 41 25 66 13.1 52.9 66.0 68.3% 10.3% 21.8% 13.5% 8.3% 21.8% 19 218 237 46.9 190.1 237.0 31.7% 89.7% 78.2% 6.3% 71.9% 78.2% 60 243 303 60.0 243.0 303.0 100.0% 100.0% 100.0% 19.8% 80.2% 100.0% Count Expected Count % wit hin Surv iv al rate % of TotalCount
Expected Count % wit hin Surv iv al rate % of Total
Count
Expected Count % wit hin Surv iv al rate % of Total Y a Tidak Ensef alopati Hepatikum Total Meninggal Hidup Surv iv al rate Total Chi-Square Tests 95.157b 1 .000 91.781 1 .000 81.663 1 .000 .000 .000 94.843 1 .000 303 Pearson Chi-Square Continuity Correctiona Likelihood Ratio Fisher's Exact Test Linear-by -Linear Association N of Valid Cases Value df Asy mp. Sig. (2-sided) Exact Sig. (2-sided) Exact Sig. (1-sided)
Computed only f or a 2x2 table a.
0 cells (.0%) hav e expected count less than 5. The minimum expected count is 13. 07.
Karsinoma Hepatoseluler * Survival rate
Crosstab 5 29 34 6.7 27.3 34.0 8.3% 11.9% 11.2% 1.7% 9.6% 11.2% 55 214 269 53.3 215.7 269.0 91.7% 88.1% 88.8% 18.2% 70.6% 88.8% 60 243 303 60.0 243.0 303.0 100.0% 100.0% 100.0% 19.8% 80.2% 100.0% Count Expected Count % wit hin Surv iv al rate % of TotalCount
Expected Count % wit hin Surv iv al rate % of Total
Count
Expected Count % wit hin Surv iv al rate % of Total Y a Tidak Karsinoma Hepatoseluler Total Meninggal Hidup Surv iv al rate Total Chi-Square Tests .626b 1 .429 .317 1 .573 .668 1 .414 .502 .296 .624 1 .429 303 Pearson Chi-Square Continuity Correctiona Likelihood Ratio Fisher's Exact Test Linear-by -Linear Association N of Valid Cases Value df Asy mp. Sig. (2-sided) Exact Sig. (2-sided) Exact Sig. (1-sided)
Computed only f or a 2x2 table a.
0 cells (.0%) hav e expected count less than 5. The minimum expected count is 6. 73.
Sindr. Hepatorenal * Survival rate
Crosstab 2 3 5 1.0 4.0 5.0 3.3% 1.2% 1.7% .7% 1.0% 1.7% 58 240 298 59.0 239.0 298.0 96.7% 98.8% 98.3% 19.1% 79.2% 98.3% 60 243 303 60.0 243.0 303.0 100.0% 100.0% 100.0% 19.8% 80.2% 100.0% Count Expected Count % wit hin Surv iv al rate % of TotalCount
Expected Count % wit hin Surv iv al rate % of Total
Count
Expected Count % wit hin Surv iv al rate % of Total Y a Tidak Sindr. Hepatorenal Total Meninggal Hidup Surv iv al rate Total Chi-Square Tests 1.306b 1 .253 .333 1 .564 1.093 1 .296 .258 .258 1.302 1 .254 303 Pearson Chi-Square Continuity Correctiona Likelihood Ratio Fisher's Exact Test Linear-by -Linear Association N of Valid Cases Value df Asy mp. Sig. (2-sided) Exact Sig. (2-sided) Exact Sig. (1-sided)
Computed only f or a 2x2 table a.
2 cells (50.0%) hav e expected count less than 5. The minimum expected count is . 99.
Hematemesis * Survival rate
Crosstab 17 62 79 15.6 63.4 79.0 28.3% 25.5% 26.1% 5.6% 20.5% 26.1% 43 181 224 44.4 179.6 224.0 71.7% 74.5% 73.9% 14.2% 59.7% 73.9% 60 243 303 60.0 243.0 303.0 100.0% 100.0% 100.0% 19.8% 80.2% 100.0% Count Expected Count % wit hin Surv iv al rate % of TotalCount
Expected Count % wit hin Surv iv al rate % of Total
Count
Expected Count % wit hin Surv iv al rate % of Total Y a Tidak Hematemesis Total Meninggal Hidup Surv iv al rate Total Chi-Square Tests .198b 1 .656 .079 1 .779 .196 1 .658 .743 .384 .198 1 .657 303 Pearson Chi-Square Continuity Correctiona Likelihood Ratio Fisher's Exact Test Linear-by -Linear Association N of Valid Cases Value df Asy mp. Sig. (2-sided) Exact Sig. (2-sided) Exact Sig. (1-sided)
Computed only f or a 2x2 table a.
0 cells (.0%) hav e expected count less than 5. The minimum expected count is 15. 64.
Melena * Survival rate
Crosstab 18 67 85 16.8 68.2 85.0 30.0% 27.6% 28.1% 5.9% 22.1% 28.1% 42 176 218 43.2 174.8 218.0 70.0% 72.4% 71.9% 13.9% 58.1% 71.9% 60 243 303 60.0 243.0 303.0 100.0% 100.0% 100.0% 19.8% 80.2% 100.0% Count Expected Count % wit hin Surv iv al rate % of TotalCount
Expected Count % wit hin Surv iv al rate % of Total
Count
Expected Count % wit hin Surv iv al rate % of Total Y a Tidak Melena Total Meninggal Hidup Surv iv al rate Total Chi-Square Tests .141b 1 .708 .046 1 .830 .139 1 .709 .749 .410 .140 1 .708 303 Pearson Chi-Square Continuity Correctiona Likelihood Ratio Fisher's Exact Test Linear-by -Linear Association N of Valid Cases Value df Asy mp. Sig. (2-sided) Exact Sig. (2-sided) Exact Sig. (1-sided)
Computed only f or a 2x2 table a.
0 cells (.0%) hav e expected count less than 5. The minimum expected count is 16. 83.
Ascites * Survival rate
Crosstab 47 177 224 44.4 179.6 224.0 78.3% 72.8% 73.9% 15.5% 58.4% 73.9% 13 66 79 15.6 63.4 79.0 21.7% 27.2% 26.1% 4.3% 21.8% 26.1% 60 243 303 60.0 243.0 303.0 100.0% 100.0% 100.0% 19.8% 80.2% 100.0% Count Expected Count % wit hin Surv iv al rate % of TotalCount
Expected Count % wit hin Surv iv al rate % of Total
Count
Expected Count % wit hin Surv iv al rate % of Total Y a Tidak Ascites Total Meninggal Hidup Surv iv al rate Total Chi-Square Tests .753b 1 .385 .495 1 .482 .777 1 .378 .417 .243 .751 1 .386 303 Pearson Chi-Square Continuity Correctiona Likelihood Ratio Fisher's Exact Test Linear-by -Linear Association N of Valid Cases Value df Asy mp. Sig. (2-sided) Exact Sig. (2-sided) Exact Sig. (1-sided)
Computed only f or a 2x2 table a.
0 cells (.0%) hav e expected count less than 5. The minimum expected count is 15. 64.
Peritonitis bakterial spontan * Survival rate
Crosstab 1 0 1 .2 .8 1.0 1.7% .0% .3% .3% .0% .3% 59 243 302 59.8 242.2 302.0 98.3% 100.0% 99.7% 19.5% 80.2% 99.7% 60 243 303 60.0 243.0 303.0 100.0% 100.0% 100.0% 19.8% 80.2% 100.0% Count Expected Count % wit hin Surv iv al rate % of TotalCount
Expected Count % wit hin Surv iv al rate % of Total
Count
Expected Count % wit hin Surv iv al rate % of Total Y a Tidak Peritonitis bakterial spontan Total Meninggal Hidup Surv iv al rate Total Chi-Square Tests 4.063b 1 .044 .576 1 .448 3.252 1 .071 .198 .198 4.050 1 .044 303 Pearson Chi-Square Continuity Correctiona Likelihood Ratio Fisher's Exact Test Linear-by -Linear Association N of Valid Cases Value df Asy mp. Sig. (2-sided) Exact Sig. (2-sided) Exact Sig. (1-sided)
Computed only f or a 2x2 table a.
2 cells (50.0%) hav e expected count less than 5. The minimum expected count is . 20.
Gastropati HT Porta * Survival rate
Crosstab 5 34 39 7.7 31.3 39.0 8.3% 14.0% 12.9% 1.7% 11.2% 12.9% 55 209 264 52.3 211.7 264.0 91.7% 86.0% 87.1% 18.2% 69.0% 87.1% 60 243 303 60.0 243.0 303.0 100.0% 100.0% 100.0% 19.8% 80.2% 100.0% Count Expected Count % wit hin Surv iv al rate % of TotalCount
Expected Count % wit hin Surv iv al rate % of Total
Count
Expected Count % wit hin Surv iv al rate % of Total Y a Tidak Gastropati HT Porta Total Meninggal Hidup Surv iv al rate Total Chi-Square Tests 1.374b 1 .241 .916 1 .339 1.503 1 .220 .288 .170 1.369 1 .242 303 Pearson Chi-Square Continuity Correctiona Likelihood Ratio Fisher's Exact Test Linear-by -Linear Association N of Valid Cases Value df Asy mp. Sig. (2-sided) Exact Sig. (2-sided) Exact Sig. (1-sided)
Computed only f or a 2x2 table a.
0 cells (.0%) hav e expected count less than 5. The minimum expected count is 7. 72.
Ensefalopati * Survival rate Crosstabulation 5 27 32 12.5% 84.4% 44.4% 6.9% 37.5% 44.4% 35 5 40 87.5% 15.6% 55.6% 48.6% 6.9% 55.6% 40 32 72 100.0% 100.0% 100.0% 55.6% 44.4% 100.0% Count
% within Surv iv al rate % of Total
Count
% within Surv iv al rate % of Total
Count
% within Surv iv al rate % of Total grade I-II grade III-IV Ensef alopati Total Meninggal Hidup Surv iv al rate Total
Ascites * Survival rate Crosstabul ation
36 143 179 76.6% 81.3% 80.3% 16.1% 64.1% 80.3% 11 33 44 23.4% 18.8% 19.7% 4.9% 14.8% 19.7% 47 176 223 100.0% 100.0% 100.0% 21.1% 78.9% 100.0% Count
% wit hin Surv iv al rate % of Total
Count
% wit hin Surv iv al rate % of Total
Count
% wit hin Surv iv al rate % of Total ringan-sedang berat Ascites Total Meninggal Hidup Surv iv al rate Total
Klasifikasi CHILD-PUGH * Survival rate
Tahun * Survival rate Crosstabulation
22 90 112 36.7% 37.0% 37.0% 7.3% 29.7% 37.0% 22 101 123 36.7% 41.6% 40.6% 7.3% 33.3% 40.6% 16 52 68 26.7% 21.4% 22.4% 5.3% 17.2% 22.4% 60 243 303 100.0% 100.0% 100.0% 19.8% 80.2% 100.0% Count
% wit hin Surv iv al rat e % of Total
Count
% wit hin Surv iv al rat e % of Total
Count
% wit hin Surv iv al rat e % of Total
Count
% wit hin Surv iv al rat e % of Total 2010 2011 2012 Tahun Total Meninggal Hidup Surv iv al rate Total Crosstab 0 15 15 .0% 8.2% 6.4% .0% 6.4% 6.4% 4 71 75 7.7% 39.0% 32.1% 1.7% 30.3% 32.1% 48 96 144 92.3% 52.7% 61.5% 20.5% 41.0% 61.5% 52 182 234 100.0% 100.0% 100.0% 22.2% 77.8% 100.0% Count
% within Surv iv al rate % of Total
Count
% within Surv iv al rate % of Total
Count
% within Surv iv al rate % of Total
Count
% within Surv iv al rate % of Total A B C Klasif ikasi CHI LD-PUGH Total Meninggal Hidup Surv iv al rate Total
Chi-Square Tests 26.949a 2 .000 33.354 2 .000 24.502 1 .000 234 Pearson Chi-Square Likelihood Ratio Linear-by -Linear Association N of Valid Cases Value df Asy mp. Sig. (2-sided)
1 cells (16.7%) hav e expected count less t han 5. The minimum expected count is 3.33.
Lampiran 3. Tabel Frekuensi dari beberapa Variabel
Variabel Frekuensi Prosentase
Jenis kelamin Laki-laki 205 67,7 Perempuan 98 32,3 Usia < 31 tahun 10 3,3 31 – 40 tahun 21 6,9 41 – 50 tahun 79 26,1 51 – 60 tahun 104 34,3 61 – 70 tahun 59 19,5 > 70 tahun 30 9,9 Keluhan utama Perut membesar 111 36,4 Nyeri perut 17 5,6 Berak darah 32 10,5 Muntah darah 63 20,7 Badan lemas 15 4,9 Penurunan kesadaran 18 5,9 Mata kuning 13 4,3 Lain2 48 15,7 Etiologi Virus HBV 184 60,7 HCV 55 18,2 HBV dan HCV 17 30,9 Non Virus NAFL 21 6,9 Lain-lain 59 19,5 Klasifikasi CHILD-PUGH A 15 6,4 B 75 32,1 C 144 61,5 Komplikasi
Ensefalopati Hepatikum 66 21,8 Karsinoma hepatoseluler 34 11,2 Sindrom hepatorenal 5 1,7 Hematemesis 79 26,1 Melena 85 28,1 Ascites 224 73,9
Peritonitis bacterial spontan 1 0,3
Gastropati HT Porta 29 12,9 Komorbid Efusi pleura 38 12,5 Pneumonia 37 12,2 TB paru 5 1,7 Syok 7 2,3 Sepsis 19 6,3 Penyakit ginjal 10 3,3 Penyakit jantung 3 1 Ensefalopati Hepatikum Tidak ada 233 76,4 Grade I-II 32 10,5 Grade III-IV 40 13,1 Ascites Tidak ada 81 26,6 Ringan-sedang 180 59 Berat 44 14,4 Survival rate Meninggal 60 19,8 Hidup 243 80,2
Lampiran 4. Tabel Tabulasi Silang Berdasarkan Survival Rate
Variabel
Status
Meninggal Hidup Jumlah
n % n % n % Jenis kelamin Laki-laki 39 65 166 68,3 205 67,7 Perempuan 21 35 77 31,7 98 32,3 Usia < 31 tahun 1 1,7 9 3,7 10 3,3 31 – 40 tahun 3 5 18 7,4 21 6,9 41 – 50 tahun 15 25 64 26,3 79 26,1 51 – 60 tahun 19 31,7 85 35 104 34,3 61 – 70 tahun 15 25 44 18,1 59 19,5 > 70 tahun 7 11,7 23 9,5 30 9,9 Etiologi Virus HBV 35 58,3 149 61,3 184 60,7 HCV 8 13,3 47 19,3 55 18,2 HBV dan HCV 4 50 13 27,7 17 30,9 Non Virus NAFL 3 5 18 7,4 21 6,9 Lain-lain 18 30 41 16,9 59 19,5 Klasifikasi CHILD-PUGH A 0 0 15 8,2 15 6,4 B 4 7,7 71 39 75 32,1 C 48 92,3 96 52,7 144 61,5 Komplikasi
Perdarahan varises esophagus 7 11,7 52 21,4 59 19,5
Ensefalopati hepatikum 41 68,3 25 10,3 66 21,8 Karsinoma hepatoseluler 5 8,3 29 11,9 34 11,2 Sindroma hepatorenal 2 3,3 3 1,2 5 1,7 Hematemesis 17 28,3 62 25,5 79 26,1 Melena 18 30 67 27,6 85 28,1 Ascites 47 78,3 177 72,8 224 73,9
Peritonitis bakterial spontan 1 1,7 0 0 1 0,3 Gastropati HT Porta 5 8,3 34 14 39 12,9 Komorbid Efusi pleura 3 5 35 14,4 38 12,5 Pneumonia 15 25 22 9,1 37 12,2 TB paru 0 0 5 2,1 5 1,7 Syok 7 11,7 0 0 7 2,3 Sepsis 18 30 1 0,4 19 6,3 Penyakit ginjal 4 6,7 6 2,5 10 3,3 Penyakit jantung 0 0 3 1,2 3 1 Ensefalopati Hepatikum Grade I-II 5 12,5 27 84,4 32 44,4 Grade III-IV 35 87,5 5 15,6 40 55,6 Ascites Ringan-sedang 36 76,6 143 81,3 179 80,3 Berat 11 23,4 33 18,8 44 19,7 Tahun 2010 22 36,7 90 37 112 37 2011 22 36,7 101 41,6 123 40,6 2012 16 26,7 52 21,4 68 22,4
Tabel uji normalitas kolmogorov smirnov
Variabel
p
Usia
0,193
Bilirubin Total
0,000
Albumin serum
0,246
PPT
0,000
Lama perawatan
0,000
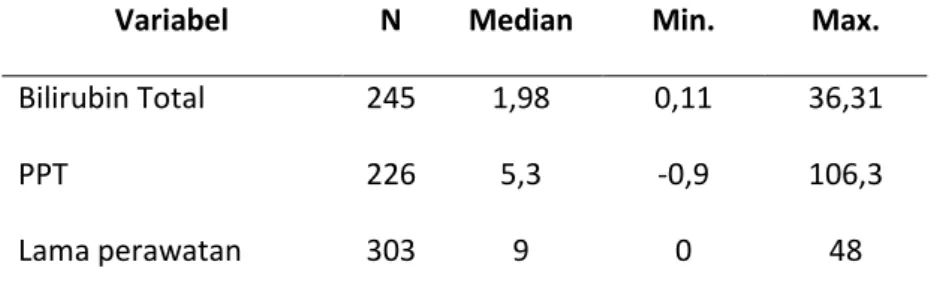
Tabel deskriptif
Variabel
N
Mean
SD
Usia
303
54,17
11,755
Albumin serum
259
2,345
0,6009
Variabel
N
Median
Min.
Max.
Bilirubin Total
245
1,98
0,11
36,31
PPT
226
5,3
-0,9
106,3
Lama perawatan
303
9
0
48
Klasifikasi CHILD-PUGH
Status
p
Meninggal Hidup Jumlah
n % n % n %
A 0 0 15 8,2 15 6,4 < 0,001
B 4 7,7 71 39 75 32,1
C 48 92,3 96 52,7 144 61,5
Dari uji Chi Square antara Klasifikasi CHILD-PUGH terhadap status survival
didapatkan nilai p = < 0,001, karena p < 0,05 maka dapat disimpulkan terdapat
hubungan yang signifikan antara klasifikasi CHILD-PUGH dengan status survival.
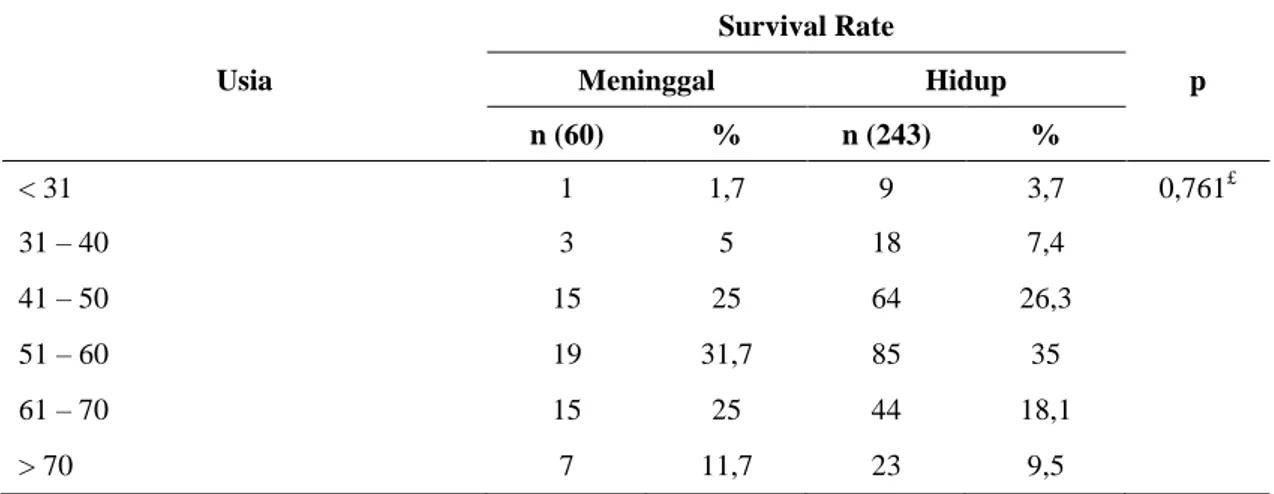
Tabel sebaran usia berdasarkan survival rate
Usia Survival Rate p Meninggal Hidup n (60) % n (243) % < 31 1 1,7 9 3,7 0,761£ 31 – 40 3 5 18 7,4 41 – 50 15 25 64 26,3 51 – 60 19 31,7 85 35 61 – 70 15 25 44 18,1 > 70 7 11,7 23 9,5Keterangan :
£Pearson Chi Square
Tabel Hubungan comorbid terhadap survival rate
Comorbid Survival Rate p Meninggal Hidup n (60) % n (243) % Efusi pleura 3 5 35 14,4 0,049*£ Pneumonia 15 25 22 9,1 0,001*£ TB paru 0 0 5 2,1 0,587¥ Syok 7 11,7 0 0 0,000*¥ Sepsis 18 30 1 0,4 0,000*¥ Penyakit ginjal 4 6,7 6 2,5 0,114¥ Penyakit jantung 0 0 3 1,2 1,000¥
Keterangan :
* Signifikan p < 0,05
£¥
Fisher’s Exact Test
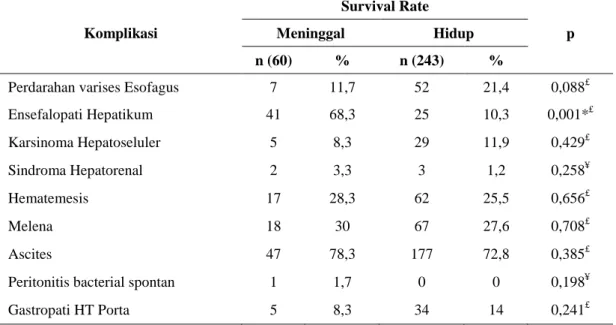
Tabel Hubungan komplikasi terhadap survival rate
Komplikasi
Survival Rate
p
Meninggal Hidup
n (60) % n (243) %
Perdarahan varises Esofagus 7 11,7 52 21,4 0,088£
Ensefalopati Hepatikum 41 68,3 25 10,3 0,001*£ Karsinoma Hepatoseluler 5 8,3 29 11,9 0,429£ Sindroma Hepatorenal 2 3,3 3 1,2 0,258¥ Hematemesis 17 28,3 62 25,5 0,656£ Melena 18 30 67 27,6 0,708£ Ascites 47 78,3 177 72,8 0,385£
Peritonitis bacterial spontan 1 1,7 0 0 0,198¥
Gastropati HT Porta 5 8,3 34 14 0,241£