Prediction of the Number of Airport Passengers Using Fuzzy C-Means
and Adaptive Neuro Fuzzy Inference System
Sunarsan Sitohang
1,2, Abba Suganda Girsang
2, Suharjito
2Abstract –
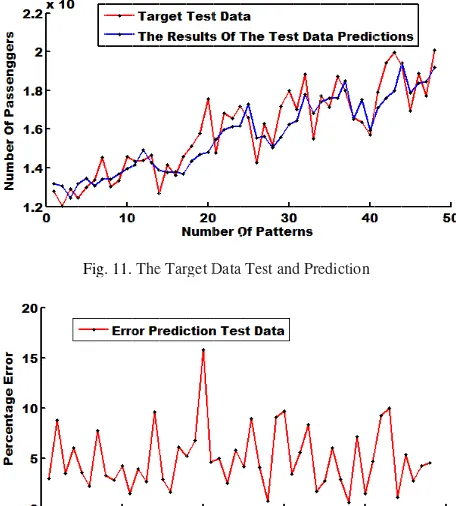
Airport requires a system to predict the number of passengers as a reference for airport development planning. In this study, the data used are time series of the number of passengers for eleven years. These data will form patterns which indicate the number of passengers each month in a year as the input data and the number of passengers next year as a target prediction. After the input data are clustered into three types using fuzzy C-means (FCM), the data are processed using adaptive neuro fuzzy inference system (ANFIS) to get the prediction data. The result shows that the “Mean Absolute Percentage Errors (MAPE ) which represent the errors for 4 years are 4.20%, 5.70%, 5.36% and 4.47% with an average of 4.93% . Based on this result, FCM and ANFIS can be combined to predict the data time series. Copyright © 2017 Praise Worthy Prize S.r.l. - All rights reserved.Keywords
:
Prediction, Number of Passenger, FCM, ANFISNomenclature
CNC Computer numeric control
SMO An algorithm for solving the quadratic programming problems arising during the training of support vector machines; it is widely used for support vector machines ANN Adaptive neural network
OSSA Optimized singular spectrum analysis LLNF Local linear neuro fuzzy
MAPE Mean absolute percentage error KNN K-nearest neighbors
Fuzzy C-Means
n Number of sample data m Number of attribute data Xij Sample data
c Number of cluster
w Rank
MaxIter Maximum iteration
ξ Error smallest expected U0 Matrix Fuzzy
ANFIS
y Weighted average w1 1st rule
w2 2nd rule
y1 Weighted of 1st rule y2 Weighted of 2nd rule
Weighted average of 1st rule Weighted average of 2nd rule x1 1st input of system
x2 2nd input of system
A1 1st parameter of activation function of 1st input system
B1 1st parameter of activation function of 2nd input system
A2 2nd parameter of activation function of 1st
input system
B2 2nd parameter of activation function 1st input
of system c10, c11,
c20c12,
c21, c22,
Element of matrix
αA1, αB1,
αA2, αB2
Degree of membership
I.
Introduction
improve quality level of laser cutting [7].
Ji et al. [8] proposed a cell-based model which includes two steps. The first step is to update speed, which is the cells the passenger can move in one time interval, and the other is to analyze the overtaking. ANFIS is a set of rules and an inference method combined in a structure connected then do the training and adaptation [5][6]. The goal of ANFIS is to find a model or mapping that will correctly associate the inputs (initial values) with the target (predicted values) [9]. PSO-ANFIS equalizer uses the training data and employs fuzzy C-means (FCM) clustering to model a wireless communication channel without knowledge of channel dynamics [10]. ANFIS to simulate solar radiation [11] Prediction using ANFIS which was implemented in various problems such as ANFIS and SMO models show an excellent performance for forecasting the hourly and daily power patterns using the temperature, wind direction, and time interval features for the wind speed [12], and forecasting to affect seat sales [13]. A study by Suharjito [14] used an optimized Neuro-fuzzy model with PSO to get the right model to improve the estimation effort at NASA dataset software project. Prediction models for thermal error compensation on CNC machine tools [15] predict the performance of a hybrid microgeneration system [16] and so forth. ANFIS is used for diagnosing dengue hemorrhagic fever [17]. Further, ANN is used for predicting stock price [18].
The provided data will be analysed using the forward chaining inference method to determine the kind of required nutrients [9]. M. Mirassid’s research showed that ANFIS-FCM with a high accuracy was able to predict earthquake magnitude [19]. Based on that research, in this study, the FCM and ANFIS method are combined to predict the number of passengers. This study uses data from Hang Nadim Airport, Batam, Indonesia.
This prediction can be used as one of key variables for determining the addition of facilities and human resources in the airport. It can also be used as a consideration for increasing the number of flights.
II.
Literature Review
Statistical modeling is a powerful tool for developing and testing theories by way of causal explanation, prediction, and description. Predictive model is any method that produces predictions, regardless of its underlying approach: Bayesian or frequentist, parametric or nonparametric, data mining algorithm or statistical model, etc.[20]. OSSA–LLNF the processed time series is modelled and forecasted via the LLNF model [21].
Prediction is like a puzzle, which is held by many people because they are curious about the future. Model prediction is very varied, such as income level of a city, the winner of a match, the election, weather, the power of an engine, a disease, and a lot of things that humans want to predict. The prediction methods can be classified into four broad categories: sequence based, clustering,
template based and meta-predictor approaches [22]. A “training set” (seen data) is used to build the model i.e. determine its parameters during the so-called training session [23]. A “Validation set” (unseen data) is used to measure the performance of the network by maintaining its parameters constant. Term “unseen” refers to data that have never been used to update the weights of the network.[24].
II.1. Fuzzy C-Means (FCM)
Clustering is a process of grouping a set of physical objects or abstract objects into the same class [25]. The FCM program is applicable to various analysis problems. This program generates fuzzy partitions and prototypes for any set of numerical data [26]. There are two models of clustering: hierarchical clustering and non-hierarchical clustering.
FCM is a hierarchical method for creating the hierarchical composition of the object data which produces the clusters of nesting. Non-hierarchical clustering provides n number of objects and k which is the number of clusters formed and processing of such objects into groups based on specific optimization criteria, where each group is a representation of a cluster. The FCM algorithm has some steps as follows [27] [28] [6]:
1. Input data to be clustered X, in the form of a matrix n × m (n = number of samples data, m = attribute of each data), Xij= Sampled data to – i (i = 1,2,3...,m).
2. Specify:
a. The number of cluster = c; b. Rank = w;
c. Maximum iterations = maxIter; d. Error smallest expected = ξ ; e. The objective function early = P0 = 0; f. Early iterations = t =1;
3. Generate a random number μik, i – 1, 2, ..., n; k = 1, 2,
..., c; as elements of the partition matrix U:
=
( ) ( ) … ( )
( ) ( ) … ( )
⋮
( )
⋮
( )
⋮
( )
(1)
The matrix of fuzzy clustering partition must meet the following conditions:
= [ 0,1] , 1 ≤ ≤ ; 1 ≤ ≤ (2)
= 1; 1≤ ≤ (3)
4. Calculate the center of cluster to - k ; vkj, with k=1, 2,
...., c; and j=1, 2, ..., m:
= ∑ ( ) ·
∑ ( ) (5)
5. Fix the degree of membership of each data on each cluster (fixed matrix partitioning):
=
/ ( )
(6)
with:
= ( − ) −
/
(7)
6. Calculate the objective function at iteration - t, Pt:
( , ; ) = ( ) ( ) (8)
7. Check the condition stops
If : ( | Pt-Pt-1 | < ξ ) or ( t > maxIter) then stop;
If not : t=t +1, repeat step 4
(9)
= + + ……+ = ∑ (10)
where X = mean, n = a lot of data, = data value to i:
1
−1 ( − ̅)
(11)
where n = The number data, = the data value to - i, = the avarage value of the data.
II.2. Adaptive Neural Fuzzy Inference System (ANFIS) Fuzzy model can be used instead of perceptron with many layers.
In this case, the system can be divided into two groups: one group of similar neural network with weights of fuzzy and activation function fuzzy, and other groups such as neural network with input in fuzzy right on the first or the second layer, but the weights on the neural network are not in fuzzy right. Neuro fuzzy is the second group.
Suppose there are two inputs x1, x2, and one output. There are two rules based on Sugeno models [29]:
If x1 is A1 and x2 is B1 then y1 = c11x1 + c12x2 + c10 If x1 is A2 and x2 is B2 then y2 = c21x1 + c22x2 + c20 If α predicates for the second rules are w1 and w2, then a weighted average can be calculated:
= +
+ = + (12)
ANFIS network consists of some layers as shown in Fig. 1 [30].
The output of each neuron in the form is provided by the membership degree of input membership functions, namely αA1(x1),αB1(x2), αA2(x1) or αB2(x2):
( ) = 1
1 + − (13)
{a,b,c} are the parameters, b = 1.
Fig. 1. ANFIS Network Architecture [30]
a. Each neuron in the second layer of neurons remains, so that the output is the result of input. Typically used the AND operator. Each node represents a predicate of the rule to the α - i.
b. Each neuron in the third layer is in the form of fixed node that is the result of the calculation of the ratio of α predicate (w), of the rules to - i to the total number of α predicate.
=
+ , w ith i = 1,2 (14)
c. Each neuron in the fourth layer is adaptive to an output node:
= ( + ) (15)
d. Each neuron in the fifth layer is a fixed node which is the sum of all inputs.
III.
Proposed Method
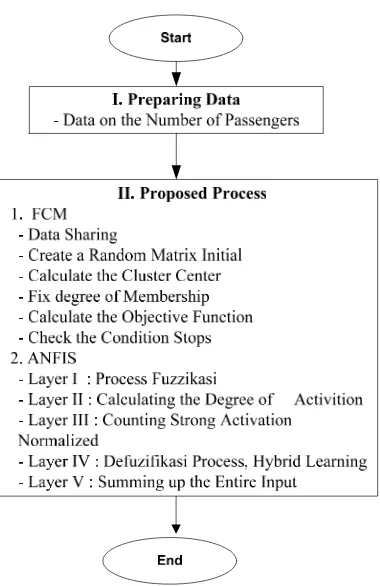
Fig. 2. Framework research methodology
Step I (Preparing Data)
The data include monthly data from 2004 to 2014. Based on the data, pattern will be established based on the following principles:
Time series data on the number of passengers Hang Nadim Airport Batam are , , , ……, . The problem is how to predict the number of passengers based on , , , ……, . The structure of the data pattern can be formed as follows:
[X1, X2, X3, X4, X5,X6, X7, X8, X9, X10, X11, X12 (2004) target X1 (2005)]
[X2, X3, X4, X5, X6,X7, X8, X9, X10, X11,X12 (2004), X1(2005) target X2(2005)]
[X12(2013), X1, X2, X3, X4, X5, X6, X7, X8, X9, X10, X11 (2014) target X12(2014)]
Step II (Proposed Process)
There are two important processes in the steps:
1. Fuzzy C-Means (FCM)
At this step, the number of passengers will be classified according to the FCM algorithm.
Furthermore, the data will be categorized into three clusters based on high, medium and low number of passengers.
At first, the center of the cluster's initial condition is still not accurate. Each data point has a degree of membership for each cluster.
However, after many iterations, the center of the cluster will be able to move towards the right location. This loop is based on minimization of the objective function that describes the distance from data supplied to center cluster membership degree weighted by the data points.
2. Adaptive Neuro Fuzzy Inference System (ANFIS) Once the data are clustered by FCM, the mean and standard deviation for each cluster are calculated using the Eqs. (10) and (11), respectively. The function membership is calculated based on the mean (variable a) and standard deviation (variable c) as shown by Eq. (13). The degree of membership is normalized on the third layer as shown by Eq. (14). Eq.(15) shows the adaptive node to output which occurs on the fourth layer.
Adaptive node is contained in the first and fourth layers. The knot on the first layer contains a parameter premise that is non-linear, while the fourth layer contains linear consequent parameters. To update those parameters as a learning in neural network, ANFIS uses two combination methods, namely the ‘forward pass’ and ‘backward pass’.
The next step ANFIS is fuzzification, calculating the degree of activation, hybrid learning, and aggregating all input. Last, the result of MAPE is calculated.
IV.
Analysis and Discussion
The data are taken from the the number of passengers at Hang Nadim Airport in 11 years from 2004 through 2014 as shown in Table I.
TABLE I
TIME SERIES DATA 2004 TO 2014
Month Years
2004 2005 2006 2007 2008 2009 2010 2011 2012 2013 2014
January 85133 94457 104323 108549 113798 112594 117038 128025 146719 166100 179816
February 70370 81633 82278 84286 100815 98912 116430 120208 126662 142605 166112
March 70261 80137 85666 104824 119197 119481 118200 129077 141621 162974 163616
Appril 70730 74168 94189 96713 102516 109041 131221 124445 135957 151576 156891
May 81468 74862 94924 107127 104028 115868 141258 129927 145603 171595 179258
June 79590 77602 98819 113817 101060 116094 130170 133792 151331 179851 194037
July 88388 91995 111541 129410 103589 124985 139910 145414 157635 170306 199632
August 82934 80147 105651 121654 106084 115313 123651 130132 175574 188548 192180
September 80180 83900 106459 108145 98206 121269 135045 133259 147820 155232 169505
October 74468 82924 116690 127759 97566 115176 137733 145835 168182 177047 188957
November 84891 81362 102137 106361 104030 122099 138279 143574 165351 171332 177164
TABLE II THE PATTERN DATA
Data Data Input
Target
Patterns X1 X2 X3 X4 X5 X6 X7 X8 X9 X10 X11 X12
1 85133 70370 70261 70730 81468 79590 88388 82934 80180 74468 84891 88736 94457
2 70370 70261 70730 81468 79590 88388 82934 80180 74468 84891 88736 94457 81633
3 70261 70730 81468 79590 88388 82934 80180 74468 84891 88736 94457 81633 80137
⁞ ⋮ ⋮ ⋮ ⋮ ⋮ ⋮ ⋮ ⋮ ⋮ ⋮ ⋮ ⋮ ⋮
118 177047 171332 187124 179816 166112 163616 156891 179258 194037 199632 192180 169505 188957 119 171332 187124 179816 166112 163616 156891 179258 194037 199632 192180 169505 188957 177164 120 187124 179816 166112 163616 156891 179258 194037 199632 192180 169505 188957 177164 200888
Suppose the number of passengers in each year is
, , , ……, . The problem is predicting how many passengers at based on , , , ……, . The structure of the data pattern is formed as follows .
[X1, X2, X3, X4, X5,X6, X7, X8, X9, X10, X11, X12 (2004) target X1 (2005)]
[X2, X3, X4, X5, X6,X7, X8, X9, X10, X11,X12 (2004), X1(2005) target X2(2005)]
[X12(2013), X1, X2, X3, X4, X5, X6, X7, X8, X9, X10, X11 (2014) target X12(2014)].
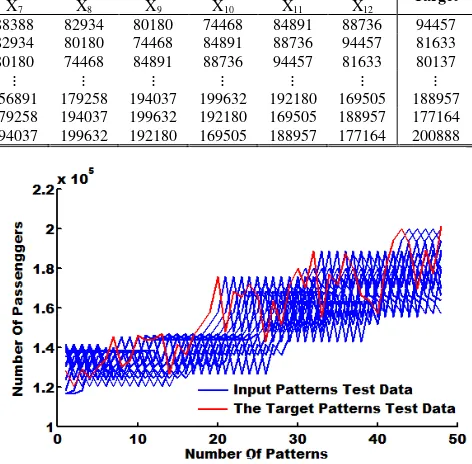
Thus, the data pattern 120 will be formed as shown in Table II or Figure 3. It shows that the input data are in blue line and the target data are in red line. This pattern data consists of two parts: training and test data.
Fig. 3. Data Patterns for 2004-2014
Therefore, the pattern data can be split into two parts as presented in Figures 4 and 5.
Figure 4 represents the training data which are the 1st to 72th of data pattern of Figure 3, while Figure 5 represents the test data which are 73th to 120th data pattern of Figure 3.
Fig. 4. Pattern Training Data
Fig. 5. Pattern Data Test
The pattern training data are clustered using FCM with number of clusters (C=3), rank (W=2), MaxIter=100), the smallest error to be expected (ξ = 0,0001).
The result FCM is shown in Figure 6 below.
Fig. 6. Clustering training using FCM
This research can be extended by combining the other algorithms to enhance weight of variable in ANFIS, such as particle swarm optimization, genetic algorithm, and so forth.
References
[1] T. Litman and D. Burwell, “Issues in sustainable transportation,” Int. J. Glob. Environ. Issues, vol. 6, no. 4, pp. 331–347, 2006. [2] Z. Xie, L. Jia, Y. Qin, and L. Wang, “A hybrid temporal-spatio
forecasting approach for passenger flow status in chinese high-speed railway transport hub,” Discret. Dyn. Nat. Soc., vol. 2013, 2013.
[3] A. Wijaya and A. S. Girsang, “The Use of Data Mining for Prediction of Customer Loyalty,” CommIT J., vol. 10, no. 1, pp. 41–47, 2016.
[4] L. Wang, Q. Zhang, Y. Cai, J. Zhang, and Q. Ma, “Simulation study of pedestrian flow in a station hall during the Spring Festival travel rush,” Phys. A Stat. Mech. its Appl., vol. 392, no. 10, pp. 2470–2478, 2013.
[5] Santoso, I., Gulo, R., Girsang, A., An Adaptive Cat Swarm Optimization Based on Particle Swarm Optimization Approach (ACPSO) for Clustering, (2016) International Review on Computers and Software (IRECOS), 11 (1), pp. 20-26.
[6] Indrawati, A., Girsang, A., Electricity Demand Forecasting Using Adaptive Neuro-Fuzzy Inference System and Particle Swarm Optimization, (2016) International Review of Automatic Control (IREACO), 9 (6), pp. 397-404.
[7] Y. Zhang and J. Lei, “Prediction of Laser Cutting Roughness in Intelligent Manufacturing Mode Based on ANFIS,” Procedia Eng., vol. 174, pp. 82–89, 2017.
[8] X. Ji, X. Zhou, and B. Ran, “A cell-based study on pedestrian acceleration and overtaking in a transfer station corridor,” Phys. A Stat. Mech. its Appl., vol. 392, no. 8, pp. 1828–1839, 2013. [9] N. Sevani and Yosua Jaya Chandra, “Web Based Application for
Early Detection of Vitamin and Mineral Deficiency,” CommIT (Communication & Information Technology) Journal 10(2), 53– 58, 2016.
[10] G. Model, “Article in press,” 2016.
[11] Lanre Olatomiwa, Saad Mekhilef, Shahaboddin Shamshirband,
Dalibor Petković, Adaptive neuro-fuzzy approach for solar radiation prediction in Nigeria, Renewable and Sustainable Energy Reviews, Volume 51, 2015, Pages 1784-1791.
[12] H. G. Lee, M. Piao, and Y. H. Shin, “Wnd power pattern forecasting based on projected clustering and classification methods,” ETRI J., vol. 37, no. 2, pp. 283–294, 2015.
[13] M. Varedi, “Forecasting seat sales in passenger airlines: introducing the round-trip model,” Management, 2010.
[14] Suharjito, S. Nanda, and B. Soewito, “Modeling software effort estimation using hybrid PSO-ANFIS,” in Proceeding - 2016 International Seminar on Intelligent Technology and Its Application, ISITIA 2016: Recent Trends in Intelligent Computational Technologies for Sustainable Energy, 2017. [15] A. M. Abdulshahed, A. P. Longstaff, and S. Fletcher, “The
application of ANFIS prediction models for thermal error compensation on CNC machine tools,” Appl. Soft Comput. J., vol. 27, pp. 158–168, 2015.
[16] L. Yang and E. Entchev, “Performance prediction of a hybrid microgeneration system using adaptive neuro-fuzzy inference system (ANFIS) technique,” Appl. Energy, vol. 134, pp. 197–203, 2014.
[17] M. Legowo, N., Kanigoro, B., Salman, A. G., & Syafii, “Adaptive Neuro Fuzzy Inference System for Diagnosing Dengue Hemorrhagic Fever,” in Asian Conference on Intelligent Information and Database Systems, 2015, pp. 440–447.
[18] Y. B. Napitupulu, T. A., & Wijaya, “Prediction Of Stock Price Using Artificial Neural Network: A Case Of Indonesia.,” J. Theor. Appl. Inf. Technol., vol. 54, no. 1, 2013.
[19] M. Mirrashid, “Earthquake magnitude prediction by adaptive neurofuzzy inference system (ANFIS) based on fuzzy C-means algorithm,” Nat. Hazards, vol. 74, no. 3, pp. 1577–1593, 2014. [20] G. Shmueli, “To explain or to predict?,” Stat. Sci., vol. 25, pp.
289–310, 2010.
[21] M. Abdollahzade, A. Miranian, H. Hassani, and H. Iranmanesh, “A new hybrid enhanced local linear neuro-fuzzy model based on the optimized singular spectrum analysis and its application for nonlinear and chaotic time series forecasting,” Inf. Sci. (Ny)., no. September, 2014.
[22] J. D. Atkins, S. Y. Boateng, T. Sorensen, and L. J. McGuffin, “Disorder prediction methods, their applicability to different protein targets and their usefulness for guiding experimental studies,” International Journal of Molecular Sciences, vol. 16, no. 8. pp. 19040–19054, 2015.
[23] H. Hindarto and S. Sumarno, “Feature Extraction of Electroencephalography Signals Using Fast Fourier Transform,” CommIT (Communication Inf. Technol. J., vol. 10, no. 2, p. 49, 2016.
[24] M. O. F. Technology, “Anfis Based Data Rate Prediction for Cognitive Radio Anfis Based Data Rate Prediction,” 2010. [25] J. Han, M. Kamber, and J. Pei, Data Mining: Concepts and
Techniques. 2012.
[26] J. C. Bezdek, R. Ehrlich, and W. Full, “FCM: The fuzzy c-means clustering algorithm,” Comput. Geosci., vol. 10, no. 2–3, pp. 191– 203, 1984.
[27] H.-J. Zimmermann, Fuzzy Set Theory—and Its Applications. 2001.
[28] J. Yen and R. Langari, Fuzzy Logic: Intelligence, Control, and Information. 1999.
[29] S. Osowski, T. H. Linh, and K. Brudzewski, “Neuro-fuzzy TSK network for calibration of semiconductor sensor array for gas measurements,” IEEE Trans. Instrum. Meas., vol. 53, no. 3, pp. 630–637, 2004.
[30] J.-S. R. Jang, “Neuro-fuzzy and soft computing for speaker recognition,” in Proceedings of 6th International Fuzzy Systems Conference, 1997, vol. 2, pp. 663–668.
Authors’ information
1Department of Engineering , Putera Batam University, Kepulauan Riau, Indonesia.
E-mail: [email protected]
2
Computer Science Department, Binus Graduate Program, Bina Nusantara University, Jakarta, Indonesia.
E-mails: [email protected] [email protected]
Sunarsan Sitohang obtained master in
computer science in engineering informatics from the Departement of Engineering, Bina Nusantara University, Jakarta, Indonesia in 2016. He obtained a Bachelor of Computer Science from the Department of Engineering, Putera Batam University (UPB), Batam, Kepri, Indonesia in 2013. His research interest in artificial intelligence and fuzzy logic.
![Fig. 1 [30].](https://thumb-ap.123doks.com/thumbv2/123dok/1304117.2009585/3.595.313.535.233.436/fig.webp)