Development of Geotechnical Engineering in Civil Works and Geo-Environment, Yogyakarta, 10-11 Juni 2014
1
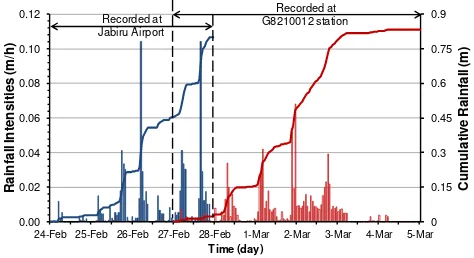
INTRODUCTIONExtreme rainfall occurred at throughout the Magela Creek catchment during late February to early March 2007 (Moliere et al 2007). During a one week period between 23 February and 16:30 h 2 March, 908 mm and 945 mm of rain was recorded at G8210012 and Jabiru Airport, respectively. Within 3 day between 17:00 h 27 February and 17:00 h 2 March, 740 mm and 784 mm of rain fell at G8210012 and Jabiru Airport, respectively. Extreme rainfall can have a significant impact on the stability of a rehabilitated mine. As a re-sult of this intense rainfall, landslides were initiated where Mamadawerre Sandstone has been removed to expose Oenpelli Dolerite. This landslide occurred at a soil slope with a (Er-skine et al. 2012). Study need to be performed to find out which cases with respect hydraulic parameter to triggering the landslide occurrence. Some controlling parameter for rainfall-induced landslides has been in-vestigated by Tsaparas et al. (2002). Preliminary inves-tigation of the rainfall pattern was investigated by Suradi and Fourie (2013) that applied rainfall record from the nearest rainfall station at Jabiru airport. Since the rainfall was uncertain, the rainfall record from
oth-er neighboring rainfall station (G8210012 station) is applied in this study (Figure 1). The main objective of this research was to investigate the effect of rainfall in-tensity on stability of the slope and to develop a boundary of the rainfall induces slope instability.
Figure 1 Rainfall hyetograph recorded from Jabiru Airport and G8210012 rainfall stations.
2
NUMERICAL MODELING2.1
Soil Properties of the SlopeLaboratory tests were conducted to estimate the hy-draulic shear strength and properties of the slopes. Fig-ure 2 shows the soil water characteristic curve (SWCC)
0
24-Feb 25-Feb 26-Feb 27-Feb 28-Feb 1-Mar 2-Mar 3-Mar 4-Mar 5-Mar
C
Development A Boundary of Rainfall-Induces the Stability of A
Residuals Soils Slope in Northern Territory, Australia
Agus Setyo Muntohar
Department of Civil Engineering, Universitas Muhammadiyah Yogyakarta, Indonesia. Email. [email protected]
Muhammad Suradi
School of Civil and Resources Engineering, University of Western Australia, Perth, Australia Politeknik Negeri Ujungpandang, Makassar, Indonesia
Andy Fourie
School of Civil and Resources Engineering, University of Western Australia, Perth, Australia
ABSTRACT: Seepage and slope stability issues concerning infiltration in unsaturated slopes are investigated and presented. A two dimensional finite element analysis are used to examine the effects of the rainfall intensity on the stability of a slope in the tropical region and to develop a boundary of the rainfall induced slope instability. The Jabiru landslide occurred in March 2007 after severe rainstorm with rainfall amount of 0.8 m in 3 days. This landslide occurred at a soil slope with a hei
. Parametric study was performed to find out which cases with respect to rainfall intensity and total rainfall triggering the landslide occurrence. Under a uniform distributed rainfall, duration of rainfall is more significant to cause slope failure rather than the rainfall intensity. For any rainfall intensity, if the duration of rainfall lesser than 4 days, the slope was unlikely to fail. The ratio of rainfall intensity and hydraulic conductivity (I/ksat) greater than one caused rapid change the factor
of safety of slope. For a rainfall intensity, I/ksat = 0.25 did not trigger slope failure since the factor of safety was obviously greater than two (FS > 2) for all depth.
meability (ksat) of R1 and R2 layers were 1 x 10 m/h and 0.008 m/h respectively for regions R1 and b γ N/ 3
, while for region 32o b = 16o γ 8 kN/m3.
(a) (b)
Figure 2 Soil-water characteristic curves and permeability functions with varying a values for the soils used in the study
2.2
Simulated Rainfall IntensityThree major rainfall scenarios were used in the simula-tion of seepage and slope stability analysis. The first simulation was performed by applying two time vary-ing rainfall records at Jabiru airport and G8210012 rainfall station as shown in Figure 1. The second simu-lation assumed that the rainfall intensities were uni-formly distributed ranging from 0.002 m/h to 0.016 m/h. The simulated rainfall has a ratio of the rainfall intensities to the hydraulic conductivity (I/ksat) about 0.25 to 2. The analysis was based on the time-varying for 216 hours to establish a rainfall boundary induces slope instability.
2.3
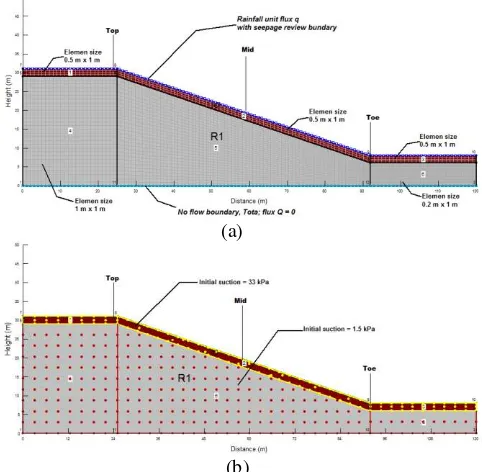
Seepage AnalysisIn this study, analyses for transient seepage conditions were conducted on a 23 m high slope inclined at 19°. The slope was composed of a homogenous, isotropic soil. The thickness of soil was relatively shallow about 2 m (assigned as R2). An impermeable soil and rock layers (assigned as R1) was found below the soil layer. The finite element seepage analysis software Seep/W (Geo-Slope International Ltd. 2007) for saturated– unsaturated soil systems was used in this study. The fi-nite element mesh, along with the boundary conditions, is shown in Figure 3a. A 1 m element size was used for meshing. A zero flux boundary was set along the left and right boundaries of R2 layer. The rainfall hyeto-graph in Figure 1 was modeled by applying unit flux boundary (q) to the surface of the slope for 216 hours (9 days). Transient pore water pressure analysis was applied for time step for 216 hours.
A steady state initial condition was set at the begin-ning of the transient seepage analysis. Initial pore wa-ter pressure was generated from initial suction by ap-plying nodes pressure in R2 and R1 regions (Figure 3b). The initial suction were 33 kPa, and 1.5 kPa
re-pore-water pressure was imposed as an initial condition would ensure that the pore-water pressure distributions were more realistic and represented a steady state con-dition.
(a)
(b)
Figure 3 (a) Slope geometry and boundary conditions of the slope for transient analysis (b) Boundary conditions for gen-erating initial pore-water pressure
2.4
Slope Stability AnalysisFor the slope stability analyses, the Bishop method of slices was used to compute the factor of safety within the soil. The field observation confirmed that a shallow slope failure was occurred with planar failure planes. The fully specified failure lines as illustrated in Figure 4 were used in the analyses. The depth of slip plane was determined at 0.5 m, 1 m, 1.5 m and 2 m below the slope surface. The pore–water pressures that were de-termined in the seepage analysis by Seep/W were used as input data for the slope stability analysis. Slope/W determines the element that lies closest to the centre of each slice base and computes the pore water pressure at each location from the nodal pore water pressure con-ditions of the element nodes.
Development of Geotechnical Engineering in Civil Works and Geo-Environment
3
RESULTS AND DISCUSSION3.1
Effect on infiltration and slope stabilityThe first simulation was used the real-time rainfall rec-ord as illustrated in Figure 1. The variation of the rain-fall infiltration rate and safety factor of the slope corre-spond to the elapsed time of rainfall are presented in Figure 5a and 5b respectively. The infiltration charac-teristics in Figure 5a shows that the rainfall infiltrates into the soil if the rainfall intensity is higher than the saturated hydraulic permeability of the soil. When the analysis used rainfall record from Jabiru airport (Figure 5a), the infiltration terminates at the end of rainfall and the slope is possible remaining stable along the rainfall periods since the computed factor of safety is higher than one (FS > 1) as shown in Figure 5b. The result is similar with the study performed by Suradi and Fourie (2013) but differs in the variation of the FS. However, combined the rainfall data from Jabiru airport with the G8210012 station results in continuous infiltration and the factor of safety (FS) decreases steeply from 2.5 to 0.96.
Figure 5 (a) Simulated infiltration, (b) Computed factor of safety with the elapsed time of rainfall on the failure-plane at 2 m depth below slope surface.
The effect of rainfall intensities on the variation of FS at different depth of failure-plane is presented in Figure 6. The figure shows that the computed FS de-crease with the elapsed time of rainfall. In the limit equilibrium theory, a slope experiences to fail if the FS < 1. The FS decreases rapidly at higher rainfall intensi-ty. For the simulated rainfall intensity I = 0.008 m/hr (I/ksat = 1) and 0.012 m/hr (I/ksat = 1.5), the computed FS has similar pattern at each failure-plane depth. A
failure is estimated to occur after 103 hours (4 days) of rainfall. Reducing the rainfall intensities to I = 0.006 m/hr (I/ksat = 0.75), and I = 0.004 (I/ksat = 0.5), tends to delay the time of failure. For a rainfall intensity, I = 0.002 m/hr (I/ksat = 0.25) does not trigger slope failure since the factor of safety is obviously greater than two (FS > 2) for all depth.
Figure 6 Variation of factor of safety with various rainfall in-tensity and failure plane at (a) 2 m depth, (b) 1.5 m depth, (c)
24-Feb 25-Feb 26-Feb 27-Feb 28-Feb 1-Mar 2-Mar 3-Mar 4-Mar 5-Mar
In
24-Feb 25-Feb 26-Feb 27-Feb 28-Feb 1-Mar 2-Mar 3-Mar 4-Mar 5-Mar
Fa
24-Feb 26-Feb 28-Feb 2-Mar 4-Mar
F
24-Feb 26-Feb 28-Feb 2-Mar 4-Mar
F
24-Feb 26-Feb 28-Feb 2-Mar 4-Mar
F
24-Feb 26-Feb 28-Feb 2-Mar 4-Mar
F
G8210012 q= 0.012 m/hr q = 0.008 m/hr
Two major parameter that controlling the instability of slopes due to rainfall were the soil properties and rain-fall intensity (Rahardjo et al., 2007). Rainrain-fall infiltra-tion results in the propagainfiltra-tion of the wetting front leads an increase in water content and loss in matric suction, and subsequently leads to slope failure. When the rain-fall intensity is higher than the infiltration capacity of the soil, it will increase the saturation of slope. Indica-tion of saturaIndica-tion can be seen by the decreasing of the suction on the slope surface and failure plane.
Figure 7 Variation of pore water pressure with the duration of rainfall (a) I = 0.002 m/hr (I/ksat = 0.25), (b) I = 0.004
m/hr (I/ksat = 0.5), (c) I = 0.012 m/hr (I/ksat = 1.5).
Figure 7 show a typical variation of the pore water pressure with the rainfall duration at the mid section of the slope. When rainfall intensity is lower than one fourth the saturated permeability of the soil (i.e. I < 0.25ksat or I/ksat < 0.25), the matric suction decreases significantly due to the propagation of the wetting front (Figure 7a). Nevertheless, the soil still remains in the unsaturated state. Figure 7b and 7c show that the
high-ity of the soil (I/ksat), the matric suction decreases rap-idly and, then, the increase of positive pore-water pres-sure was predominant at the certain elapsed time. Li et al. (2013) explained that increase in positive pore water pressure was affected by the soil water-retention curve and the impermeable soil layer as bedrock. At this stage, the slope stability steeply decreased as shown in Figure 6. During the rainfall, to saturate the whole soil layers needs a longer time for smaller rainfall intensity (Figure 7a). Since the pore water pressure is related to the slope stability, it is the reason of the delaying of slope failure for smaller rainfall intensity.
The results from the parametric studies also indicat-ed that, for a given rainfall duration, there was a threshold rainfall intensity which would produce the minimum factor of safety. In this paper, the critical rainfall threshold is defined as the hourly rainfall while the safety factor of the slope is equal to 1.0. The well established rainfall threshold was rainfall intensity and duration relationship; know as ID relationship (Guzzetti et al., 2008). Figure 8 shows the ID relation-ship for the evaluated slope. The relationrelation-ship is limited to condition that the soil properties, slope geometry, and soil hydraulic characteristics were constant, and the rainfall intensity was constant precipitate. The characteristics of pore water pressure (Figure 7) and factor of safety (Figure 6) indicates that saturation on slip plane initiates prior the slope failure. For this rea-son, Figure 8 plots the relationship between duration to reach saturation and rainfall intensity. The figure shows that there is time-lag from the initiation of satu-ration and slope failure as shown by the shadow area. The ID relationship in Figure 8 is alluding to conclude that that duration of rainfall is more significant to cause slope failure rather than the rainfall intensity. For any rainfall intensity, if the duration of rainfall lesser than 4 days, the slope is unlikely to fail.
Development of Geotechnical Engineering in Civil Works and Geo-Environment
4
CONCLUSIONSA series of numerical simulations were carried out to investigate the hydraulic responses of soil to various rainfall characteristics. The findings from the numeri-cal simulations were used to develop a rainfall thresh-old for slope failures. Combined the rainfall data from Jabiru airport with the G8210012 station results in con-tinuous infiltration and the factor of safety (FS) de-creased steeply from 2.5 to 0.96. Under a uniformly distributed rainfall, duration of rainfall is more signifi-cant to cause slope failure rather than the rainfall inten-sity. For any rainfall intensity, if the duration of rainfall lesser than 4 days, the slope were unlikely to fail. The rainfall threshold was presented by improved ID rela-tionship that was plotting among the rainfall intensity and duration causing slope failure and the onset time of saturation of slip plane. There was time-lag from the initiation of saturation to the time of slope failure as shown by the shadow area in ID relationship (Figure 8). For a rainfall intensity, I = 0.002 m/hr (I/ksat = 0.25) did not trigger slope failure since the factor of safety was obviously greater than two (FS > 2) for all depth.
REFERENCES
Moliere, D.R., Evans, K.G., & Saynor, M.J., 2007, Hydrolo-gy and suspended sediment transport in the Gulungul
Creek catchment, NorthernTerritory: 2006--‐2007 wet season monitoring. Internal Report 531, Supervising Sci-entist, Darwin, (Unpublished paper)
Erskine, W., Saynor, M., Jones, D., Tayler, K., & Lowry, J.,
2012, Managing for extremes: potential impacts of large
geophysical events on Ranger Uranium Mine, N.T., in Grove, J.R & Rutherford, I.D (eds.) Proceedings of the 6th Australian Stream Management Conference,
Manag-ing for Extremes, River Basin Management Society, 6 –
8 February, 2012, Canberra, Australia, pp.1 – 7.
Guzzetti, F., Peruccacci, S., Rossi, M., & Stark, C. P., 2008, The rainfall intensity-duration control of shallow land-slides and debris flows an update, Landslides, Vol. 5: 3– 17.
Li, W.C., Lee, L.M., Cai, H., Li, H.J., Dai, F.C., & Wang, M.L., 2013, Combined roles of saturated permeability and rainfall characteristics on surficial failure of
homo-geneous soil slope, Engineering Geology, Vol. 153:
105-113
Tsaparas, I., Rahardjo, H., Toll, D.G., & Leong, E.C., 2002, Controlling parameters for rainfall-induced landslides.
Computers and Geotechnics, Vol. 29, pp. 1–27
Suradi, M., & Fourie, A., 2013, The Effect of Rainfall
Pat-terns on the Mechanisms of Shallow Slope Failure, Aceh
International Journal of Science and Technology, Vol. 3(1) : 1-18
Rahardjo; H., Ong, T.H., Rezaur, R.B., & Leong, E.C., 2007, Factors Controlling Instability of Homogeneous Soil
Slopes under Rainfall, Journal of Geotechnical and