142
Development of Conceptual Framework for Sustainable Supply Chain
Performance Measurement in Service Industries
Eko Budi Leksono
1, Suparno
2, Iwan Vanany
21 Department of Industrial Engineering – University of Muhammadiyah Gresik and Industrial Engineering Doctorate
Student at Sepuluh Nopember Institute of Technology, Surabaya. 60111. Indonesia
2 Department of Industrial Engineering – Sepuluh Nopember Institute of Technology, Surabaya. 60111. Indonesia
environment and social [7]. SSC need performance
Abstract - The growth of service industries have been significant relation with economic growth. Service industries need a new paradigm for maintains the growth, likes supply chain (SC) and performance measurement. Main objective of SC is economic sustainability. Application of sustainability was not enough on the economic aspect, but also environmental and social. Evaluation of SC impact on the economic, social and environment called sustainable SC (SSC). SSC implementation in service industries can be increase the profit and minimize negative impact for environment and social. SSC need performance measurement system for measuring of success standards that called SSC performance measurement (SSCPM). SSCPM frameworks in service industry have developed, but still lack in interaction and interrelation between indicators based on sustainability aspects and perspectives. This study propose a new SSCPM framework based on balanced scorecard (BSC), leveling of SC, analytical networking process (ANP) and system dynamics. BSC adoption used to determine performance perspectives and performance indicators based on sustainability aspects (economic, environment and social) and to make strategy map for system dynamics causal loop and stock and flow diagram. Leveling SC is used to look decision maker authority to a performance indicator. ANP used to determine perspective weight. System dynamics used to analyze of relationship and interrelationship between indicators based on perspectives and sustainability aspects. Implement of a framework able to predict and to control service industry performance at the future based on system behavior.
Keywords – service industries, SSCPM, BSC, sustainability aspect, leveling of SC, ANP and system dynamics.
I. INTRODUCTION
The service industries have significant contribution in the Gross Domestic Product (GDP) of a country [1] and became a driving force in national economy growth [2], [3]. SC concept can implement to make efficient and effective management of service industry [1]. SC objective are minimize cost and maximize profit for economic sustainability.
Now, economic sustainability is not enough. Stakeholders (governance, NGOs, community, customers) have been pressured focal firm and SC for commitment to environment and social sustainability [4], [5]. Evaluation of SC impact on the economic, social and environment called SSC [6]. SSC implementation in service industries can increase the profit and minimize negative impact for
measurement system for measuring of success standards that called SSCPM.
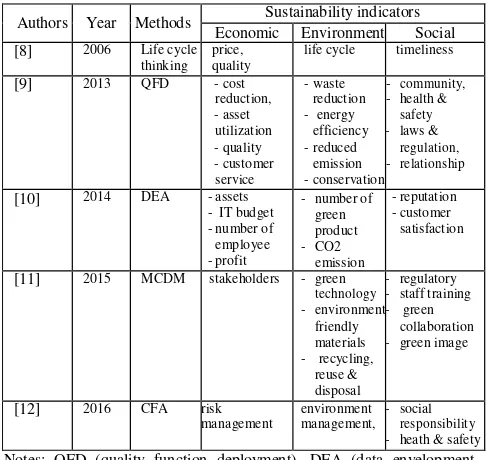
SSCPM frameworks have developed in service industry. Life cycle thinking used in laboratory service [8], Quality Function Deployment (QFD) used in logistic provider [9]
,
Data Envelopment Analysis (DEA) used in banking [10], Service SC Environmental Performance Evaluation (SSCEPE) based on multi criteria decision making (MCDM) in medical support service provider and catering service [11]. SSCPM framework able to develop based on risk management, environment management, social responsibility, health and safety [12].Disadvantages of SSCPM in service industry are lack of interaction and coordination between SC actors in determine performance indicators, metric, and assessment [13], lack of interrelationships and or interdependency between indicators of sustainability aspect to determine causal links impact on operational SSC [4], [14], [15], performance indicators for social aspect still less explored [15], [16]. Besides that, the main characteristic of service is intangibility, so SSCPM system for service industries must attention about intangibility aspect to be performance indicator [17].
From the disadvantages, it’s required SSCPM system for service industries needs : a). involve all SC actors in determining performance indicators, standards and measurement, b). intangibility characteristics to be performance indicator, c). describes priorities and relationship between performance indicators for each perspective and or between other perspective to facilitate decision maker at the level of operational, tactical and strategic, c). can be implemented in several types of service industries.
143 The research question is how to develop of SSCPM framework based on BSC that integrate with ANP and system dynamics simulation for service industries.
II. METHODOLOGY
Service SC
Services characteristic are intangibility, inseparability of production and consumption, heterogeneity, perishable, client based relationships & customer contract, labor intensive [23]. SC research on service industry is service SC development, and then service SC has an evolution of SC implementation on manufacturing [2], [23]–[25]. Services SC are often characterized with high customer involvements, less structured processing, and intangible products that may not be standardized or stored [12]. Service SC categories are Service Only SC (SOSC) and Product Service SC (PSSC) [26]. SOSC defined as SC systems in which the products are pure services, and physical products do not play a role. SOSCs examples: healthcare, tourism, telecommunication service provider, educations, finance, etc. PSSC defined as SC systems in which the products are services and physical products do play a role. PSSCs examples: restaurant, retail, product design, logistic service provider, etc.
Definition of service SC is:
“ as the management information, processes, capacity, service performance and funds from earliest suppliers to the ultimate customers [27]”. Application of this definition is prefer to the PSSC [26].
“ as the network of suppliers, service providers, consumers and other supporting units that performs the functions of transaction of resources required to produce services, transformation of these resources into supporting and core services, and the delivery of these services to customers [23]”. Application of this definition is prefer to the SOSC [26].
Some criteria on service SC are information and technology [2], [23], [28]–[31], intangibility assets (capacity and competency of human resources) [1]–[3], [23], [27], [29], demand management [1], [2], [23], [27], [29], suppliers and customers relationship [1]–[3], [23], [27]–[30]. SC service criteria can be used as a guide in setting performance perspective on SC performance measurement.
Research opportunities in service SC are communication, coordination, collaboration, customer satisfaction, profitability, performance measurement and sustainability [2], [23], [32], [33]. Effective supplier and customer relationship management play a key role in the service SC [12].
Sustainable SC (SSC) in service industries
Impact evaluation of SC on the economic, social and environmental integration called SSC. SSC is a relatively new concept in the service sector [12]. SSC aims to deliver quality products and services across the SC while
increasing effectiveness, reducing waste and costs, and being environmentally responsible [12]
SSC definition is:
“ as the management of material and other flows and cooperation among organization in the SC to achieve three objectives of sustainable development : environmental, social, and economic sustainability.”[34]
“…the management of SC operations, resources, information, and funds in order to maximize the SC profitability while at the same time minimizing the environmental impact and maximizing the social well-being.”[4]
“ the creation of coordinated SC through the voluntary integration of economic, environmental, and social considerations with key inter-organizational business systems designed to efficiently and effectively manage the material, information, and capital flows associated with the procurement, production, and distribution of products or services in order to meet stakeholder requirements and improve the profitability, competitiveness, and resilience of the organization over the short- and long-term.”[35]
SSC research area: reporting, governance, integration into CSR practices, performance measurement, standardization and control, collaboration [36]. SSC researches have lack on the complexity and confusion in determining success indicators [37] and less attention to social issues [16].
SC Performance Measurement (SCPM) in service industries
The SCPM objectives are identify of successful SC practices, consumer needs identification, improving processes, identify of bottlenecks and waste problems, opportunities identification, help make decisions in real conditions, knowing progress, support to communication, transparency and cooperation [38]. SCPM in service industry more responsive, efficient and can be used controllable tool [39]. SCPM research areas : dynamic modeling, process maturity relationship with performance, priorities and relationships between KPIs, HR and organization, partnership / collaboration, trends, evolution of network integration, measurement characteristics and size used, benchmarking, sustainability [38].
Sustainable SCPM (SSCPM) in service industries
144
Authors Year Methods Economic Sustainability indicators Environment Social
[8] 2006 Life cycle
thinking price, quality life cycle timeliness
[9] 2013 QFD - cost
management environment management, - social responsibility - heath & safety
SSCPM methods and indicators in service industries
Notes: QFD (quality function deployment), DEA (data envelopment analysis), MCDM (multi criteria decisions making), CFA (confirmatory functional analysis)
Methodology
The research methodology has 3 (three) stage:
First, we found SCPM and SSCPM framework based on BSC, leveling of SC, system dynamics and ANP from the literature review that inspire our framework.
TABLE 2
SCPM and SSCPM framework based on BSC, leveling of SC, dynamic system and ANP
The proposed SSCPM conceptual framework was built from table 2. SSCPM conceptual framework based on BSC integrated with leveling of SC, system dynamics and ANP for service industries can be designed.
Second, we found 5 (five) main perspective of service SC characteristics from literature review:
Third, we use focus group discussion with peer group for design of SSCPM conceptual framework.
Fourth, verification and validation can be done by applying SSCPM conceptual framework in service industries.
III. RESULTS
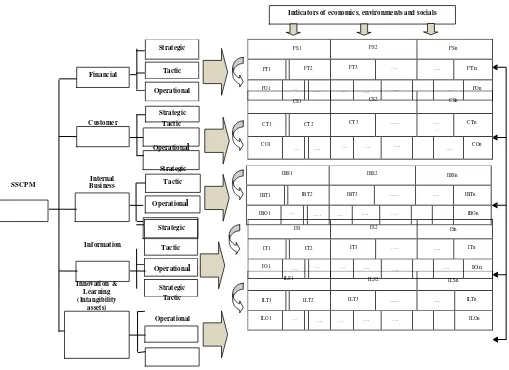
Models and methods used in the design of framework are BSC, leveling of SC, ANP, and system dynamics simulation. Propose model for SSCPM conceptual framework for service industries shown in Figure 1.
Design of SSCPM conceptual framework for service industries consist of 7 (seven) phase. First, determine of performance indicators based on sustainability aspect (economics, environments, and socials). Second, classify performance indicators to the performance perspectives (financial, customers, operational/internal business, information, innovation and learning). Indicators of innovation and learning perspectives especially based on intangibility assets. Third, classify of indicators for each performance perspective to leveling of SC (strategic, tactic, operational). Performance indicators determine based on sustainability aspects (economic, environment and social) has influence the decisions to be made at strategic, tactical, and operational levels [43]. Fourth, make strategy map based on BSC as SSCPM causal loop diagram. Fifth, calculate of performance perspective weight using ANP. ANP used to determine weight of perspectives and or SC level based on interrelationship or interdependency between indicator on a perspective or other perspectives. Sixth, system dynamics simulation required to analyze and to evaluate SSCPM causal loop. SSCPM causal loop will be develop for stock and flow diagram. Stock and flow diagram input requires weight of performance perspectives and value of performance indicators at the past at service industries. Seventh, analyze of simulation output for to illustrate performance behavior and to predict and to control of service industry performance at the future.
Design of SSCPM conceptual framework for service industries based on BSC that integrate with SC leveling, system dynamics simulation and ANP more better than SCPM and SSCPM previous model because this model build by SC actors to determine performance indicators, standards and measurement, more attention to intangibility characteristics, can show interrelationship or interdependency between indicator on a perspective or other perspectives to facilitate all SC level to make decision more accurate.
IV. DISCUSSION
145
Strategic
Tactic
Operational
FS1 FS2 FSn
FT1 FT2 FT3 ….. …. FTn
FO1 … …. … …. …. …. FOn
CS1 CS2 CSn
CT1 CT2 CT3 ….. …
.
CTn
CO1
… …. … …. …. …. COn
IBS1 IBS2 IBSn
IBT1 IBT2 IBT3 ….. … IBTn
IBO1 … …. … …. …. IBOn
Strategic
Tactic
Operational
Strategic
IS1 IS2 ISn
IT1 IT2 IT3 ….. …. ITn
IO1 … … … …. …. …. IOn
ILS1 ILS2 ILSn
ILT1 ILT2 ILT3 ….. … ILTn
ILO1 … …. … …. …. ILOn
strategic level less than tactical level and performance indicators for tactical level less than operational level (∑ strategic indicators < ∑ tactical indicators <
∑ operational indicators). Second, focus group discussion (FGD) between SC actors (suppliers, focal firm, customers and stakeholders) to classification of performance indicators based on management level and performance perspectives. Management level are strategic, tactic and operational. Performance perspectives for service industries determined based on literature review are financial, customer, business process, information and innovation and growth. Third, multi case study at service industries used to make relationship between indicators on a perspective or other perspectives for BSC strategy map. BSC strategy map can be used causal loop. In this stage, weight of perspectives and indicators can be calculated with ANP. Fourth, system dynamics simulation required to analyze causal loop and stock and flow diagram. The data input are indicators weight, perspectives weight and indicators value at the past. Result of system dynamics simulation can illustrate system of performance behavior in service industries and predict of performance value at the future.
Fifth, result of the system need validation. Validation of system by compare value between performance outputs of system dynamics simulation with value of performance in service industries in current period.
The adoption BSC model for SSCPM system development in service industries is able to show cause and effect relationships between performance indicators based on sustainability aspect (economic, environment and social), decision level of management on SC (strategic, tactic and operational) and performance perspectives (financial, customer, business process, information and innovation and learning). For innovation and learning perspective should be directed to the intangibility assets, includes human capital (skills, talent, knowledge), information capital (database, information system, network, technology infrastructure), organization capital (culture, leadership, employee alignment, teamwork, knowledge management) as performance
indicators [17].
Indicators of economics, environments and socials
Financial
Strategic
Customer Tactic
Operational
Strategic
SSCPM
Internal
Business Tactic
Operational
Information
Innovation & Learning (Intangibility
assets)
Tactic
Operational
146
This study has proposed a new SSCPM conceptual performance measurvol. 17, no. 3, pp. 320es,”–339, 2010. Benchmarking An Int. J., framework based on balanced scorecard (BSC) that
integrate with leveling of SC, analytical networking process (ANP) and system dynamics simulation for service industries. This framework can be used as guidance to measure of sustainable SC performance, because can help manager to show interrelation between
[6]
[7]
J. Linton, R. Klassen, and V. Jayaraman,
“Sustainable supply chains: An introduction,” J. Oper. Manag., vol. 25, no. 6, pp. 1075–1082, Nov. 2007.
X. Xu and D. Gursoy, “A Conceptual Framework of Sustainable Hospitality Supply Chain performance indicators and can predict performance value
at the future based on sustainability aspects (economic, Managemen2014. t,”J. Hosp. Mark. Manag., pp. 1–31, social and environment) and or performance perspectives.
Further, this framework can simulate performance measure by system dynamics simulation based on performance perspectives or sustainability aspect. Both
[8] G. M. Rynja and D. C. Moy, “Laboratory service evaluation: laboratory product model and the supply chain,” Benchmarking An Int. J., vol. 13, no. 3, pp. 324–336, 2006.
Cause and effect relationships between performance indicators explain on BSC strategy map. There are positive and negative interrelationships and interdependencies between performance indicators on a perspective or between other perspectives. BSC strategy map able to used causal loop scenario based on system dynamics simulation [22].
Causal loop scenario in this framework can be designed into 2 (two) alternatives, based on sustainability aspects (economic, environment and social) or based by a performance perspective (financial, customer, operation/process business, information, innovation and learning). Each alternative can simulate with computer program.
Furthermore, causal loop diagram on system dynamics can be developed into a stock and flow diagram. Stock and flow diagram able to simulate based on sustainability aspect or performance perspectives. The stock and flow diagram need inputs. The input for stock and flow diagram scenario are data of value of performance indicators at the past from service industries and weight of performance indicators and performance perspectives. The weight of performance indicators and performance perspectives can calculate by ANP.
System dynamics simulation can make with 2 (two) alternatives. First alternative based on performance perspectives (financial, customer, operation/process business, information, innovation and learning), second alternative based on sustainability aspect (economic, environment and social). Each simulation alternative will be run with stock and flow diagram.
The output of system dynamics simulation can describe SSCPM behavior based on sustainability aspect or perspective indicators. SSCPM behavior able to seen from relationship between indicators and perspectives on stock and flow diagram. Besides that, the output also can evaluated and analyzed to performance predict and performance control on future, so services industries can implement something in order to improve its performance.
V. CONCLUSION
the academic research and managerial implications could be explored more in the future
The limitation of this study is only conceptual framework. There need implementation and validation at service industries at the future. Future research need implementation of this conceptual framework at service industries with 5 (five) stage. First, identify sustainability performance indicator based on literature review and SC actor’s requirement. Second, classify of performance indicators based on management level and performance perspectives. Third, make relationship between indicators on a perspective or other perspectives by BSC strategy map and calculate of indicators and perspectives weight by ANP. BSC strategy map can be made causal loop of SSCPM. Fourth, analyze causal loop and stock and flow diagram by system dynamics simulation. Fived, system validation by comparing value between performance outputs of system dynamics simulation with value of performance in service industries in current period. If system dynamics simulation output similar with value of performance in the current period, so the system is valid.
.
REFERENCES
[1] J. Drzymalski, “Supply Chain Frameworks for the Service Industry : A Review of the Literature,”
vol. 1, no. December, pp. 31–42, 2012.
[2] D. W. Cho, Y. H. Lee, S. H. Ahn, and M. K. Hwang, “A framework for measuring the performance of service supply chain management,” Comput. Ind. Eng., vol. 62, no. 3, pp. 801–818, Apr. 2012.
[3] M. Giannakis, “Management of service supply chains with a service-oriented reference model: the case of management consulting,” Supply Chain Manag. An Int. J., vol. 16, no. 5, pp. 346– 361, 2011.
[4] E. Hassini, C. Surti, and C. Searcy, “A literature review and a case study of sustainable supply chains with a focus on metrics,” Int. J. Prod. Econ., vol. 140, no. 1, pp. 69–82, Nov. 2012. [5] S. Shaw, D. B. Grant, and J. Mangan,
147 [10]
[11]
[12]
framework with multiple formatted and incomplete preferences : A sustainable supply chain application Gülc,”Appl. Soft Comput., vol. 13, pp. 3931–3941, 2013.
A. Tajbakhsh and E. Hassini, “A data envelopment analysis approach to evaluate sustainability in supply chain networks,”J. Clean. Prod., Aug. 2014.
P. Chithambaranathan, N. Subramanian, and A. Gunasekaran, “Int . J . Production Economics Service supply chain environmental performance evaluation using grey based hybrid MCDM approach,” Intern. J. Prod. Econ., no. 2006, pp. 1–14, 2015.
M. Hussain, M. Khan, and R. Al-aomar, “A
framework for supply chain sustainability in service industry with Confirmatory Factor Analysis,” Renew. Sustain. Energy Rev., vol. 55, Planning based on Performance Measurement Systems in Closed Loop Supply Chains,”
M. Giannakis, “Conceptualizing and managing service supply chains,” Serv. Ind. J., vol. 31, no. technologies with respect to discrimination performance.,”Appl. Ergon., vol. 40, no. 1, pp. 69–81, Jan. 2009.
M. Varsei, C. Soosay, B. Fahimnia, and J. Sarkis,
“Framing sustainability performance of supply chains with multidimensional indicators,” Supply Chain Manag. An Int. J., vol. 19, no. 3, pp. 242 – 257, 2014.
P. Beske-janssen, M. P. Johnson, and S. Schaltegger, “20 years of performance measurement in sustainable supply chain management – what has been achieved ?,” Supply Balanced Scorecard to strategy,” Calif. Manage. Rev., vol. 39, no. 1, pp. 53–79, 1996. performance measurement system for firms across supply and demand chains on the analogy of ecological succession,” Ecol. Econ., vol. 68, no. 12, pp. 2918–2929, Oct. 2009.
S. Boon-itt and C. Pongpanarat, “Measuring Service Supply Chain Management Processes :
The Application of the Q-Sort Technique,”Int. J. Innov. Manag. Technol., vol. 2, no. 3, pp. 217– 221, 2011.
A. Y.-L. Chong and L. Zhou, “Demand chain management: Relationships between external antecedents, web-based integration and service innovation performance,”Int. J. Prod. Econ., vol. 154, pp. 48–58, Aug. 2014.
L. M. Ellram and M. C. Cooper, “Supply Chain Management : It’s all about the journey, not the destination,”J. Supply Chain Manag., vol. 50, no. 1, pp. 8–21, 2014.
148
52, pp. 329–341, 2013. measurement in the value chain: manufacturing v.
[36] O. Morali and C. Searcy, “A Review of tourism,” Int. J. Product. Perform. Manag., vol. Sustainable Supply Chain Management Practices 55, no. 5, pp. 371–389, 2006.
in Canada,”J. Bus. Ethics, vol. 117, no. 3, pp. [50] J. Cai, X. Liu, Z. Xiao, and J. Liu, “Improving
635–658, Nov. 2012. supply chain performance management: A
[37] S. Matos and J. Hall, “Integrating sustainable systematic approach to analyzing iterative KPI development in the supply chain: The case of life accomplishment,”Decis. Support Syst., vol. 46, cycle assessment in oil and gas and agricultural no. 2, pp. 512–521, Jan. 2009.
biotechnology,”J. Oper. Manag., vol. 25, no. 6, [51] L. L. Yap and C. L. Tan, “The Effect of Service pp. 1083–1102, Nov. 2007. Supply Chain Management Practices on the [38] G. A. Akyuz and T. E. Erkan, “Supply chain Public Healthcare Organizational Performance,”
performance measurement: a literature review,” vol. 3, no. 16, pp. 216–224, 2012.
Int. J. Prod. Res., vol. 48, no. 17, pp. 5137–5155, [52] D. Q. Chen, D. S. Preston, and W. Xia,
Sep. 2010. “Enhancing hospital supply chain performance: A
[39] Y. Kathawala and K. Abdou, “Supply chain relational view and empirical test,” J. Oper. evaluation in the service industry : A framework Manag., vol. 31, no. 6, pp. 391–408, Sep. 2013. development compared to manufacturing,” [53] R. Singh, H. S. Sandhu, B. A. Metri, and R. Kaur, Manag. Audit. J., vol. 18, no. 1 / 2, pp. 140–149, “Relating organised retail supply chain,” J. Bus.
2003. Perspect., vol. 14, no. 3, pp. 173–190, 2010.
[40] E. Ortas, J. M. Moneva, and I. Álvarez,
“Sustainable supply chain and company performance : A global examination,” Supply Chain Manag. An Int. J., vol. 19, no. 3, pp. 332– 350, 2014.
[41] A. Gunasekaran, C. Patel, and R. E. McGaughey,
“A framework for supply chain performance measurement,” Int. J. Prod. Econ., vol. 87, no. 3, pp. 333–347, Feb. 2004.
[42] R. Bhagwat and M. K. Sharma, “Performance measurement of supply chain management : A balanced scorecard approach,” Comput. Ind. Eng., vol. 53, pp. 43–62, 2007.
[43] R. Bhagwat and M. K. Sharma, “Performance measurement of supply chain management using the analytical hierarchy process,” Prod. Plan. Control, vol. 18, no. 8, pp. 666–680, 2009.
[44] W. H. Ip, S. L. Chan, and C. Y. Lam, “Modeling supply chain performance and stability,” Ind. Manag. Data Syst., vol. 111, no. 8, pp. 1332– 1354, 2011.
[45] C. Morgan, “Structure , speed and salience : performance measurement in the supply chain,”
Bus. Process Manag. J., vol. 10, no. 5, pp. 522– 536, 2004.
[46] S. Schmidberger, L. Bals, E. Hartmann, and C. Jahns, “Ground handling services at European hub airports: Development of a performance measurement system for benchmarking,” Int. J. Prod. Econ., vol. 117, no. 1, pp. 104–116, Jan. 2009.
[47] T. Wu, Y.-C. Jim Wu, Y. J. Chen, and M. Goh,
“Aligning supply chain strategy with corporate environmental strategy: A contingency approach,”
Int. J. Prod. Econ., vol. 147, pp. 220–229, Jan. 2014.
[48] H. K. Lee and Y. Fernando, “The antecedents and outcomes of the medical tourism supply chain,”