Connecting
to
Compete
2012
Trade Logistics in the
Global Economy
The Logistics Performance Index and Its Indicators
• Despite a positive trend in performance since 2007,
• Countries with substantial performance improvement
• Efficient border clearance goes beyond customs and
• Greening the logistics is a growing concern,
LPI score
1.00–2.41 2.42–2.89
2.89–3.39 3.42–5.00
No data
Connecting to Compete 2012
Trade Logistics in the Global Economy
The Logistics Performance Index and Its Indicators
Jean-François Arvis
The World Bank
Monica Alina Mustra
The World Bank
Lauri Ojala
Turku School of Economics
Ben Shepherd
The World Bank
© 2012 he International Bank for Reconstruction and Development/he World Bank 1818 H Street NW
Washington, DC 20433 Telephone: 202-473-1000 Internet: www.worldbank.org E-mail: [email protected]
All rights reserved
he indings, interpretations, and conclusions expressed herein are those of the authors and do not necessarily relect the views of the Executive Directors of the International Bank for Reconstruc-tion and Development/he World Bank or the governments they represent.
he World Bank does not guarantee the accuracy of the data included in this work. he boundar-ies, colors, denominations, and other information shown on any map in this work do not imply any judgment on the part of he World Bank concerning the legal status of any territory or the endorse-ment or acceptance of such boundaries.
Rights and Permissions
he material in this publication is copyrighted. Copying and/or transmitting portions or all of this work without permission may be a violation of applicable law. he International Bank for Reconstruction and Development/he World Bank encourages dissemination of its work and will normally grant permission to reproduce portions of the work promptly.
For permission to photocopy or reprint any part of this work, please send a request with complete information to the Copyright Clearance Center Inc., 222 Rosewood Drive, Danvers, MA 01923, USA; telephone: 978-750-8400; fax: 978-750-4470; Internet: www.copyright.com.
All other queries on rights and licenses, including subsidiary rights, should be addressed to the Oice of the Publisher, he World Bank, 1818 H Street NW, Washington, DC 20433, USA; fax: 202-522-2422; e-mail: [email protected].
If you have any questions or comments about this report, please contact:
International Trade Department he World Bank
1818 H Street NW, Room MSN G4-176, Washington, DC 20433 USA Telephone: 202-473-8922
E-mail: [email protected]
Web site: www.worldbank.org, www.worldbank.org/trade, or www.worldbank.org/lpi
Foreword
his is the third edition of Connecting to Com-pete: Trade Logistics in the Global Economy. At its heart is the Logistics Performance Index (LPI), which the World Bank has produced every two years since 2007. he LPI measures on-the-ground trade logistics performance — this year, in 155 countries — helping national leaders, key policymakers, and private sector traders understand the challenges they and their trading partners face in reducing logistical bar-riers to international commerce.
Logistics, organizing the movement of goods over time and space, has evolved from its 19th century military roots to today’s in-ternational supply chains. As the backbone of international trade, logistics encompasses freight transportation, warehousing, border clearance, payment systems, and many other functions. These functions are performed mostly by private service providers for private traders and owners of goods, but logistics is also important for the public policies of na-tional governments and regional and interna-tional organizations.
Because global supply chains are so var-ied and complex, the eiciency of logistics de-pends on government services, investments, and policies. Building infrastructure, develop-ing a regulatory regime for transport services, and designing and implementing eicient cus-toms clearance procedures are all areas where governments play an important role. he im-provements in global logistics over the past two decades have been driven by innovation and a great increase in global trade. While poli-cies and investments that enable good logistics practices help modernize the best-performing countries, logistics still lags in many developing countries. Indeed, the “logistics gap” evident in the irst two editions of this report remains.
he tremendous importance of logistics per-formance for economic growth, diversiication, and poverty reduction has long been widely rec-ognized. Policies matter: national governments can facilitate trade through investments in both “hard” and “sot” infrastructure. Countries have improved their logistics performance by imple-menting strategic and sustained interventions, mobilizing actors across traditional sector silos, and involving the private sector. Logistics is also increasingly important for sustainability. For the irst time, the LPI this year includes a focus on the environmental impacts of logistics practices.
he LPI provides a simple, global bench-mark to measure logistics performance, fill-ing gaps in datasets by providfill-ing systematic, cross-country comparisons. A joint venture of the World Bank, logistics service providers, and academics, the LPI is built around a sur-vey of logistics professionals. By asking freight forwarders to rate countries on key logistics issues — such as customs clearance eiciency, infrastructure quality, and the ability to track cargo — it captures a broad set of elements that afect perceptions of the eiciency of trade logis-tics in practice. It is a “coarse-grained” indica-tor that shows where a country stands and that could motivate researchers to take on a deeper, iner, country-speciic assessment of the deter-minants of logistics performance. LPI scores should not be overvalued — a country’s LPI score is less relevant than its quintile (whether it is among the best or worst performing countries or is somewhere in the middle). he authors use conidence intervals to examine the sensitivity of each country’s LPI score.
might not fully capture changes at the country level. he LPI complements, rather than substi-tutes for, the in-depth country assessments that many countries have undertaken in recent years, many of them with World Bank support.
Trade analysts, policymakers, and practi-tioners interested in measuring logistics per-formance all use the LPI. he World Bank and other international organizations are using it more and more in their advisory and imple-mentation activities for trade facilitation in developing countries. he LPI allows leaders in
government, business, and civil society to bet-ter assess the competitive advantage created by good logistics and to understand the varying importance of diferent intervention areas. We hope that this third edition of Connecting to Compete will continue to help this broad com-munity of policymakers and stakeholders.
Authors and acknowledgments
his report was prepared by the World Bank’s International Trade Department (PRMTR), under the guidance of Bernard Hoekman (director) and Mona Haddad (sector manager). he project leaders and main authors were Jean-François Arvis ([email protected]) and Monica Alina Mustra (Mmustra@worldbank. org). Authors included Professor Lauri Ojala (Turku School of Economics, University of Turku; [email protected]), Ben Shepherd (Principal, Developing Trade Consultants; [email protected]), and Daniel Saslavsky ([email protected]).
Many colleagues at the World Bank pro-vided major inputs to the survey concept and the review of the results or provided materials, including Robin Carruthers, Natalia Cubillos, Marc Juhel, Charles Kunaka, Somik Lall, An-dreas Dietrich Kopp, Gerard McLinden, Julia Burr Oliver, Gaël Raballand, Julian Lampi-etti, Henry Sandee, Jordan Schwartz, Virginia Tanase, and Jos Verbeek. Selina Elisabeth Jackson, Mombert Hoppe, Jean Noel Guillos-sou, Ekaterina Vashakmadze, Giovanna Pren-nushi, Ivan Rossignol, Vijay Srinivas Tata, Saroj Kumar Jha, Yvonne Tsikata, and Ardo Hansson also contributed to the review of the results.
The authors are also grateful to external colleagues for their support and contributions, including Yann Duval (United Nations Eco-nomic and Social Commission for Asia and the
Paciic), Jari Kauppila (International Transport Forum), and Louis-Paul Tardif (Transport Can-ada). Daniel Cramer of BlueTundra.com de-signed, developed, and maintained the LPI sur-vey and results websites (the web-based sursur-vey questionnaire was ofered in English, French, Spanish, Chinese, and Russian), under the guidance of the core team. Scott Johnson from the World Bank Information Solutions Group helped the team monitor survey responses.
he LPI survey would not have been possi-ble without the support and participation of the International Federation of Freight Forwarders Associations (www.iata.com), the Global Ex-press Association (www.global-exEx-press.org), the Global Facilitation Partnership for Trans-portation and Trade (www.gfptt.org), 10 inter-national logistics companies, and a large group of small and medium logistics companies world-wide. he survey was designed and implemented with Finland’s Turku School of Economics, University of Turku (www.tse.i/en), which has worked with the World Bank to develop the concept since 2000.
Foreword iii
Authors and acknowledgments v LPI ranking and scores, 2012 viii
Summary and key findings 1
1. The 2012 Logistics Performance Index 5 New features of the 2012 survey 6
Key indings from the 2012 LPI 6
2. Unbundling logistics performance 15 Infrastructure 15
Services 15
Border procedures and time 17
Delays, reliability, and service delivery 22
3. The way forward: New challenges in trade facilitation and logistics 27 Infrastructure 28
Improving logistics services in developing countries 28 Coordinating border management 29
Regional facilitation and integration 30 National data for reforms 30
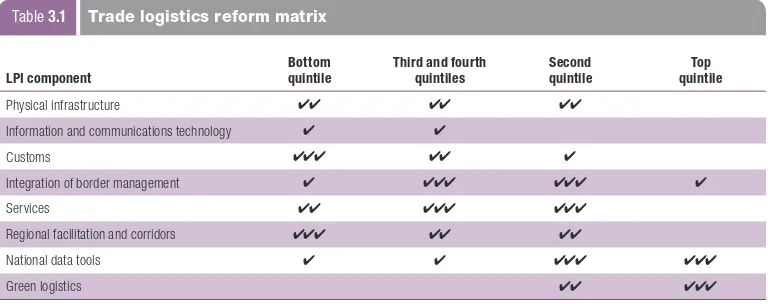
Supply chain sustainability and development 30 A trade logistics reform matrix 32
Notes 35
Appendix 1. International LPI results 36
Appendix 2. Domestic LPI results, by region and income group 40 Appendix 3. Domestic LPI results, time and cost data 43
Appendix 4. The LPI methodology 51
References 55
Boxes
1.1 Better logistics — a piece of the global food security puzzle 6 1.2 Using the Logistics Performance Index 7
1.3 Indonesia’s logistics progress 10
1.4 How precise are LPI scores and ranks? 14
2.1 Innovative approaches to border agency cooperation: the Philippines and Indonesia 20 2.2 Customs reform in Sub- Saharan Africa: Cameroon Customs’ key performance indicators 20 2.3 Who is to blame for delays? 24
3.1 Beyond the LPI: Canada’s efort to develop in-depth, customized data collection 31 3.2 A shipper’s demand for green supply chain solutions 32
Figures
1 LPI score as percentage of highest LPI score by LPI quintile, 2007, 2010, and 2012 2
2 Percentage change in LPI component as measured against the highest performer, 2007–2012 2 1.1 Cumulative distribution of 2012 LPI scores 10
1.2 LPI component scores, by LPI quintile 11
1.3 Percentage change in LPI scores over 2007–2012, by LPI component and income group 11 1.4 2012 LPI score, average and minimum/maximum range by income group 12
1.5 Distribution of LPI quintiles across income groups 12 1.6 LPI overperformers and underperformers 13
1.7 LPI score as percentage of highest LPI score by LPI quintile, 2007, 2010, and 2012 13
2.1 Relationship between country scores on the World Bank Air Connectivity Index and the percent of respondents rating the quality and competence of air transport service providers as “high” or “very high” 17
2.2 Median import lead time and average clearance time, by LPI quintile 18 2.3 Median export lead time, by LPI quintile 19
2.4 Median export lead time, by income group 19
2.5 Red tape afecting import and export transactions, by LPI quintile 21
2.6 Respondents reporting that shipments are “oten” or “nearly always” cleared and delivered as scheduled, by LPI quintile 23 2.7 Respondents reporting that shipments are “oten” or “nearly always” cleared and delivered as scheduled, by World Bank
developing country region 23
2.8 Shipments not meeting company quality criteria, by LPI quintile 24
Tables
1.1 he top 10 performers on the 2012 LPI 8 1.2 he bottom 10 performers on the 2012 LPI 8
1.3 he top 10 upper middle-income performers on the 2012 LPI 8 1.4 he top 10 lower middle-income performers on the 2012 LPI 9 1.5 he top 10 low-income performers on the 2012 LPI 9
1.6 Respondents indicating an improved or much improved logistics environment since 2009, by LPI quintile 12 2.1 Respondents rating the quality of each infrastructure type “high” or “very high,” by LPI quintile 16
2.2 Respondents rating the quality of each infrastructure type “high” or “very high,” by World Bank developing country region 16
2.3 Respondents rating the quality and competence of each service provider type “high” or “very high,” by LPI quintile 16 2.4 Diference between respondents rating services “high” or “very high” and those rating infrastructure “high” or “very high,”
by World Bank developing country region 17
2.5 Respondents indicating that listed customs procedures are available and being used, by LPI quintile 18
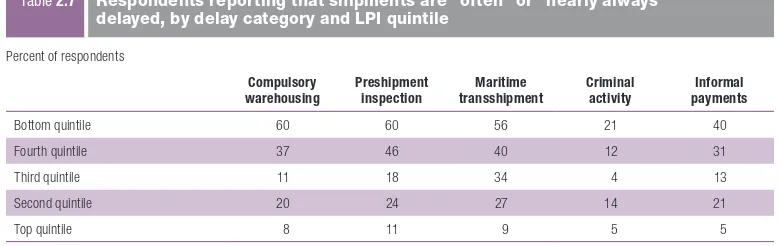
2.6 Respondents rating the quality and competence of three border agencies as “high” or “very high,” by LPI quintile 21 2.7 Respondents reporting that shipments are “oten” or “nearly always” delayed, by delay category and LPI quintile 22 3.1 Trade logistics reform matrix 32
Economy
Singapore 1 4.13 100.0 Hong Kong SAR, China 2 4.12 99.9 Finland 3 4.05 97.6 Germany 4 4.03 97.0 Netherlands 5 4.02 96.7 Denmark 6 4.02 96.6 Belgium 7 3.98 95.3 Japan 8 3.93 93.8 United States 9 3.93 93.7 United Kingdom 10 3.90 92.7 Austria 11 3.89 92.5 France 12 3.85 91.2 Sweden 13 3.85 91.2 Canada 14 3.85 91.1 Luxembourg 15 3.82 90.3 Switzerland 16 3.80 89.7 United Arab Emirates 17 3.78 88.9 Australia 18 3.73 87.2 Taiwan, China 19 3.71 86.6 Spain 20 3.70 86.4 Korea, Rep. 21 3.70 86.2 Norway 22 3.68 85.9 South Africa 23 3.67 85.5 Italy 24 3.67 85.4 Ireland 25 3.52 80.6 China 26 3.52 80.5 Turkey 27 3.51 80.3 Portugal 28 3.50 80.1 Malaysia 29 3.49 79.8 Poland 30 3.43 77.8 New Zealand 31 3.42 77.4 Iceland 32 3.39 76.6 Qatar 33 3.32 74.3 Slovenia 34 3.29 73.1 Cyprus 35 3.24 71.8 Bulgaria 36 3.21 70.7 Saudi Arabia 37 3.18 69.7 Thailand 38 3.18 69.6 Chile 39 3.17 69.5 Hungary 40 3.17 69.5 Tunisia 41 3.17 69.4 Croatia 42 3.16 69.2 Malta 43 3.16 69.0 Czech Republic 44 3.14 68.5 Brazil 45 3.13 68.2 India 46 3.08 66.4 Mexico 47 3.06 66.0 Bahrain 48 3.05 65.7 Argentina 49 3.05 65.5 Morocco 50 3.03 65.0 Slovak Republic 51 3.03 64.9 Philippines 52 3.02 64.8
Economy
Vietnam 53 3.00 64.1 Romania 54 3.00 63.8 Bosnia and Herzegovina 55 2.99 63.5 Uruguay 56 2.98 63.5 Egypt, Arab Rep. 57 2.98 63.3 Lithuania 58 2.95 62.3 Indonesia 59 2.94 62.2 Peru 60 2.94 61.9 Panama 61 2.93 61.6 Oman 62 2.89 60.4 Yemen, Rep. 63 2.89 60.3 Colombia 64 2.87 59.8 Estonia 65 2.86 59.5 Ukraine 66 2.85 59.3 Benin 67 2.85 59.3 Botswana 68 2.84 58.9 Greece 69 2.83 58.6 Kuwait 70 2.83 58.5 Pakistan 71 2.83 58.4 Mauritius 72 2.82 58.2 Malawi 73 2.81 57.8 Guatemala 74 2.80 57.7 Serbia 75 2.80 57.6 Latvia 76 2.78 56.9 Georgia 77 2.77 56.8 Albania 78 2.77 56.7 Ecuador 79 2.76 56.2 Bahamas, The 80 2.75 56.1 Sri Lanka 81 2.75 56.0 Costa Rica 82 2.75 55.9 Côte d’Ivoire 83 2.73 55.4 Madagascar 84 2.72 55.1 Dominican Republic 85 2.70 54.4 Kazakhstan 86 2.69 54.2 Niger 87 2.69 54.1 Tanzania 88 2.65 52.9 Namibia 89 2.65 52.9 Bolivia 90 2.61 51.6 Belarus 91 2.61 51.6 Syrian Arab Republic 92 2.60 51.3 El Salvador 93 2.60 51.2 Guinea-Bissau 94 2.60 51.1 Russian Federation 95 2.58 50.7 Lebanon 96 2.58 50.6 Togo 97 2.58 50.5 Central African Republic 98 2.57 50.3 Macedonia, FYR 99 2.56 50.1 Armenia 100 2.56 50.0 Cambodia 101 2.56 50.0 Jordan 102 2.56 49.8 Zimbabwe 103 2.55 49.6 Maldives 104 2.55 49.4
Economy
Honduras 105 2.53 49.1 Cameroon 106 2.53 48.9 Bhutan 107 2.52 48.6 Ghana 108 2.51 48.2 Lao PDR 109 2.50 48.0 Senegal 110 2.49 47.7 Venezuela, RB 111 2.49 47.7 Iran, Islamic Rep. 112 2.49 47.6 Paraguay 113 2.48 47.4 São Tomé and Príncipe 114 2.48 47.4 Guinea 115 2.48 47.4 Azerbaijan 116 2.48 47.4 Uzbekistan 117 2.46 46.9 Gambia, The 118 2.46 46.8 Liberia 119 2.45 46.3 Montenegro 120 2.45 46.3 Nigeria 121 2.45 46.3 Kenya 122 2.43 45.9 Fiji 123 2.42 45.4 Jamaica 124 2.42 45.3 Algeria 125 2.41 45.3 Solomon Islands 126 2.41 45.2 Mauritania 127 2.40 44.7 Papua New Guinea 128 2.38 44.0 Myanmar 129 2.37 43.8 Kyrgyz Republic 130 2.35 43.3 Gabon 131 2.34 43.0 Moldova 132 2.33 42.6 Guyana 133 2.33 42.5 Burkina Faso 134 2.32 42.3 Afghanistan 135 2.30 41.5 Tajikistan 136 2.28 41.1 Libya 137 2.28 41.0 Angola 138 2.28 40.8 Rwanda 139 2.27 40.5 Mongolia 140 2.25 40.0 Ethiopia 141 2.24 39.6 Lesotho 142 2.24 39.5 Congo, Dem. Rep. 143 2.21 38.6 Cuba 144 2.20 38.3 Iraq 145 2.16 37.1 Comoros 146 2.14 36.5 Eritrea 147 2.11 35.5 Sudan 148 2.10 35.3 Congo, Rep. 149 2.08 34.7 Sierra Leone 150 2.08 34.5 Nepal 151 2.04 33.1 Chad 152 2.03 32.9 Haiti 153 2.03 32.8 Djibouti 154 1.80 25.5 Burundi 155 1.61 19.5
This third edition of Connecting to Compete: Trade Logistics in the Global Economy reports on the Logistics Performance Index (LPI) and its six component indicators. The LPI mea-sures logistics efficiency, now widely recog-nized as vital for trade and growth. A coun-try’s ability to trade globally depends on its traders’ access to global freight and logistics networks. And the efficiency of a country’s supply chain (in cost, time, and reliability) depends on specific features of its domestic economy (logistics performance). Better over-all logistics performance and trade facilita-tion are strongly associated with trade expan-sion, export diversification, attractiveness to foreign direct investment, and economic growth.
A multidimensional assessment of logistics performance, the LPI compares the trade logis-tics proiles of 155 countries and rates them on a scale of 1 (worst) to 5 (best). he ratings are based on 6,000 individual country assessments by nearly 1,000 international freight forward-ers, who rated the eight foreign countries their company serves most frequently. he LPI’s six components include:1
• he eiciency of the clearance process (speed, simplicity, and predictability of formalities) by border control agencies, including customs.
• he quality of trade- and transport-re-lated infrastructure (ports, railroads, roads, information technology).
• The ease of arranging competitively priced shipments.
• he competence and quality of logistics services (transport operators, customs brokers).
• he ability to track and trace consign-ments.
• he frequency with which shipments reach the consignee within the sched-uled or expected delivery time.
Connecting to Compete 2012 also includes a set of domestic performance indicators for 143 countries. For these data, survey respondents as-sess the logistics environments in the countries where they work, providing information on the quality of infrastructure, the performance of core services, the friendliness of trade clearance procedures, and the time, cost, and reliability of import and export supply chains. hese domes-tic indicators help deine logisdomes-tics constraints within countries, not just at the gateways, such as ports or borders. hey analyze the major de-terminants of overall logistics performance, fo-cusing on country performance in four major determinants of overall logistics performance: infrastructure, services, border procedures and time, and supply chain reliability.
The gap between the highest and lowest scores in the 2012 LPI, and the score distribu-tion across countries, are about the same as in 2010 (igure 1). Singapore ranked highest at 4.13, Burundi the lowest at 1.61 (19 percent of Singapore’s top score).
he 2012 LPI does not suggest that the con-verging trend from the 2007 LPI to the 2010 LPI is continuing. From 2007 to 2010, lower performing countries improved their overall LPI scores more than did higher performing countries. But from 2010 to 2012, they were not able to further narrow the gap.
infrastructure stands out
as the chief driver of LPi
progress, with the modest
convergence since 2007
explained by a perceived
improvement in the
infrastructure of low- and
middle-income countries
customs indicators could relect an unusual focus on revenue collection at the expense of trade facilitation.
he “logistics gap” between high- and low-income countries remains wide. he countries with the worst performance in 2012 were least developed countries that were also landlocked countries, small-island states, or postconlict countries. Making up three-fourths of the bottom LPI quintile, these countries typically have small trade volumes, are far from trade hubs, and are hampered by severe capacity con-straints. Adding to their diiculties — on top of their reform challenges and their lack of scale-economies for infrastructure and services — is their dependence on the logistics of similarly constrained neighboring countries.
Despite the broad association between low performance and diicult circumstances, the policies a country adopts are important. True, most high-income countries from the Organ-isation for Economic Co-operation and Devel-opment (OECD) are high logistics performers, but in other income groups some countries have had more efficient logistics than others over the three LPI surveys, including China, India, South Africa, and Vietnam. Among least devel-oped countries, it is harder to ind countries out-performing their income group. Benin jumped
from 89 in 2007 to 67 in 2012, however, per-haps reflecting traders’ satisfaction with the country’s new national single window system in the Port of Coutonou.
Morocco’s LPI rank jumped from 113 in 2007 to 50 in 2012, having implemented a com-prehensive strategy to improve logistics and con-nectivity and take advantage of the country’s proximity to Europe. Combining border man-agement reform with large physical investments in the Tangier-Med Port, the strategy fostered the emergence of Morocco’s just-in-time exports to Europe (especially textiles, electronics, and automotive components). Morocco’s fast rise in the LPI highlights the payofs of such a compre-hensive approach.
Reformers are seeing more and more that many modern logistics problems are entrenched — that there are no quick ixes. Reaping low-hanging fruit will not sustainably improve logistics in the ways that count most for trad-ers. he stagnancy of some performance in-dicators suggests that the source of problems is deeper than an errant regulation or a lack of equipment. In the 2012 LPI, infrastruc-ture stands out as the chief driver of progress (igure 2), with the modest convergence since 2007 explained by a perceived improvement in the infrastructure of low- and middle-income
Percent 2007 2010 2012
Source: Logistics Performance Index 2007, 2010, and 2012.
30
Figure1 LPI score as percentage of highest LPI score by LPI quintile, 2007, 2010, and 2012
0
Source: Logistics Performance Index 2007 and 2012. Figure2 Percentage change in LPI
component as measured against the highest performer, 2007–2012
The quality of logistics
services is central to
trade eficiency and
is strongly associated
with the reliability of
supply chains and the
predictability of service
delivery available to
producers and exporters countries — and to a lesser extent in their
logis-tics services and their customs and border man-agement. his perceived improvement attests to the success of donor eforts to close the infra-structure gap between high- and low-income countries.
he quality and availability of trade-related infrastructure, especially roads, still constrains logistics performance in developing countries, especially for countries with the lowest incomes. Yet countries nearer the middle of the LPI rankings are also hindered by the quality and availability of roads and ports. And railroads have low ratings almost everywhere. In develop-ing countries, rail services dissatisfy more than 90 percent of survey respondents.
Eicient border management and the co-ordination of the agencies involved in border clearance are more critical now than ever. Across income groups, customs agencies have higher LPI ratings than all other agencies involved in border management. But in many countries, the agencies responsible for enforcing sanitary and phytosanitary regulations — and to less ex-tent other product standards — lag well behind customs in their perceived performance. A com-prehensive approach is needed to reform border management, with attention to all the relevant sectors and agencies.
he quality of logistics services — trucking, forwarding, and customs brokerage — is also central to trade efficiency. Logistics services
generally have higher LPI ratings in 2012 than in 2010. Yet the gap between high-income coun-tries and developing councoun-tries remains wide. Low-income countries score poorly on truck-ing, despite trucking systems having recently attracted more policy attention.
Environmental sustainability concerns are emerging as a market driver. he 2012 LPI in-cludes a new survey question on the demand for green logistics. A third of respondents ship-ping to OECD countries recognized a strong demand for green solutions (meaning modes or routes), compared with just a tenth of those shipping to low-income economies. Developing countries will need to consider the environmen-tal footprint of logistics, especially in trading with developed countries.
The 2012 Logistics Performance Index
S
EC
T
IO
N
1
Freight transport and the accompanying logis-tics industry represent one of the most dynamic and important sectors of the European economy, accounting for at least 10 percent of GDP.
— Siim Kallas, Vice-President of the Eu-ropean Commission and EuEu-ropean Commis-sioner responsible for Transport, speaking at the Launch of the Green Freight Europe initiative in Brussels (March 2012).2
If CBP [the U.S. Customs and Border Protection agency] does not support a strong economy, we’re not doing our job.
— Brenda Brockman Smith, U.S. Executive Director, Trade Policy and Programs, Oice of International Trade, U.S. Customs and Border Protection, speaking at the 12th annual Trans-Paciic Maritime Conference (March 2012).3
Countries — and groups of countries — have adopted forward-looking logistics policies. In 2011, Morocco adopted a public-private char-ter on logistics development. South Africa pub-lishes a yearly state-of-logistics report. Indonesia and Malaysia have national logistics strategies. China is among the few countries with a bureau for logistics development. And the United States launched a Supply Chain Competitive-ness Council, in cooperation with its Chamber of Commerce, in fall 2011.
Such public support affirms the impor-tance of logistics services providers. he global network of logistics operators for international trade includes ocean shipping, air freight, land transport, warehousing, and third-party logis-tics. To keep global supply chains working un-interrupted, logistics services providers have had to both integrate and diversify. Key segments of the industry — air freight, container shipping, port operations, and contract logistics (or third/ fourth-party service providers) — have become
highly concentrated,4 especially since the eco-nomic downturn of 2008.5 Yet the industry is far less concentrated in local, traditional subsectors with low entry costs: trucking, traditional freight forwarding, and customs brokerage.
Global logistics requires that this ideally seam-less chain of service providers support the physi-cal movement of goods. But the ease with which a country’s exporters can access the global logistics network depends on domestic factors subject to government intervention. Governments can im-prove the regulation of logistics services, inance trade-related infrastructure (either directly or in public-private partnerships), and smooth trade procedures. Although eicient logistics and trade facilitation are central to national competitiveness, the simultaneous involvement of many sectors can create diiculties for sound policymaking.
Supply chain performance is measured in time, cost, reliability, and lexibility. But these outcomes depend on local inputs that afect the supply chain within a country. here are trade-related procedures. here is the supply for trade-related support services. And there is in-frastructure, which includes ports, roads, rail-roads, airports, and information and commu-nications technology (ICT).
A trade supply chain is only as strong as its weakest link. Progress in one area cannot always ofset a lack of progress elsewhere. So policy-makers must strengthen the weakest links with targeted development interventions. Interven-tions that target areas not among those in most need of reform waste scarce resources.
By showing countries
how they stack up against
their competitors and
highlighting the costs of
poor logistics, the LPi
helps policymakers and
the private sector build a
strong case for reform
Sound policymaking requires informed dia-logue with stakeholders, especially those in the private sector. Global benchmarks such as the Logistics Performance Index (LPI) play an im-portant informative role. By showing countries how they stack up against their competitors and highlighting the costs of poor logistics, the LPI catalyzes progress — helping policymakers and the private sector build a strong case for reform.
New features of the 2012 survey
The 2012 LPI survey is similar to the two before: a standardized questionnaire with two parts (international and domestic). For the international part, respondents assess six key areas of logistics performance in eight of the respondents’ main overseas markets. For the domestic part, respondents provide qualitative and quantitative data on the logistics environ-ment in the countries where they work — for example, information on time and costs in a typical supply chain (box 1.2). he survey also collects data on domestic logistics and on the time and cost burdens of import and export transactions. he private sector increased its
participation in the LPI: in 2012, there were about 6,000 assessments, some 20 percent more than in 2010. Country coverage for the interna-tional LPI remained the same as in 2010, cov-ering 155 countries.6 Country coverage for the domestic LPI has increased to 143 countries.
To continue streamlining the LPI survey, feedback from users, policymakers, practitio-ners, and logistics professionals was considered. Minor changes were made to the international part, in which respondents assess the same six key components in eight of their most impor-tant overseas markets. A new question on green logistics was introduced to capture how envi-ronmental concerns are changing how logistics operators work.7 he survey instrument for the 2012 LPI collects new information in the do-mestic part, too, providing more detail on such issues as border management (valuation). Fur-ther, new Incoterms
®
8 were used to collect time and cost information for a typical supply chain.Key indings from the 2012 LPI
As in the irst two editions of the LPI, high-income countries dominate the top 10
There is no global food shortage. in 2010, the world produced 2.2 billion tons of cereals, more than 2.5 times its production ive decades earlier. Food production outpaced population growth of 4 billion people, yet more than a billion people remain hungry or vulnerable to sharp changes in food prices. Why?
One answer is that transport and logistics do much to deter-mine food prices. in developing countries — especially landlocked least developed countries — transport and logistics costs are dispro-portionately high, accounting for 20–60 percent of delivered food prices. For example, transport and logistics make up 48 percent of the cost of U.S. corn imported by Nicaragua and 40 percent of the cost of U.S. wheat imported by Honduras.1 And an unreliable
supply chain can cause domestic price shocks when supply chain disruptions cause local supply shortages.
in February 2011, world food prices reached a record high. They remained volatile in the following months — months reminiscent of the devastating price swings of the 1970s. When such luctuations affect the price of cereals, which make up staple diets, the world’s poorest people suffer most. in 2010, for example, cereals consti-tuted 40 percent of the food imported by least developed countries. in many cases, improved food supply chains can mitigate this vulnerability. More eficient logistics can reduce consumer prices,
allow markets to respond quickly in a crisis, and increase access to food. A recent assessment of the wheat supply chain for coun-tries in the Middle East and North Africa — which are among the countries most dependent on grain imports — reveals many causes of high logistics costs and vulnerability.2 Product losses are high,
typically greater than 5 percent. Wheat’s average transit time from its main source markets to its target markets in Arab countries is 78 days, and the trip costs about $40 per metric ton. By contrast, the average transit time to target markets in the Netherlands is just 18 days, and the trip costs $11 per metric ton. (in the Republic of Korea, the average transit time is 47 days, and the trip costs $17 per metric ton.)
individual countries cannot do much to reduce certain costs — such as ocean freight costs, which can make up a large part of the inal price for grains and edible oils. Even so, policies can lower the costs of regional and domestic distribution by boost-ing overall logistics performance and by improvboost-ing the trade environment.
Notes
1. Fernández and others 2011. 2. World Bank and FAO 2012.
(table 1.1). Indeed, the top 10 for 2012 are nearly the same as for 2010.9 Most are well-established key logistics players with an important role in global or regional supply chains.
By contrast, the bottom 10 are all low- income countries, and 8 are in Africa (table 1.2). Geographic barriers — along with a history of unrest, armed conlict, and natural disasters — restrict these countries’ access to markets, thus constraining their ability to participate in global supply chains.
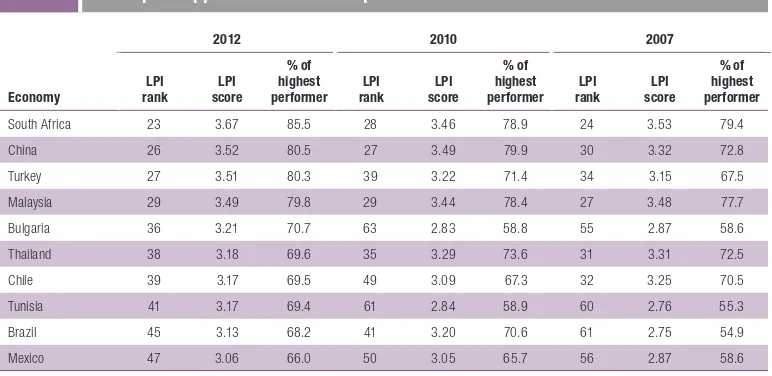
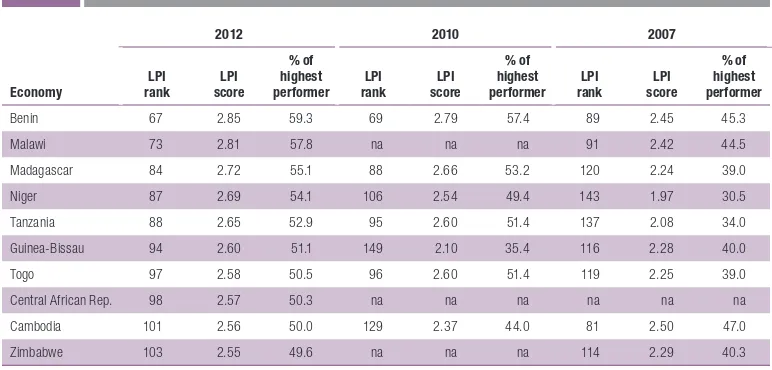
he broad middle- income group, comprising upper and lower middle- income countries, is led — as expected — by some of the rapidly growing emerging economies that dominate the upper half of the LPI rankings (tables 1.3 and 1.4). Benin is the top low-income performer (table 1.5).
Figure 1.1 shows the cumulative distribu-tion of LPI scores. he vertical lines indicate the boundaries of quintiles — ive groups con-taining equal numbers of countries rated in the LPI. he bottom quintile comprises countries
The World Bank’s Logistics Performance index (LPi) analyzes coun-tries in six components:
1. The efficiency of customs and border management clearance.
2. The quality of trade and transport infrastructure. 3. The ease of arranging competitively priced shipments. 4. The competence and quality of logistics services. 5. The ability to track and trace consignments.
6. The frequency with which shipments reach consignees within scheduled or expected delivery times.
The components were chosen based on recent theoretical and empirical research and on the practical experience of logistics pro-fessionals involved in international freight forwarding.
Earlier methodologies developed in 19931 used a survey
for-mat, a 2-point scale, and open-ended questions — to measure the perceived importance and inluence of different component attri-butes affecting the logistical friendliness of countries. in a follow-up study,2 only the characteristics identiied as best encapsulating
logistics performance were included for evaluation. The method-ology was reined with contributions from interviews conducted for the Trade and Transport Facilitation Audits performed by the World Bank and others over more than a decade.3
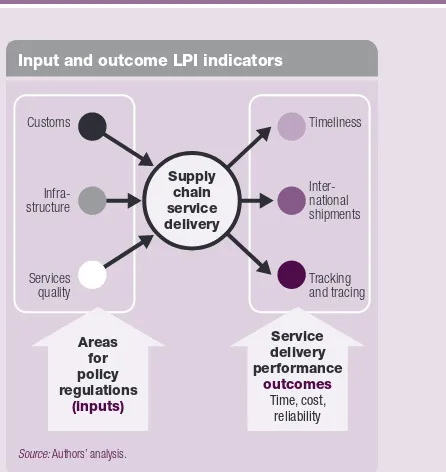
The igure maps the six LPi indicators in two main categories:
• Areas for policy regulation, indicating main inputs to the sup-ply chain (customs, infrastructure, and services).
• Supply chain performance outcomes (corresponding to LPi indicators of time, cost, and reliability — timeliness, interna-tional shipments, and tracking and tracing).
The LPi uses standard statistical techniques to aggregate the data into a single indicator.4 (See appendix 4 for a detailed
descrip-tion of how the LPi is calculated.) This single indicator can be used to compare countries, regions, and income groups. it can also be used for country-level work.
Because operators on the ground can best assess these vital aspects of logistics performance, the LPi relies on a structured online survey of logistics professionals from the companies re-sponsible for moving goods around the world: multinational freight forwarders and the main express carriers. Freight forwarders and
Input and outcome LPI indicators
Supply
Source: Authors’ analysis.
Service
express carriers are those best able to assess how countries per-form. And their views matter, directly affecting the choice of shipping routes and gateways and inluencing irms’ decisions on production location, choice of suppliers, and selection of target markets. Their participation is central to the quality and credibility of the LPi, and their involvement and feedback have been essential in developing and reining the survey in this third edition of the LPi. Nearly 1,000 lo-gistics professionals in 143 countries participated in the 2011 survey for the 2012 LPi, and 12 additional countries were covered.
See the 2012 LPi questionnaire at www.worldbank.org/lpi.
Notes
1. Murphy, Daley, and Dalenberg 1993; Murphy and Daley 1999. 2. Ojala and Queiroz 2000, 2004.
3. Raven 2001.
4. in all three editions of the LPi (2007, 2010, and 2012), statistical aggrega-tion has produced an overall index that is close to the simple average of country scores across the six LPi components.
Economy
Singapore 1 4.13 100.0 2 4.09 99.2 1 4.19 100.0 Hong Kong SAR, China 2 4.12 99.9 13 3.88 92.4 8 4.00 94.1 Finland 3 4.05 97.6 12 3.89 92.6 15 3.82 88.3 Germany 4 4.03 97.0 1 4.11 100.0 3 4.10 97.1 Netherlands 5 4.02 96.7 4 4.07 98.5 2 4.18 99.6 Denmark 6 4.02 96.6 16 3.85 91.4 13 3.86 89.6 Belgium 7 3.98 95.3 9 3.94 94.5 12 3.89 90.7 Japan 8 3.93 93.8 7 3.97 95.2 6 4.02 94.8 United States 9 3.93 93.7 15 3.86 91.7 14 3.84 89.1 United Kingdom 10 3.90 92.7 8 3.95 94.9 9 3.99 93.8
Source: Logistics Performance Index 2007, 2010, and 2012.
Table 1.1 The top 10 performers on the 2012 LPI
Economy
Comoros 146 2.14 36.5 120 2.45 46.5 85 2.48 46.3 Eritrea 147 2.11 35.5 154 1.70 22.4 124 2.19 37.2 Sudan 148 2.10 35.3 146 2.21 38.7 64 2.71 53.6 Congo, Rep. 149 2.08 34.7 116 2.48 47.4 na na na Sierra Leone 150 2.08 34.5 153 1.97 31.2 144 1.95 29.9 Nepal 151 2.04 33.1 147 2.20 38.6 130 2.14 35.7 Chad 152 2.03 32.9 115 2.49 47.9 142 1.98 30.8 Haiti 153 2.03 32.8 98 2.59 51.1 123 2.21 38.0 Djibouti 154 1.80 25.5 126 2.39 44.8 145 1.94 29.5 Burundi 155 1.61 19.5 na na na 113 2.29 40.4
na is not applicable.
Source: Logistics Performance Index 2007, 2010, and 2012.
Table 1.2 The bottom 10 performers on the 2012 LPI
Economy
South Africa 23 3.67 85.5 28 3.46 78.9 24 3.53 79.4 China 26 3.52 80.5 27 3.49 79.9 30 3.32 72.8 Turkey 27 3.51 80.3 39 3.22 71.4 34 3.15 67.5 Malaysia 29 3.49 79.8 29 3.44 78.4 27 3.48 77.7 Bulgaria 36 3.21 70.7 63 2.83 58.8 55 2.87 58.6 Thailand 38 3.18 69.6 35 3.29 73.6 31 3.31 72.5 Chile 39 3.17 69.5 49 3.09 67.3 32 3.25 70.5 Tunisia 41 3.17 69.4 61 2.84 58.9 60 2.76 55.3 Brazil 45 3.13 68.2 41 3.20 70.6 61 2.75 54.9 Mexico 47 3.06 66.0 50 3.05 65.7 56 2.87 58.6
Source: Logistics Performance Index 2007, 2010, and 2012.
with the lowest LPI scores and the top quintile those with the highest LPI scores.
The distribution of LPI scores is broken down into four categories, used in all editions of Connecting to Compete:
• Logistics unriendly — includes countries with severe logistics constraints, such as the least developed countries (bottom LPI quintile).
• Partial performers — includes coun-tries with a level of logistics constraints most often seen in low- and middle- income countries (fourth and third LPI quintiles).
• Consistent performers — includes coun-tries rated for logistics performance more highly than most others in their income group (second LPI quintile).
• Logistics friendly — includes high per-formers, mostly high-income countries (top LPI quintile).
Logistics performance does not improve overnight
Trade facilitation is crucial to economic devel-opment. Countries with better logistics can grow faster, become more competitive, and increase their investment. Boosting logistics Economy
2012 LPI 2010 LPI 2007 LPI
LPI Philippines 52 3.02 64.8 44 3.14 68.8 65 2.69 52.9 Vietnam 53 3.00 64.1 53 2.96 63.1 53 2.89 59.2 Egypt, Arab Rep. 57 2.98 63.3 92 2.61 51.8 97 2.37 43.0 Indonesia 59 2.94 62.2 75 2.76 56.5 43 3.01 63.0 Yemen, Rep. 63 2.89 60.3 101 2.58 50.8 112 2.29 40.4 Ukraine 66 2.85 59.3 102 2.57 50.6 73 2.55 48.7 Pakistan 71 2.83 58.4 110 2.53 49.1 68 2.62 50.7
na is not applicable.
Source: Logistics Performance Index 2007, 2010, and 2012.
Table 1.4 The top 10 lower middle-income performers on the 2012 LPI
Economy Madagascar 84 2.72 55.1 88 2.66 53.2 120 2.24 39.0 Niger 87 2.69 54.1 106 2.54 49.4 143 1.97 30.5 Tanzania 88 2.65 52.9 95 2.60 51.4 137 2.08 34.0 Guinea-Bissau 94 2.60 51.1 149 2.10 35.4 116 2.28 40.0 Togo 97 2.58 50.5 96 2.60 51.4 119 2.25 39.0 Central African Rep. 98 2.57 50.3 na na na na na na Cambodia 101 2.56 50.0 129 2.37 44.0 81 2.50 47.0 Zimbabwe 103 2.55 49.6 na na na 114 2.29 40.3
na is not applicable.
Source: Logistics Performance Index 2007, 2010, and 2012.
performance in low-income countries to the middle- income average could expand trade some 15 percent.10 That would benefit both irms and consumers, who would receive lower prices and better services.
For such sustained improvement, policy-makers and private stakeholders must commit long term to comprehensive reforms (box 1.3).
To move products to market eiciently, reliably, and economically, countries must reduce trad-ing costs, make their exports more competitive, and adopt policies to support trade. Reform-ing trade facilitation can especially help bolster trade competitiveness.11
In the international LPI, there are marked dif-ferences by component and quintile — especially
1.5 2.0 2.5 3.0 3.5 4.0 0.0
0.2 0.4 0.6 0.8
Source: Logistics Performance Index 2012.
Figure1.1 Cumulative distribution of 2012 LPI scores
Cumulative density
Third quintile
Logistics unfriendly
LPI score 1.0
Top quintile
Logistics friendly Bottom quintile Fourth
quintile Partial performers
Consistent performers Second quintile
Leaders in indonesia have used LPi data to monitor government performance and improve logistics — raising national awareness and jumpstarting projects to make the country’s main port more eficient. Shortly after Connecting to Compete 2007 was pub-lished,1 indonesia launched an ambitious public and private
dia-logue on trade facilitation and logistics. The country prepared an action plan examining the costs of international trade through its ports and the unique logistics costs of a large archipelago. it used the domestic logistics costs component of the LPi to measure Ministry of Trade performance, and after 2010 it used the overall LPi score.
in 2008, the World Bank suggested ways to improve operations at Tanjung Priok, which handles two-thirds of indonesia’s interna-tional trade and has seen a rapid rise in container trafic. A main goal of the port initiative is to reduce dwell time — the average time it takes containers to clear the port. in 2011, Tanjung Priok’s dwell time was six days, longer than indonesia’s regional peers (Singapore one day, Malaysia four days, Thailand ive days). To reduce dwell time, the port operator raised storage fees (to discourage shippers from
leaving containers for long periods) and introduced a new informa-tion technology system (to better monitor and direct port trafic). A scheduled expansion of the port is expected to double its container capacity by 2017.
But neither storage fees nor trafic monitoring will substantially reduce delays at Tanjung Priok.2 On arriving there, an import
con-tainer spends most of its wait time — about three and a half days — in preclearance (the time between unloading a container from the ship and submitting import declarations to customs). Cumbersome pre-customs clearance procedures cause much of the delay, and late submission of the shipping manifest by shippers and import-ers contributes, too.
The World Bank is working with indonesia to establish a port community (with public and private sector participants) where lead-ers can discuss, monitor, and follow up on reform efforts.
Notes
1. Arvis and others 2007.
2. Sandee, Oliver, and Cubillos Salcedo 2012.
As overall logistics
performance improves,
customs and other border
agencies improve faster
than do other aspects of
logistics performance in the two lowest quintiles (igure 1.2). In these
two quintiles, the two components that lag be-hind the rest are the eiciency of customs and border management clearance (component 1) and the competence and quality of logistics services (component 4). In the same two quintiles, the two components that outperform the rest are the ease of arranging competitively priced shipments (component 3) and the frequency with which shipments reach consignees within scheduled or expected delivery times (component 6).
As overall logistics performance improves, customs and other border agencies improve faster than do other aspects of logistics perfor-mance. Infrastructure lags in the two lowest quintiles, reflecting the continuing need for hard infrastructure investments in developing nations — especially the poorest.
Over 2007–2012, the two lowest quintiles have progressed the fastest in two components: the eiciency of customs and border manage-ment clearance (component 1) and the quality
2.0 2.5 3.0 3.5 4.0 4.5
Top quintile Second quintile
Third quintile Fourth quintile
Bottom quintile LPI score
Source: Logistics Performance Index 2012.
Figure1.2 LPI component scores, by LPI quintile
Customs Infrastructure Ease of Quality of logistics Tracking and Timeliness arranging shipments and services tracing
0 2 4 6 8 10 12
High income OECD High income
non-OECD Upper middle
income Lower middle
income Low
income Percentage change
Source: Logistics Performance Index 2007 and 2012.
Figure1.3 Percentage change in LPI scores over 2007–2012, by LPI component and income group
of trade and transport infrastructure (compo-nent 2; igure 1.3). For low-income countries, streamlining border clearance procedures and ensuring physical access to markets are neces-sary for closing basic capacity deicits. By con-trast, upper middle- income countries and, to less extent, lower middle- income countries, have progressed the fastest in the competence and quality of logistics services (component 4). Indeed, middle- income countries have shited their emphasis from basic hard infrastructure investments to soft infrastructure improve-ments based on regulatory reform.
Changes in the logistics environment are not one-dimensional. Rather, they vary by income
group and LPI quintile. From the percentage of LPI survey respondents in each quintile who say that particular elements of the logistics environ-ment are improved or much improved in 2012 over 2010 (table 1.6), perceived progress is much greater in the upper two LPI quintiles. Also, de-spite continued progress, the pace of improve-ment has slowed substantially in the two lowest quintiles — especially in the bottom quintile.
The “logistics gap” persists
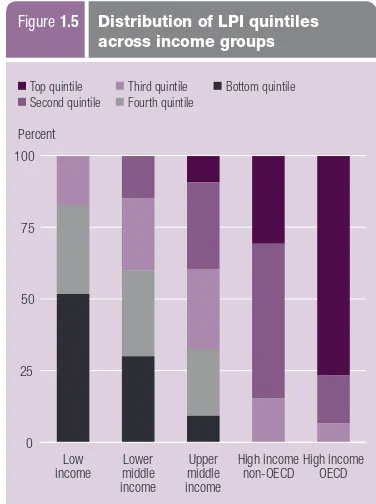
On average, LPI scores remain much higher for high-income countries than for poorer ones (figure 1.4). High-income countries outper-form low-income countries by 43 percent, lower middle- income countries by 34 percent, and upper middle- income countries by 24 percent. Among high- income OECD countries, almost 80 percent are ranked in the top quintile in terms of logistics performance worldwide (igure 1.5).
Income alone does not explain logistics performance
Despite the persistent logistics gap, income alone cannot explain why performance var-ies widely among countrvar-ies in certain income groups — particularly in the low- and middle- income groups. High-income countries are
1
Note: Vertical rules show minimum/maximum range.
Source: Logistics Performance Index 2012.
Figure1.4 2012 LPI score, average and minimum/maximum range
Source: Logistics Performance Index 2012.
Figure1.5 Distribution of LPI quintiles across income groups
Top quintile
Bottom quintile Fourth quintile Third quintile Second quintile Top quintile
Customs 27 43 63 57 65 Other border procedures 22 31 41 48 52 Transport infrastructure 41 40 54 47 56 ICT infrastructure 67 65 71 79 68 Private logistics services 53 70 71 74 67 Logistics regulation 26 31 39 36 41 Incidence of corruption 12 35 36 35 37
ICT is information and communications technology.
Source: Logistics Performance Index 2012.
income alone cannot
explain why performance
varies widely among
countries in certain
income groups—
particularly in the low- and
middle-income groups
heavily concentrated in the top LPI quintile, but other income groups are more dispersed. Upper middle- income and lower middle- income coun-tries range from the bottom LPI quintile to the top. Even low-income countries range across all but the top quintile (see igure 1.5).
Against others in their income group, the most overperforming non-high-income countries are Vietnam, India, China, and South Africa (igure 1.6).12 he most under performing non-high-income countries are Djibouti, Republic of Congo, Iraq, Angola, Cuba, Montenegro, Libya, Gabon, República Bolivariana de Venezuela, and the Russian Federation. he dispersion within income groups suggests that policy, as well as in-come, afects logistics performance.
Despite the marked variation within income groups, caution should be taken when interpret-ing LPI scores to identify overperforminterpret-ing and underperforming countries. For example, in a large, diverse country, a high score might not in-dicate uniformly strong performance.
The gap between the best and worst relative LPI scores is about the same as in 2010
Another measure to compute underlying changes in performance, introduced in 2010, is the relative LPI score. he relative LPI score is obtained by normalizing the LPI score: Relative
LPI = 100 × [ LPI – 1] / [LPI highest – 1]. hus, the best performer has the maximum relative LPI score of 100 percent (Singapore). For 2012, the worst relative performer is Burundi, with a relative LPI score of 19 percent. he distance between the best and worst relative performers in 2012 is about the same as in 2010 (though far smaller than in 2007; igure 1.7). High per-formers remain strong, while developing coun-tries are slowly catching up. Yet the gap between
5 6 7 8 9 10 11 12
Note: Fitted values are based on an ordinary least squares regression using data for all countries. Underperformers (black diamonds) are the non-high-income countries with the 10 smallest residuals. Overperformers (black circles) are the non–high-income countries with the 10 largest residuals.
Source: Logistics Performance Index 2012.
Figure1.6 LPI overperformers and underperformers
Log of GDP per capita (US$)
Vietnam
Percent 2007 2010 2012
Source: Logistics Performance Index 2007, 2010, and 2012.
30
the highest performing countries and the low-est performing countries is still wide, and nar-rowing it will require substantial time and resources.
The correlation between countries’ 2010 and 2012 LPI scores is about 90 percent, and the corresponding rank correlation about 85 percent. Although some changes in countries’ ranks and scores appear large at irst glance, the LPI is as subject to sampling error as any other survey-based dataset. Only when conidence in-tervals for 2010 and 2012 do not overlap should a statistically signiicant change — positive or negative — be concluded (box 1.4).
Recognizing the importance of trade facili-tation and logistics, policymakers are aiming to put in place the structures that boost perfor-mance. Since the World Bank launched the LPI and its component indicators in 2007, they have rapidly gained acceptance among policymakers and professionals — nationally, regionally, and globally (box 1.5).
Although the LPi and its components now offer the most compre-hensive and comparable data on country logistics and trade facilita-tion environments, they have a limited domain of validity. First, the experience of international freight forwarders might not represent the broader logistics environment in poor countries, which often rely on traditional operators. international and traditional operators might differ in their interactions with government agencies — and in their service levels. Most agents and afiliates of international networks in developing countries serve large companies, which perform at different levels — including for time and costs — than do traditional trading networks.
Second, for landlocked countries and small-island states, the LPi might relect access problems outside the country assessed, such as transit dificulties. The low rating of a landlocked country, such as Rwanda, might not adequately relect its trade facilitation reform efforts. Rwanda’s trade must continue to depend on long international transit routes through Tanzania, Kenya, and Uganda.
To account for the sampling error created by the LPi’s sur-vey-based dataset, LPi scores are presented with approximate
80 percent conidence intervals (see appendix 4). These intervals yield upper and lower bounds for a country’s LPi score and rank.1
Conidence intervals must be examined carefully to determine whether a change in score or a difference between two scores is statistically signiicant. A statistically signiicant improvement in a country’s performance should be concluded only if the lower bound of its 2012 LPi score exceeds the upper bound of its 2010 score.
Because of the LPi’s limited domain of validity and the need for conidence intervals to account for sampling error, a country’s exact ranking might be less relevant to policymakers than its proximity to others in a wider performance group or its statistically signiicant improvements.
Note
1. Upper bounds for LPi ranks are calculated by increasing a country’s LPi score to its upper bound while maintaining all other country scores constant and then recalculating LPi ranks. An analogous procedure is adopted for the lower bounds.
Box 1.4 How precise are LPI scores and ranks?
The 2007 and 2010 LPi data have been widely referenced internationally. The World Economic Forum’s Global Enabling Trade Report, published yearly since 2009, uses LPi data in its composite Enabling Trade index to capture important aspects of sup-ply chain performance affecting international economic integration.1
The Asia-Paciic Economic Cooperation also uses data from the LPi, to measure performance under its Supply Chain Connectivity initiative. The initiative’s goal is to reduce by 10 percent the time, cost, and uncertainty of supply chain transactions in ive years.
The World Bank uses the LPi in its World Development Indicators and as a stan-dard performance indicator in such country reports as Country Economic Memo-randums or Country Assistance Strategies.2
Advanced economies use the LPi, too. The Øresund EcoMobility project, a Swedish–Danish cross-border initiative to increase competence within climate-friendly transport of both goods and people, draws on 2007 and 2010 LPi data in the Logistics and Sustainability Performance index that it is developing.3
Notes
1. World Economic Forum 2010. 2. See, for example, World Bank (2011).
3. www.cbs.dk/Forskning/institutter-centre/Projekter/EcoMobility.
Box 1.5 Policy applications of the 2007 and 2010 LPI — regionally
Unbundling logistics performance
The LPI score and country rankings for the six main component indicators come from the international part of the survey, a collection of information provided by foreign logistics professionals.
In the domestic LPI, by contrast, surveyed logistics professionals assess the logistics envi-ronments in the countries where they work. he domestic part thus contains more detailed in-formation on countries’ logistics environments, core logistics processes and institutions, and performance time and cost. his approach looks at the logistics constraints within countries, not just at the gateways, such as ports or borders. It analyzes country performance in four major determinants of overall logistics performance: infrastructure, services, border procedures and time, and supply chain reliability.
Infrastructure
Survey respondents in countries in the top quintile rated their infrastructure far more highly than did those in countries in the other four quintiles (table 2.1). Diferences across the other four quintiles are less striking, especially for road and rail links. Infrastructure, though still a logistics constraint in developing coun-tries, seems to be improving.
Since 2010, satisfaction with many infra-structure types has risen — though to vary-ing degrees across quintiles (see table 2.1 in Connecting to Compete 2010). Respondents in all LPI quintiles are most satisied with ICT infrastructure: in the four lowest quintiles, the number of respondents rating its quality “high” or “very high” is at least twice as large as for any other infrastructure type. By contrast, rail in-frastructure inspires general dissatisfaction: the number of respondents rating rail infrastructure
“high” or “very high” is at most half as large as for any other type. Road infrastructure satisies more respondents than most other types, ex-cept in the two lowest quintiles. In the bottom quintile, infrastructure generally fails to satisfy — an exception to the pattern of variation.
Similar patterns emerge when the do-mestic LPI data on infrastructure are disaggregated by World Bank region, omitting income countries (table 2.2). he high-est ratings in all regions are for ICT — with ratings in Sub- Saharan Africa lagging behind those in other regions. Ratings for other in-frastructure types vary more widely by region, but two features stand out. First, satisfaction with road infrastructure is especially low in South Asia and the Middle East and North Africa. Second, satisfaction with rail infra-structure is higher in the Middle East and North Africa and Europe and Central Asia than elsewhere, though it is still lower than for other infrastructure types.
Services
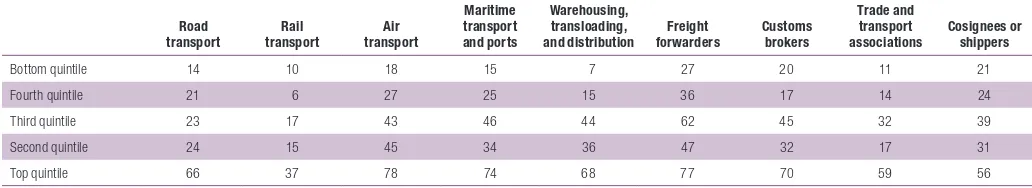
he quality and competence of core logistics service providers is another important part of overall country performance. For countries in the three lowest LPI quintiles, freight forward-ers are rated much higher than other types of service providers (table 2.3).13 Ratings for the other provider types vary more widely across all quintiles — though rail transport service provision, like rail infrastructure, consistently receives low ratings. And as with infrastructure, countries in the top quintile receive by far the highest ratings for service provider quality and competence.
Respondents in all but the top quintile are far more satisied with service providers
S
EC
T
IO
N
than with infrastructure quality (compare tables 2.1 and 2.3). he same gap appears gen-erally across World Bank regions (table 2.4). hese data suggest a need to develop trans-port-related infrastructure. The difference in satisfaction with services and infrastruc-ture is especially strong in air and maritime transport and, in some regions, road and rail transport. Unlike the 2010 LPI, the 2012 LPI shows a striking diference in satisfaction — throughout all LPI quintiles — between rail
infrastructure and rail services. Yet both rail infrastructure and services receive low ratings, even in the top LPI quintile, consistent with Europe’s long-term shit from rail freight to trucking.
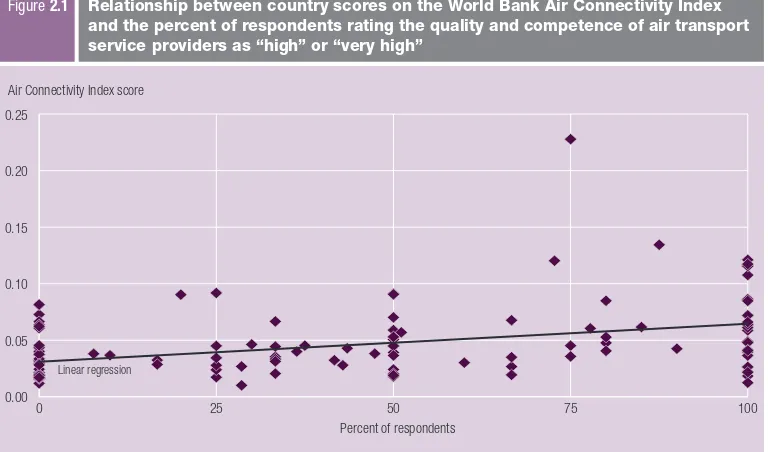
It is also useful to compare the LPI indica-tors on service provider performance with ex-ternal measures, such as the World Bank’s Air Connectivity Index, which measures countries’ centrality to the global air transport network on a scale from 0 to 1.14 Higher satisfaction with air transport service providers is strongly associated with a higher Air Connectivity Index score (igure 2.1). Also positively corre-lated with the Air Connectivity Index score is the quality of air transport infrastructure. So improving country connectivity requires im-proving infrastructure, such as airports. But it also requires improving the domestic regula-tory environment, with attention to competi-tion, to entry barriers, and to policies that in-crease the costs of trade.
Understanding economic connectivity is becoming more and more important for un-derstanding global supply chains. Logistics performance measures how well countries connect to global networks, while connectiv-ity assesses how well countries are positioned toward their markets, considering their posi-tion on services networks (air, shipping). he United Nations Conference on Trade and De-velopment has been developing since 2004 the Liner Shipping Connectivity Index for ship-ping networks. Connecting to Compete 2010 showed a link between shipping connectivity and supply chain reliability, as in air trans-port. While connectivity inluences domestic
Percent of respondents
Ports Airports Roads Rail
Warehousing and transloading ICT
Bottom quintile 12 9 9 12 10 18 Fourth quintile 12 10 6 1 12 26 Third quintile 24 33 19 10 31 44 Second quintile 27 31 23 3 32 67 Top quintile 72 76 69 32 70 77
ICT is information and communications technology.
Source: Logistics Performance Index 2012.
Table 2.1 Respondents rating the quality of each infrastructure type “high” or “very high,” by LPI quintile
Percent of respondents
Ports Airports Roads Rail
Warehousing and transloading ICT
East Asia and Paciic 18 22 14 3 15 41 Europe and Central Asia 14 33 15 12 27 43 Latin America and Caribbean 21 24 15 4 19 39 Middle East and North Africa 25 29 5 10 19 39 South Asia 16 23 7 8 11 35 Sub-Saharan Africa 18 10 12 1 15 28
ICT is information and communications technology.
Source: Logistics Performance Index 2012.
Table 2.2 Respondents rating the quality of each infrastructure type “high” or “very high,” by World Bank developing country region
Percent of respondents
Source: Logistics Performance Index 2012.
logistics outcomes captured in the LPI, it is not fully exogenous. Indeed, national policies and cross-border arrangements also inluence con-nectivity, whether for air, maritime, or land transport (which depends largely on transit agreements).
Border procedures and time
he LPI includes several indicators of border procedures and time.
Import and export time
A useful outcome measure of logistics per-formance is the time taken to complete trade transactions. he median import lead time for port and airport supply chains, as measured for the LPI, is more than 3.5 times longer in low-performing countries than in high-low-performing countries (igure 2.2). he diference is around three times for land supply chains. hese times are associated with distance, with a correla-tion coeicient of 0.6. he associacorrela-tion suggests that geographical hurdles, and perhaps internal transport markets, still pose substantial diicul-ties in many countries.
Besides geography and speed en route, an-other factor in import lead times is the border process. Time can be reduced at all stages of
this process, but especially in the clearance of goods on arrival (see igure 2.2). Countries with low logistics performance need to reform their border management so that they can reduce red tape, excessive and opaque procedural require-ments, and physical inspections. Although the time to clear goods through customs is a fairly small fraction of total import time for all LPI quintiles, it rises sharply if goods are physically inspected. Core customs procedures are simi-lar across quintiles. But low-performing coun-tries have a far higher prevalence of physical inspection, even subjecting the same shipment to repeated inspections by multiple agencies (table 2.5).
Percentage points
Road transport
Rail transport
Air transport
Maritime transport and ports
Warehousing, transloading, and distribution
East Asia and Paciic 6 17 2 2 5 Europe and Central Asia 16 10 18 8 12 Latin America and Caribbean 21 11 0 –2 13 Middle East and North Africa –4 2 10 –3 –9 South Asia 14 6 12 0 4 Sub-Saharan Africa 8 10 2 10 –2
Source: Logistics Performance Index 2012.
Table 2.4 Difference between respondents rating services “high” or “very high” and those rating infrastructure “high” or “very high,” by World Bank developing country region
0.00 0.05 0.10 0.15 0.20 0.25
Air Connectivity Index score
Source: Arvis and Shepherd 2011; Logistics Performance Index 2012.
Figure2.1 Relationship between country scores on the World Bank Air Connectivity Index and the percent of respondents rating the quality and competence of air transport service providers as “high” or “very high”
Percent of respondents
0 25 50 75 100
The median import
lead time for port and
airport supply chains
is more than 3.5 times
longer in low-performing
countries than in
high-performing countries
Export supply chains typically have a much lighter procedural burden than do import sup-ply chains, so lead times are shorter for exports than for imports (igure 2.3). But export lead times display the familiar logistics gap — they are three or even four times longer for low- income countries than for high-income coun-tries (igure 2.4). Moreover, they difer much more between low-income countries and the rest than between middle- income and high-income countries. Many low-high-income countries have long export lead times, reducing their
export competitiveness and ability to partici-pate in inter national trade.
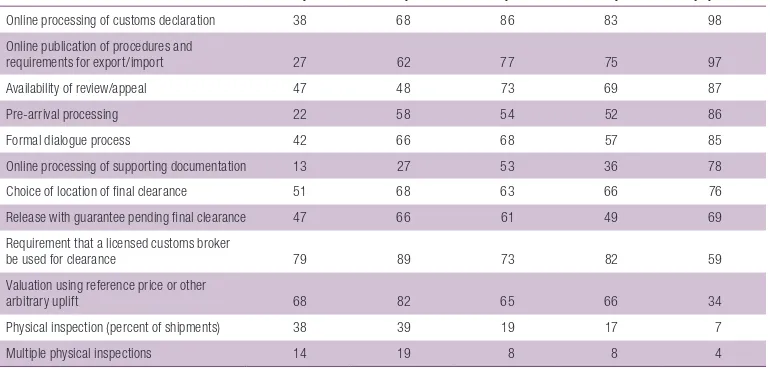
Unlike lead times, which vary considerably around the world, customs procedures are be-coming more similar (see table 2.5). he larg-est performance gap for customs procedures is between the bottom LPI quintile and all other quintiles. Even that gap is much smaller for some procedures (such as the choice of a inal clearance location) than for others (such as on-line processing). he valuation of goods still varies, with reference prices or other arbitrary
0 2 4 6 8 10 12 14
Top quintile Second quintile
Third quintile Fourth quintile
Bottom quintile
Days Lead time, import (port/airport) Lead time, import (land)
Average clearance time with physical inspection Average clearance time without physical inspection
Source: Logistics Performance Index 2012.
Figure2.2 Median import lead time and average clearance time, by LPI quintile
Percent of respondents unless otherwise indicated
Bottom quintile Fourth quintile Third quintile Second quintile Top quintile
Online processing of customs declaration 38 68 86 83 98 Online publication of procedures and
requirements for export/import 27 62 77 75 97 Availability of review/appeal 47 48 73 69 87 Pre-arrival processing 22 58 54 52 86 Formal dialogue process 42 66 68 57 85 Online processing of supporting documentation 13 27 53 36 78 Choice of location of inal clearance 51 68 63 66 76 Release with guarantee pending inal clearance 47 66 61 49 69 Requirement that a licensed customs broker
be used for clearance 79 89 73 82 59 Valuation using reference price or other
arbitrary uplift 68 82 65 66 34 Physical inspection (percent of shipments) 38 39 19 17 7 Multiple physical inspections 14 19 8 8 4
Source: Logistics Performance Index 2012.
Export lead times are
three or even four times
longer for low- income
countries than for
high-income countries
uplits oten applied in countries outside the top quintile.
Even as customs procedures become more similar, many countries still ind their supply chain performance constrained by other bor-der agencies. Customs is not the only agency involved in border management. Coopera-tion among all border management agencies — standards, transport, health, and sanitary and phytosanitary (SPS) — is critical to reform (box 2.1). So is the introduction of modern ap-proaches to regulatory compliance (box 2.2).
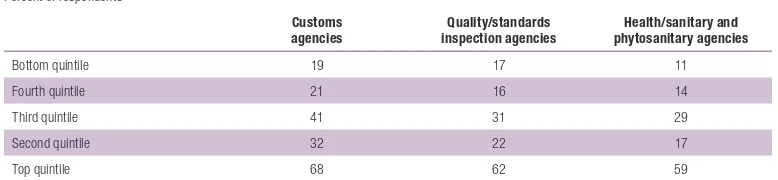
Satisfaction with customs is generally higher than with other border agencies (table 2.6). Yet
the gap is smaller for countries in the top LPI quintile — countries where border clearance has received broad-based policy attention. Here, again, the top quintile stands out.
he gap in satisfaction between customs and other border agencies is especially striking for health and SPS agencies, which in many coun-tries may be impeding more efficient import procedures. By contrast, quality and standards inspection agencies receive higher satisfaction ratings. One reason is that fewer inspection pro-cedures are required for products that are not per-ishable or time-sensitive. Another is that health and SPS agencies have been slow to automate.
0 2 4 6 8 10
Top quintile Second quintile
Third quintile Fourth quintile
Bottom quintile
Lead time, export (days) Port/airport Land
Source: Logistics Performance Index 2012.
Figure2.3 Median export lead time, by LPI quintile
0 2 4 6 8 10
High income Upper
middle income Lower
middle income Low
income
Lead time, export (days) Port/airport Land
Source: Logistics Performance Index 2012.