A Quality-of-Life/Needs Assessment Model and Method
Don R. Rahtz
THECOLLEGE OFWILLIAM ANDMARY
M. Joseph Sirgy
VIRGINIAPOLYTECHNICINSTITUTE
A community-based health-care assessment model and method are pre- Medicare ($166.1 billion), hospital care ($338.5 billion), nurs-ing home care ($72.3 billion), and physician services ($189.4
sented. The model and method are based on theoretical notion that
commu-nity residents’ satisfaction with individual health-care programs and ser- billion)—made up the bulk of those expenditures (U.S. Gov-ernment Statistics for 1994 reported in Boston Globe, May
vices available within their community affect their satisfaction with the
community health-care system. Examples of individual health-care ser- 1996). If we project that rate of growth out past the end of the decade, the costs are staggering.
vices and programs include: drug abuse programs, cancer health services,
children health services, diabetes services, elderly health programs, emer- The reasons behind this explosive dollar growth in the United States’ health care are multiple. Two of the more
impor-gency health services, physical fitness programs, heart health programs,
home health services, mental health services, in-patient hospital services, tant reasons are briefly touched on here. These are: (1) the aging population; and (2) the competitive dynamics of the
obstetrics services, out-patient services, physical rehabilitation services,
and women’s health programs. In turn, satisfaction with over-all commu- industry itself.
First, the country has seen its population age significantly.
nity health care affects perceived quality of life (over-all life satisfaction)
through satisfaction with the community at large and satisfaction with As a function of this aging population, more and more money will be applied toward health-related products and services
personal health. Data were collected in the Mid-Atlantic area of the United
States through a mail survey. One-hundred and forty-seven community (Gradison, 1991; Garland, 1991; Spotts and Schewe, 1989). As White-Means (1988) points out, the elderly spend a larger
residents completed the survey. The results were supportive of the model
and provided validational support to the assessment method. Managerial and larger portion of their disposable income on health care as they begin to experience declining personal health. Studies
implications of the model and its application are also discussed.J BUSN RES
2000. 48.165–176. 2000 Elsevier Science Inc. All rights reserved. by Meadow (1983), Rahtz, Sirgy, and Meadow (1989) and
others (e.g., Andrews and Withey 1976) have shown the value of the health-care system in contributing to the over-all quality of life (QOL) for individuals, especially the elderly.
Conse-C
urrently, the U.S. health-care system is, by far, the quently, from a public policy perspective, the health-care do-main will continue to grow in importance to the society as most expensive in the world. Latest available figuresfrom 1994 show that the country spent, on average, the population continues to age.
Second, the competitive structure and nature of the health-over $3,510 per person on health care (U.S. Ghealth-overnment
Statistics, 1996). This figure far exceeds the amount spent per care industry have contributed to the spiraling dollar increase in delivery of care. Although traditional economic theory sug-capita by any other country in the world. In 1990, according
to government sources, the nation spent $662.2 billion on its gests that competition drives prices down, this does not seem to be the case in the health-care industry. Its unique structure health care. The figure is approximately 10.5% higher than
it was just 3 years before in 1987. In 1994, over $949 billion of third-party payers, government regulation and programs, litigation, and multiple providers with a variety of high-cost was spent. The 1994 data show that those costs were spread
over a variety of programs and services that were offered by asset product/service portfolios make traditional market theo-ries ineffective in application and planning.
the health-care industry. Four health-care delivery areas—
Given the current state of affairs in the health-care environ-ment, it has become a major target for reformers from the
Address correspondence to Dr. D. R. Rahtz, The College of William and Mary,
School of Business, Williamsburg, VA 23187-8795, USA. government and from within the industry itself. With the 1996
Journal of Business Research 48, 165–176 (2000)
2000 Elsevier Science Inc. All rights reserved. ISSN 0148-2963/00/$–see front matter
presidential campaign, as with the 1992 campaign, health-care managers to partial out the various components of the health-care system portfolio and assess their individual value and reform was a major election issue. Although nothing has yet
to be executed, the Clinton administration and the Republican contribution to community residents’ well-being. Congress have unveiled a variety of proposals for overhaul of
the system. A key part of many of these proposals seem to
Community Health-Care Satisfaction
suggest that health-care industry leaders should rely on a Community health-care satisfaction refers to an over-all or
community-based managed competition system in lieu of the global satisfaction a person may feel toward the general health-traditional market competition-based system that has domi- care environment in their community. This assessment can nated the industry for decades. be assumed to be a function of the person’s perception of a Under such a community-based managed competition sys- variety of general health-care programs and services in the tem, the performance measures for a health-care provider can community. These programs or services may include: alcohol be expected to change dramatically. Market share and other and drug abuse programs, inpatient hospital care, outpatient traditional competition-based measures will not be sufficient hospital care, and elderly health services, among others. indicators of meeting consumer demand and providing
neces-sary services. The government can be expected to continue
Antecedents of Community
to week assurances that the over-all quality of health careforHealth-Care Satisfaction
the communityis being met at minimal cost; that is, that theOn the left side of the model’s diagram are the health system’s health-care needs of the community are being met. In such
potential and actual offerings within a given community. These a setting, we would expect to see an increased use of consumer
identified offerings are then used by community residents to assessments (e.g., Davies and Ware, 1988) as a way in which
assess their over-all satisfaction with health care (community the “value” of the individual and total community
health-health-care satisfaction). Their over-all satisfaction is postu-care systems’ contribution to the community QOL can be
lated to be determined by the sum of the satisfaction with monitored over time.
those health-care programs and services residents perceive as available within the community. In a formula representation that relationship can be expressed as (Equation 1):
Purpose of this Paper
CHCS5RSi (1)
If health-care and public policy officials are to be able to measure performance in this new environment, it is essential that such
where: CHCS 5 community health-care satisfaction; Si 5
measurement is guided by a theoretical model designed to
satisfaction with individual health-care program or service reflect the new emphasis on community-based managed
com-(e.g., alcohol and drug abuse programs), wherei 51, 2, 3,
petition systems. The purpose of this paper is to present and
4, . . . ,n. test a model of community health-care satisfaction. The current
Most multi-attribute attitude models use the same logic in model is designed to provide health-care and public policy
predicting and explaining attitude (Fishbein and Ajzen, 1975; officials with the ability to conceptualize and measure effective
Wilkie and Pessemier, 1973). That is, a consumer’s attitude health-care delivery performance by a given health-care system
toward community health care is a direct function of thesum
in relation to the over-all community the system serves.
of a consumer’s evaluations of each health-care program or serviceperceivedavailable in the community. The concept of evaluation can be easily equated with satisfaction. Satisfaction
Community Health-Care Satisfaction:
researchers have long argued this case (e.g., Aiello, Czepiel,
An Integrated Quality-of-Life (QOL)
and Rosenberg, 1977).Past research has shown that individual health-care
pro-Model for the Health-Care Industry
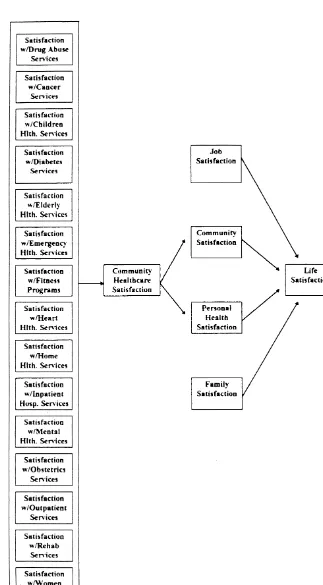
grams or services can affect over-all satisfaction of community In any strategic planning situation, it is important that
manag-health care. Sirgy, Hansen, and Littlefield (1994) have argued ers use theoretical models to guide them in conceptualizing,
and empirically demonstrated that hospital satisfaction can strategizing, implementing, and monitoring their product/
significantly affect community health-care satisfaction. Fur-marketing mix offerings. This is especially true for many
thermore, consumer satisfactions with individual health-care health-care organizations whose portfolios contain a wide
vari-programs and services have long been considered as valid ety of health-care programs and services. Figure 1 is a diagram
indicators of the quality of care and have received wide support of such a model.
for such use in the literature (e.g., Davies and Ware, 1988). The use of such a model provides decision makers with a
specific framework in which they can measure the extent to H1: Community health-care satisfaction is a direct function of the sum of satisfactions with various health-care which specific health-care services and programs can
signifi-cantly contribute to enhancing the quality of life (QOL) of programs and services perceived available in the com-munity.
Figure 1. Health-care services model.
What must be recognized is that these health-care services available (or lacking) in the community. Hence, the list of programs and services that can be included in a community and programs may be those that are actually, or potentially,
provided by one or more health-care provider(s) in the com- health-care assessment instrument does not have to be re-stricted to actual community offerings. Potential health-care munity. In other words, consumers are likely to express
assessment survey. In addition, programs and services can these results suggest that community health-care satisfaction also be added or subtracted from the assessment instrument affects life satisfaction through the mediating effects of per-to remain consistent with any health-care system’s real or sonal health satisfaction.
anticipated portfolio change. The moderating versus mediating effects of personal health satisfaction on the relationship between community health-care satisfaction and life satisfaction was further explored
Consequences of Community
(Sirgy, Rahtz, Meadow, and Littlefield, 1995). Support was
Health-Care Satisfaction
provided for the mediating effect of personal health satisfaction As can be seen from Figure 1, the model clearly recognizes
given a general population (elderly and nonelderly consum-that there are numerous domains consum-that contribute to the
well-ers). The same results also suggested that personal health being of community residents. The health-care domain is but
satisfaction may play a moderating role on the relationship one of many. If health-care managers are to make claims that
between community health-care satisfaction and life satisfac-their systems have contributed “significantly” to community
tion, however,onlyfor elderly consumers. Sirgy, Hansen, and residents’ well-being, it is crucial that these other domains’
Littlefield (1994) demonstrated that hospital satisfaction af-influences be recognized and accounted for in any
measure-fects life satisfaction through community health-care satisfac-ment of that individual health-care system’s contribution.
tion and personal health satisfaction. These results, in total, The model posits that community health-care satisfaction
give strength to the argument that community health-care affects life satisfaction through themediatingeffects of
commu-satisfaction may affect life commu-satisfaction through personal health nity satisfaction and personal health satisfaction. That is,
com-satisfaction. munity health-care satisfaction affects community satisfaction
The theoretical logic used in this particular model and by and personal health satisfaction; these, in turn, affect life
satis-researchers in this area (e.g., Rahtz, Sirgy, Meadow, 1989) faction.
is grounded in QOL theory (Andrews and Withey, 1976; Suggestive evidence of these relationships come from
stud-Campbell, Converse, and Rodgers, 1976; Meadow, 1988). ies conducted by Meadow (1983), Rahtz, Sirgy, and Meadow
The basic premise is that life satisfaction is functionally related (1989), Sirgy, Mentzer, Rahtz, and Meadow (1991), Sirgy,
to satisfaction with all of life’s domains and subdomains. That Rahtz, Meadow, and Littlefield (1995), and Sirgy, Hansen,
is, life satisfaction is influenced by lower levels of life concerns and Littlefield (1994). Specifically, Meadow (1988) developed
and evaluations within. Thus, the greater the satisfaction with a consumer well-being (satisfaction) measure and correlated
such concerns as personal health, work, family, and leisure, it to life satisfaction measures among elderly consumers.
Satis-the greater Satis-the satisfaction with life in general. In oSatis-ther words, faction with medical care (health care) was one of the
con-life satisfaction is determined by satisfaction with the mix of sumer domains in the measure. This measure was a composite
an individual’s major life domains. of satisfaction ratings with hospitals, doctors/dentists, drug
The affect within a life domainspills oververtically to the stores, and counseling services. The results showed a more
most superordinate domain (life in general), thus determining significant relationship between satisfaction with medical care
life satisfaction. Satisfaction with a given life domain is deter-institutions found in the community and life satisfaction than
mined by satisfaction with life conditions and concerns mak-between satisfaction with other domains (such as food
ser-ing up that domain. For example, satisfaction with personal vices, housing) and life satisfaction. Such a findings supports
health (life domain) is determined by satisfaction with com-the notion that community health-care satisfaction plays a
munity health-care satisfaction and one’s efforts to eat nutri-significant role in perceived QOL (or life satisfaction).
tiously, exercise regularly, drink in moderation, practice safe Rahtz, Sirgy, and Meadow (1989) explored the effects of
sex, and so forth. moderating factors (such as personal health satisfaction) on
A person’s evaluation of these factors can be viewed as the relationship between community health-care satisfaction
satisfaction/dissatisfaction with life conditions or concerns and life satisfaction. The study revealed a stronger relationship
within the domain of personal health. Within a given life between community health-care satisfaction and life
satisfac-condition or concern (such as community health care), satis-tion when personal health is perceived as poor (as compared
faction with that life condition or concern is affected by satis-to good).
faction with the subconditions (or subconcerns) embedded Sirgy, Mentzer, Rahtz, and Meadow (1991) conducted a
within it. For example, community health-care satisfaction is follow-up study to assess further the relationship and to
ex-likely to be determined by satisfaction with the various health-plore the moderating role of personal health satisfaction (and
care programs and services perceived available in the commu-cognitive age) on the relationship. Overall, results indicated
nity (e.g., alcohol and drug abuse programs, elderly health that community health satisfaction is positively related to life
services, home health services, inpatient hospital services, out-satisfaction, as expected. Personal health satisfaction was
patient hospital services, outpatient hospital services). These found to relate to life satisfaction directly and independently
the life condition/concern of community health care. The tained usable data. This translated into a 59% response rate for the mail survey portion of the study. In terms of the over-extent to which satisfaction within a subdomain affects
satis-all return from the 304 initial contacts, the response rate was faction of a superordinate domain in the hierarchy of
psycho-still a strong 48%. logical domains has been referred to in the QOL literature
Analysis of the sample demographics revealed that the (e.g., Diener, 1984) as thebottom-up spillover effect.
majority of respondents were white married women with full-Based on the same theoretical rationale, the following
time jobs, having at least two children, with a high school hypotheses were developed to articulate the consequences of
education or some college. It should be noted that the validity community health-care satisfaction.
of the proposed assessment method does not depend upon
H2: Personal health satisfaction is a direct function of
com-the external validity (e.g., sample representativeness) of com-the munity health-care satisfaction. study. The validity of the method hinges on testing the
hypoth-H3: Community satisfaction is a direct function of commu- esized relationship of the model, hence internal validity as-nity health-care satisfaction. pects of the study should be considered more important than
external validity.
H4: Life satisfaction is a direct function of personal health satisfaction, community satisfaction, job satisfaction,
Measures
and family satisfaction.Satisfaction with community health-care programs and services
(alcohol and drug abuse, cancer, children health, diabetes, elderly health, emergency health, physical fitness, heart
dis-Method
ease, home health, inpatient hospital, mental health,
outpa-Sampling
tient, physical rehabilitation, and women health) was mea-sured using a multiplicative index involving four components. The study was conducted in three phases. Phase One consistedThese components were: (1) satisfaction with the quality of of six personal interviews with community health-care
execu-the community health-care service/program in question (e.g., tives from the two “full-service portfolio” regional health-care
elderly health services and programs in the community); (2) providers in the study area. This was done to identify the
perceived importance of the health-care service/program in types of health-care programs and services available in the
question within the community; (3) past use of the health-community. From these interviews, and the literature, the initial
care service/program in question within the community; and survey instrument was developed. The last two phases
in-(4) knowledge of available health-care service/program in volved were a survey (telephone and mail) of individuals from
question in the community (Equation 2). the community. Given the paper’s focus and because the first
phase was simply to identify appropriate elements for
inclu-S 5Q3I3U3 K (2)
sion in the instrument and gain managerial comments about
the process, only the last two phases are explained in more where: S5satisfaction with the community health-care pro-detail below. gram/service in question; Q 5 satisfaction with quality of Phase Two was as a telephone screening survey conducted the community health-care program/service in question; I5
to generate a group of 250 respondents for use in Phase Three. perceived importance of the health-care service/program in To generate the 250 for the later sample, 304 individuals were question within the community; U5past use of the health-contacted using a systematic random sampling procedure from care program/service in question within the community; and, the area telephone book. In the 5-minute telephone survey, K5 knowledge of the availability of the health service/pro-resident’s were asked demographics and a few questions about gram in question in the community.
con-tapped on a scale involving five categories, “very important,” of the availability of the service or program in question, the “important,” “somewhat important,” “not very,” and “not at more intense is the resultant satisfaction.
all.” “Very important” responses were coded as 1.0, “impor- Community health-care satisfaction was measured by re-tant” as 0.8, “somewhat imporre-tant” as 0.6, “not very” as 0.4, sponses to the following question: “In general, how satisfied and “not at all” as 0.2. are you with the over-all quality of the health-care available
Past use of the health-care service/programin question was in this area?” Responses were recorded using the delighted– measured by responses to the following response cue: “Con- terrible scale popular in quality-of-life studies (e.g., Andrews cerning the use of (name of the health-care program and Withey, 1976). The specific categories are: “delighted” or service).” This statement was followed by four response (coded as 7), “pleased” (coded as 6), “mostly satisfied” (coded categories: “I have used” (coded as 1.0), “A family member as 5), “mixed or equally satisfied and dissatisfied” (coded as has used” (coded as 0.85), “A friend has used” (coded as 0.5), 4), “mostly dissatisfied” (coded as 3), “unhappy” (coded as “I do not know of anyone who used this service” (coded as 2), “terrible” (coded as 1), “neutral or neither satisfied nor 0.25). dissatisfied” (coded as missing data), and “never thought about
Knowledge of the availability of the health-care service/program it” (coded as missing data). The delighted–terrible scale has in question was measured by responses to the following ques- been used successfully to measure a variety of domain-specific tion: “How much knowledge about available (name satisfaction (e.g., Andrews and Withey, 1976; Rahtz, Sirgy, of the health-care program or service) would you say you and Meadow, 1989; Sirgy, Mentzer, Rahtz, and Meadow, have?” Responses were tapped on a scale involving five catego- 1991; Sirgy, Rahtz, Meadow, and Littlefield, 1995; Sirgy, Han-ries, “a large amount,” “a fair amount,” “some,” “very little,” sen, and Littlefield, 1994).
and “none.” “A large amount” responses were coded as 1.0, Similarly, community satisfaction, personal health satisfac-“a fair amount” as 0.8, “some” as 0.6, “very little” as 0.4, and tion, job satisfaction, family satisfaction, and life satisfaction “none” as 0.2. were all measured using the delighted–terrible scale. Specifi-The theoretical rationale for the measures comprising the cally,community satisfactionwas measured by responses to the satisfaction index (satisfaction with quality, perceived impor- following question: “Over-all, how satisfied are you with the tance, past use, and knowledge) was based on the logic of community in which you live?”Personal health satisfactionwas multi-attribute attitude models (e.g., Wilkie and Pessemier, measured by responses to the following question: “Over-all, 1973). Satisfaction researchers have used the same logic to how do you feel about your personal health at this time?” conceptualize the determinants of consumer satisfaction (e.g., Job satisfactionwas measured by responses to the following Aiello, Czepiel, and Rosenberg, 1977). That is, satisfaction question: “Over-all, how satisfied are you in general with your with a good or service is determined by the satisfaction of the job?” Family satisfaction was measured by responses to the good or service attributes such as quality and price, moderated following question: “Over-all, how satisfied are you with your by the perceived importance of these attributes. In the current family?” Finally,life satisfactionwas measured by responses to satisfaction index, focus was on only quality of the health- the following question: “Over-all, how satisfied are you with care service in question, because price is often not perceived your life?”
as a decision criterion in health care. This is because most consumers usually buy health-care services through a third
Procedural Details in Survey Administration
party (health-care insurance, Medicaid, Medicare, etc.).The survey questionnaire was titled “Your Opinions on Com-Because the focus here is to predict community
health-munity Health Care.” The following instructions were pro-care satisfaction, not over-all satisfaction with an individual
vided at the beginning of the questionnaire. “This questionnaire health-care component, the perceived importance was
con-seeks to gain a better understanding of Peninsula resident’s strued and measured at a higher level of analysis (the
health-opinions about the local health-care service. When answering, care service/program in question instead of the attribute level).
please remember your opinions are very important to us, so That is, perceived importance was measured by asking the
please be as truthful as possible. Your answers will help in respondent the importance of the health-care service/program
designing better health-care programs for your community.” in question in relation to other health-care programs and
The measure forcommunity health-care satisfactionwas placed services within the community.
at the beginning of the questionnaire, followed by the measures In addition to perceived importance, it was expected that
pertaining to personal health satisfaction, community satisfac-satisfaction with the quality of a health-care service/program
tion, job satisfaction, family satisfaction, and life satisfaction. would be moderated by the extent of the consumer’s use
Between these questions were filler questions designed to of the health-care service/program in question, as well as
reduce response bias. Questions pertaining to ratings of physi-consumer’sknowledgeof the availability of the service/program
cal health along a variety of dimensions were used as fillers. in question. The greater the use of the service or program in
The following portion of the questionnaire involved the question, the more intense the satisfaction with the quality of
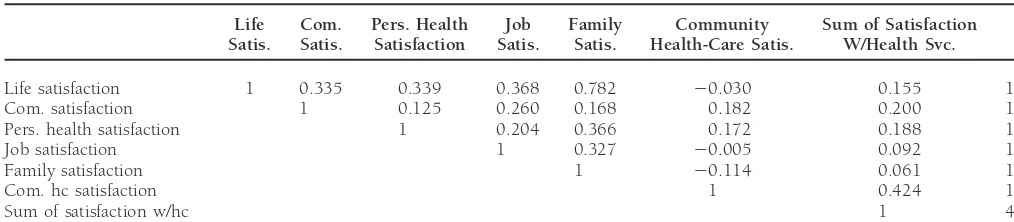
Table 1. Correlation Matrix and Descriptive Statistics
Life Com. Pers. Health Job Family Community Sum of Satisfaction Satis. Satis. Satisfaction Satis. Satis. Health-Care Satis. W/Health Svc. SD
Life satisfaction 1 0.335 0.339 0.368 0.782 20.030 0.155 1.026
Com. satisfaction 1 0.125 0.260 0.168 0.182 0.200 1.102
Pers. health satisfaction 1 0.204 0.366 0.172 0.188 1.021
Job satisfaction 1 0.327 20.005 0.092 1.205
Family satisfaction 1 20.114 0.061 1.218
Com. hc satisfaction 1 0.424 1.000
Sum of satisfaction w/hc 1 4.237
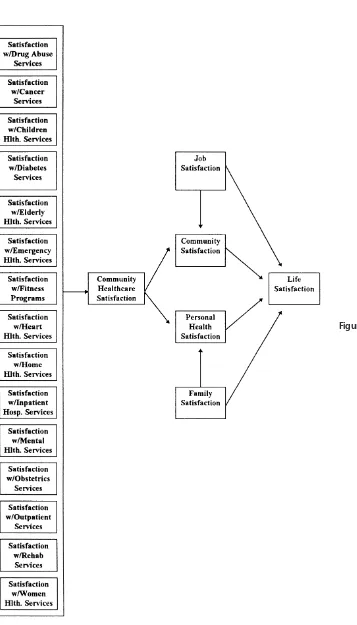
children’s health services, elderly health services, physical fit- absolute sense. However, the Lisrel output indicated that the model’s fit could be improved by adding two paths—one from ness programs and facilities, out-patient services, cancer
ser-vices, alcohol and drug rehabilitation serser-vices, heart disease family satisfaction to personal health satisfaction and the other services, diabetes services, obstetrics, physical rehabilitation from job satisfaction to community satisfaction (see Figure 2). services, psychiatric/mental health services, home health ser- The modified model was run again, and the results produced a vices, overnight/long-term hospital care, and emergency ser- significant improvement in fit. The Chi-square decreased to vices, in that order). This portion of the questionnaire began 10.66 (df59) and became nonsignificant (p5 0.30), RMR with providing respondents with the following instructions: decreased to 0.13, and CFI increased to 0.99. These changes “The following set of questions ask you about a wide variety of in the good-of-fit indices indicated that the modified model health services and programs that are offered in the Peninsula fit the data much better.
community by a number of health-care providers. Each
partic-ular service has a number of questions that relate to that
The Effect of Satisfaction with Various
particular service. We would like to know your feelings on:Community Health-Care Components on
How important it is that the service is available? How satisfiedOver-all Community Health-Care Satisfaction
you are with the particular type of service? And any experienceIt was hypothesized that community health-care satisfaction you, your family, or friends may have had. Please answer
was a direct function of the sum of satisfaction with the various these questions as they relate to you personally, or to your
community health-care services (H1). The Lisrel results were family and friends. Your answers will be very useful in making
mostly supportive of this hypothesis. The sum of satisfaction any changes that you think are necessary for better community
of the various health-care services was found to be a significant health care.
predictor of community health-care satisfaction. The regres-The last portion of the questionnaire involveddemographic
sion estimate was 0.10 (p,0.01) accounting for 18% of the items. The total length of the questionnaire was 14 pages.
variance (with an error variance of 0.82). Because they survey questionnaire involved many community
health-care components and other constructs, single indicator
measures were used to reduce length as much as possible.
The Effect of Community Health-Care
The shortcomings of single indicator measurements are recog-Satisfaction on Personal Health Satisfaction
nized, however, we can argue that the usefulness of theinfor-Personal health satisfaction was hypothesized to be a direct mation is sufficient to test the proposed model adequately.
function of community health-care satisfaction (H2). The Lis-rel results provided support for this hypothesis. The regression estimate was 0.22 (p , 0.01). Also, based on the modified
Results
model, family satisfaction was found to be another significant A Lisrel analysis was run as specified by the hypothesized predictor of personal health satisfaction. The regression esti-model (see Figure 1). Because all the measures used in the mate of family satisfaction was 0.33 (p
, 0.01). Both pre-study were single indicators, the measurement aspects of the dictors accounted for 20% of the variance in personal health model were not assessed. The hypotheses were tested directly
satisfaction (error variance was 0.85). through structural equations. The correlation matrix and
means and standard deviations of the variables are all shown
The Effect of Community Health-Care
in Table 1.Satisfaction on Community Satisfaction
The Chi-square for the model was 45.46 (df5 11, p5It was hypothesized that community satisfaction was a direct 0.000), RMR was 0.22, standardized RMR was 0.13, GFI was
function of community health-care satisfaction (H3). The 0.92, adjusted GFI was 0.79, and CFI was 0.86. These figures
sion estimate was 0.20 (p,0.01). Also, based on the modified argument is that over-all consumer well-being can be captured model, job satisfaction was found to be another significant by the sum of consumer satisfaction with various retail institu-predictor of community satisfaction. The regression estimate tions within one’s community (e.g., stores, restaurants, banks, of job satisfaction was 0.24 (p, 0.01). Both predictors ac- medical facilities). Over-all satisfaction with each type retail counted for 10% of the variance in community satisfaction institution was captured by the multiplicative product of (1) (error variance was 1.09). perception of quality service from that institution; (2) per-ceived importance of that particular retail institution in
rela-The Effect of Community Satisfaction,
tion to others; and (3) extent of use and familiarity with thatretail institution.
Personal Health Satisfaction, Job Satisfaction,
Consistent with that argument, it was assumed that
com-and Family Satisfaction on Life Satisfaction
munity health-care satisfaction is related to both satisfaction It was hypothesized that life satisfaction is a direct function
with the community at large and one’s personal health. The of community satisfaction, personal health satisfaction, job
results of the current study provided support for this hypothe-satisfaction, and family satisfaction (H4). The Lisrel results
sis, thereby providing additional validational support for the provided support for this hypothesis. The regression estimates
proposed community health-care assessment measure. The were 0.17 (p, 0.01) for community satisfaction, 0.11 (p,
study results are also consistent with past studies that have 0.05) for personal health satisfaction, 0.06 (p,0.10) for job
shown a link between community health-care satisfaction and satisfaction, and 0.57 (p,0.01) for family satisfaction. The
satisfaction with personal health and community at large (e.g., four factors accounted for 66% of the variance in life
satisfac-Rahtz, Sirgy, and Meadow, 1989; Sirgy, Mentzer, satisfac-Rahtz, and tion (error variance was 0.34).
Meadow, 1991; Sirgy, Rahtz, Meadow, and Littlefield, 1995; Sirgy, Hansen, and Littlefield, 1994).
Discussion
It should be noted, however, that the results of the current research indicate that personal health satisfaction is not only The results of this study provided validational support topredicted by community health-care satisfaction but also by the proposed community health-care assessment method. The
family satisfaction. Furthermore, the results indicate that com-data demonstrated that it is possible to measure consumer
munity satisfaction is not only predicted by community health-satisfaction with individual health-care programs and services
care satisfaction but also by job satisfaction. An explanation in a community QOL context. That is, consumer satisfaction
for the effect of family satisfaction on personal health satisfac-can be measured effectively in a manner linking satisfaction
tion may involve the notion of domain salience and spillover with individual health-care programs and services to
commu-of affect from salient domains. It can be argued that the family nity residents’ satisfaction with community health care at large,
life domain is highly salient in the minds of most people their personal health, community, and over-all life.
(especially married women with children, who comprised the Our proposed measure of consumer satisfaction with
indi-majority of the respondents in this study). Emotional states vidual health-care programs and services involves the sum of
reflecting satisfaction or dissatisfaction are likely to spill over the satisfaction with the various health-care programs/services
to the personal health domain. Specifically, intense states of and in which satisfaction with an individual health-care
pro-dissatisfaction with family life are likely to manifest in such gram/service is captured in terms of the multiplicative product
physical ailments as sleep disorders, overeating, depression, of four subconstructs: (1) satisfaction with the quality of the
smoking and related illnesses, and drug and alcohol abuse. community health-care program/service in question; (2)
Conversely, happiness in family life can positively affect per-ceived importance of the health-care program/service in
ques-sonal health be encouraging a person to exercise regularly tion; (3) past use of the health-care program/service in
ques-and engage in low-risk behaviors (e.g., safe sex, driving safely, tion within the community; and (4) knowledge of the
getting regular physical exams). availability of the health-care program/service in question in
The effect of job satisfaction on community satisfaction the community. It has been argued that this measure of
con-can be explained by the likelihood that the two are highly sumer satisfaction with individual health-care programs and
contingent upon one another. This is especially true if an services in a given community is an effective measure capable
individual’s job is either in the same, or in close proximity to of measuring consumer satisfaction in relation to community
the, city of residence. A person dissatisfied with his or her QOL. The results of this study demonstrated that, indeed, the
job is likely to feel motivated to move out of the community proposed measure of consumer satisfaction with individual
to find a better job. To maintain cognitive consonance (and health-care programs and services is nomologically related to
to reduce dissonance), feelings of job dissatisfaction are likely community health-care satisfaction. This assessment method
to lead to feelings of dissatisfaction with the community. The is consistent with the logic of other subjective well-being
converse of this may also be true. measures such as Meadow’s (1983) measure. Meadow
devel-Furthermore, it can be argued that community satisfaction oped a consumer well-being measure that uses the same
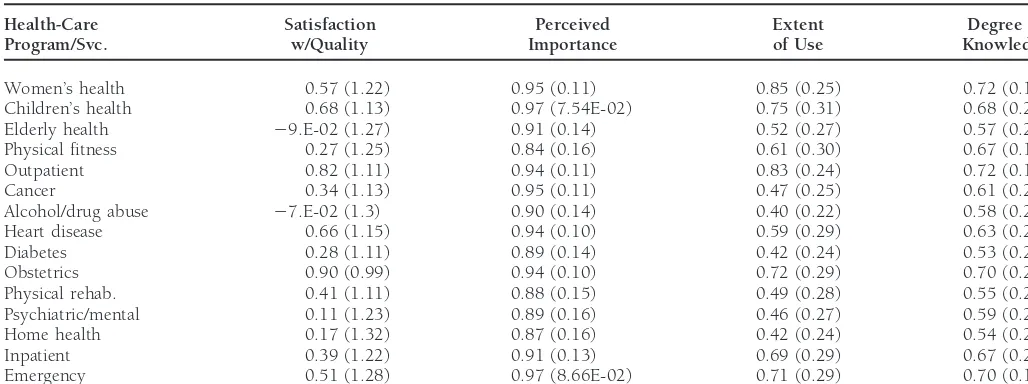
over-Table 2. Means and Standard Deviations of Measures of Satisfaction With Individual Health-Care Services
Health-Care Satisfaction Perceived Extent Degree of Program/Svc. w/Quality Importance of Use Knowledge
Women’s health 0.57 (1.22) 0.95 (0.11) 0.85 (0.25) 0.72 (0.19)
Children’s health 0.68 (1.13) 0.97 (7.54E-02) 0.75 (0.31) 0.68 (0.21)
Elderly health 29.E-02 (1.27) 0.91 (0.14) 0.52 (0.27) 0.57 (0.21)
Physical fitness 0.27 (1.25) 0.84 (0.16) 0.61 (0.30) 0.67 (0.19)
Outpatient 0.82 (1.11) 0.94 (0.11) 0.83 (0.24) 0.72 (0.18)
Cancer 0.34 (1.13) 0.95 (0.11) 0.47 (0.25) 0.61 (0.21)
Alcohol/drug abuse 27.E-02 (1.3) 0.90 (0.14) 0.40 (0.22) 0.58 (0.20)
Heart disease 0.66 (1.15) 0.94 (0.10) 0.59 (0.29) 0.63 (0.21)
Diabetes 0.28 (1.11) 0.89 (0.14) 0.42 (0.24) 0.53 (0.21)
Obstetrics 0.90 (0.99) 0.94 (0.10) 0.72 (0.29) 0.70 (0.21)
Physical rehab. 0.41 (1.11) 0.88 (0.15) 0.49 (0.28) 0.55 (0.21)
Psychiatric/mental 0.11 (1.23) 0.89 (0.16) 0.46 (0.27) 0.59 (0.21)
Home health 0.17 (1.32) 0.87 (0.16) 0.42 (0.24) 0.54 (0.22)
Inpatient 0.39 (1.22) 0.91 (0.13) 0.69 (0.29) 0.67 (0.21)
Emergency 0.51 (1.28) 0.97 (8.66E-02) 0.71 (0.29) 0.70 (0.18)
Satisfaction5satisfaction with the quality of the health-care services/program.This was measured by responses to the following question: “How satisfied are you with the quality of this health service in the community?” Responses were tapped on a scale involving five categories, “very satisfied,” “satisfied,” “somewhat satisfied,” “not very,” and “not at all.” “Very satisfied” responses were coded as a12, “satisfied” as11, “somewhat satisfied as21, “not very” as22, and “not at all” as23.
Importance5percieved importance of the health-care services/program.This was measured by responses to the following question: “How important is this (name of the health-care program or service) to the community?” Responses were tapped on a scale involving five categories, “very important,” “important,” “somewhat important,” “not very,” and “not at all.” “Very important” responses were coded as 1.0, “important” as 0.8, “somewhat important as 0.6, “not very” as 0.4, and “not at all” as 0.2.
Use5past use of the health-care services/program.This was measured by responses to the following response cue: “Concerning the use of (name of the health-care program or service).” This statement was followed by four response categories: “I have used”(coded as 1.0), “A family member has used” (coded as 0.85), “A friend has used” (coded as 0.5), I do not know of anyone who used this service” (coded as 0.25).
Knowledge5knowledge of the availability of the health-care services/program.This was measured by responses to the following question: “How much knowledge about available (name of the health-care program or service) woul you say you have?” Responses were tapped on a scale involving five categories, “a large amount,” “a fair amount,” “some,” “very little,” and “none.” “A large amount” responses were coded as 1.0, “a fair amount” as 0.8, “some” as 0.6, “very little” as 0.4, and “none” as 0.2.
all life satisfaction, in addition to satisfaction with other life use this assessment method as a tool toenhance the quality of life of community residents through better focused health-domains (e.g., job and family). The results of this study
pro-vided support for this hypothesis, thus providing additional care portfolio allocations? A demonstration based on the re-sults of the Mid-Atlantic sample is the most parsimonious way validational support for our proposed community health-care
assessment measure. The study results are also consistent with to provide the answers. Table 2 shows means and standard deviations of measures of satisfaction with individual health-QOL studies that have shown a link between satisfaction with
individual life domains and over-all life (e.g., Andrew and care services. Withey, 1976; Campbell, Converse, and Rodgers, 1976).
Assessment and Application
The first question that should be posed is:Which health care
Managerial Implications:
services are lacking in quality in the community? Based upon
Model Application
these figures, we can see that most community residents report dissatisfaction with health-care programs and services related This study provided validational support for the communityto elderly health (mean of satisfaction w/quality5 29.E-02), health-care assessment method described in this paper. The
alcohol and drug abuse (mean of satisfaction w/quality 5
composite index involving the sum of satisfaction with the
27.E-02), and home health (mean of satisfaction w/quality5
various health-care services was shown to be predictive of
20.17). However, it should be noted that there is a disparity community health-care satisfaction, which, in turn, was shown
of opinions regarding residents’ perception of quality of these to be predictive of community satisfaction, personal health
health-care services as noted by their standard deviations satisfaction, and life satisfaction. Consequently, the proposed
(1.27, 1.3, and 1.32, respectively). assessment method may be considered to have validity.
The other assessment question is:How important are these
Two questions, therefore, are related to the value of
apply-health-care services to residents of the community? To answer ing the model: (1) Can the method be used effectively by
this, we must examine the perceived importance means of health-care providers and public health officials toassessthe
these health-care services, as shown in Table 2. The majority health-care needs of a specific community in a manner related
of the residents report that these three types of health-care to the over-all life satisfaction of the community residents?;
0.97, 0.90, and 0.87, respectively). This should lead health- to develop produces, services, and/or programs that not only satisfy the consumers within that segment, but enhance a care providers and public policy officials to realize that these
three types of health-care services are lacking and are impor- certain dimension of their well-being. The firm should, thus, focus on establishing long-term relationships with the variety tant to the community citizens.
Two follow-up questions must be asked. The first of these of segments within the community it serves. Specifically, the firms should do so with the intention of maximizing the firm’s is:Could the reported dissatisfaction be because of lack of
knowl-edge of the availability or and quality level of these services? positive impact on the lives of those consumers. Health-care organizations, by their very nature and purpose, seem to be If so, then the appropriate action may be to increase the
promotional efforts concerning these services, not to readjust the embodiment of the perfect type of firm to become leaders to a move to a QOL perspective in strategic planning. The the service component itself; the latter choice being potentially
more costly and disruptive. Table 2 shows most community use of the proposed model and method can aid in such a move by providing decision makers with a measurement tool residents have “some” knowledge of these health-care services
(means of knowledge50.57, 0.58, and 0.54, respectively). that can be used to assess the effectiveness of their programs/ services to the community they serve.
Perhaps the action necessary here is to center efforts on the promotional side to educate the public about the availability
References
or quality of these services in the community.
The second question is:Are the health-care services identified Aiello Jr., A., Czepiel, J. A., and Rosenberg, L. J.: Scaling the Heights of Consumer Satisfaction: An Evaluation of Alternative Measures,
to be lacking in quality heavily used by the community residents?
inConsumer Satisfaction, Dissatisfaction, and Complaint Behavior,
If so, then action should be taken to develop these services
R. Day, ed., Indiana University School of Business, Bloomington,
further. Table 2 shows that most community residents know of IN. 1977, pp. 43–50. friends and acquaintances who have used the aforementioned
Andrews, F. M., and Withey, S. B.:Social Indicators of Well-Being:
services (means of use50.52, 0.40, and 0.42, respectively). America’s Perception of Life Quality.Plenum Press, New York. 1976. Based upon these results, action would be taken to develop Campbell, A., Converse, P. E., and Rodgers, W. L.:The Quality of further (or at least maintain) health-care programs and services American Life: Perceptions, Evaluations, and Satisfactions. Russell
Sage Foundation, New York. 1976.
in the provider’s system portfolio that are related to elderly
health, alcohol and drug abuse, and home health. Davies, A. R., and Ware, J. E.: Involving Consumers in Quality Assessment,Health Affairs7(1): (1988) 33–48.
Diener, E.: Subjective Well-Being,Psychological Bulletin75(3) (1984):
Conclusions
542–575.Fishbein, M., and Ajzen, I.:Belief, Attitude, Intention, and Behavior,
As noted at the beginning of this paper, the potential for
Addison-Wesley, Reading, MA. 1975.
significant change in the health-care industry is quite high.
Garland, S.: The Health-Care Crisis: A Perspective for Reform,
Busi-As the change to managed competition moves forward,
health-ness Week(October 7, 1991): 58–66.
care organizations will be asked (by public policy officials)
Gradison, B.: Health Care, American Style,The Washington Post
(Sep-to demonstrate the actual contribution of their health-care tember 28, 1991).
programs and services to the community. A model that has Meadow, H. L.: The Relationship Between Consumer Satisfaction an ability to link specific health-care programs and services and Life Satisfaction for the Elderly. Unpublished Doctoral Disser-to QOL of individuals in the community provides health-care tation. Polytechnic Institute, Blacksburg VA. Virginia 1991.
organizations with a valuable tool because of its ability to Meadow, H. L.: The Satisfaction Attitude Hierarchy: Does Marketing
Contribute? in Proceedings of the American Marketing Association
demonstrate such a contribution.
Educators’ Conference, S. Shapiro et al., eds. American Marketing
The proposed model and the QOL philosophy are
consis-Association, Chicago, IL. 1988, pp. 482–483.
tent with the stakeholder model that has been advocated by
Rahtz, D. R., Sirgy, M. J., and Meadow, H. L.: Exploring the
Relation-many interested in business ethics (Evan and Freeman, 1988).
ship Between Health-Care System Satisfaction and Life Satisfaction
The stakeholder model maintains that any business has multi- Among the Elderly.Proceedings of the Academy of Marketing Science ple constituencies to which is responsible. Not only does it Annual Conference, Academy of Marketing Science, De Kalb, IL.
1989, pp. 531–536.
need to be responsible to its stockholders, it must also be
responsible to its employees, suppliers, consumers, govern- Rahtz, D. R., and Sirgy, M. J.: Corporate Strategy and Quality of Life: A Strategic Planning Philosophy and Model for a Changing
ment, community, environment, etc.. Implicit in the QOL
Health Care Environment, inAdvances in Health-Care Research,
approach is the notion of multiple constituencies. The firm
H. L. Meadow and H. E. Spotts, eds., American Association for
is responsible for meeting the “healthful” demands of the Advances in Health Care Research, Madison WI, 1994, pp. 125– consumer and, at the same time, contributing to the better- 132.
ment of the community and other publics that make up its Sirgy, M. J., Hansen, D. E., and Littlefield, J. E.: Does Hospital operating environment. Satisfaction Affect Life Satisfaction?Journal of Macromarketing14
(Fall 1994): 36–46.
The QOL approach posits that the marketer’s primary
With Health-Care Services Consumption and Life Satisfaction Spotts, H. E., and Schewe, C. D.: Communicating with The Elderly: The Growing Health-Care Challenge.Journal of Health Care
Mar-Among the Elderly.Journal of Macromarketing11 (Spring 1991):
keting9(6) (1989): 36–44. 24–39.
White-Means, S.: The Purchase of Medicare Supplements: A Cost-Sirgy, M. J., Rahtz, D. R., Meadow, H. L., and Littlefield, J. E.:
Saving Mechanism in the Purchase of Physician Services. The
Satisfaction with Health-Care Services and Life Satisfaction
Journal of Consumer Affairs22(2) (1988): 249–263. Among Elderly and Nonelderly Consumers, inDevelopments in
Quality-of-Life Studies in Marketing, vol. 5, H. Lee Meadow, M. Wilkie, W. L., and Pessemier, E. A.: Issues in Marketing’s Use of Joseph Sirgy, and Don R. Rahtz, eds., Academy of Marketing Multi-Attribute Attitude Models. Journal of Marketing Research