Bacterial diversity in subbituminous coal and soil
Figure 2: Principal component analysis and biplot representing the soil samples. Only the squared cosines of the variables >0.95 are sh own in the correlation circle.
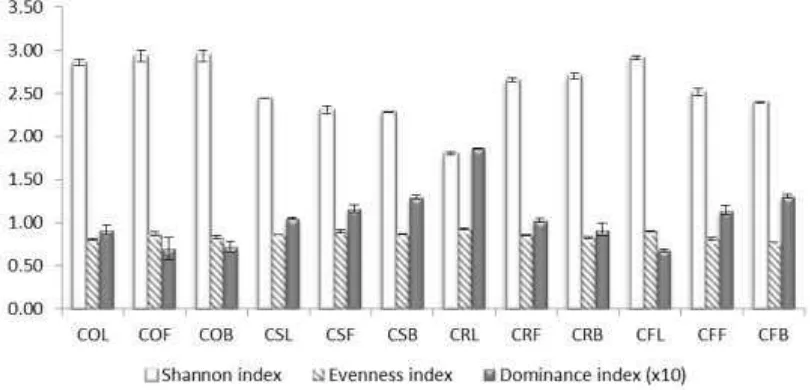
Figure 4: Diversity indices of Shannon, evenness and dominance among samples with different DNA extraction method. Values in dominance index were multiplied by10x to be shown more clearly.
Suppl.
International Journal of Integrative Biology
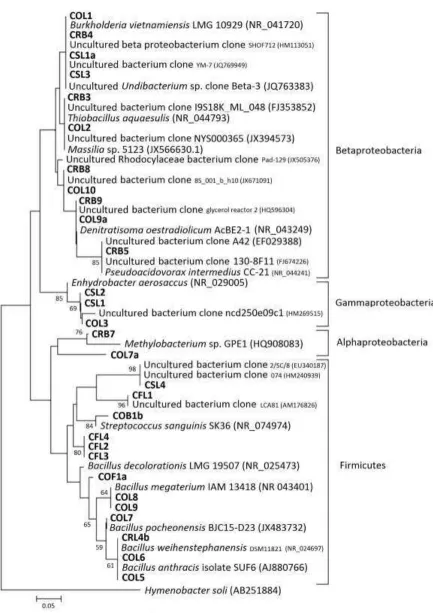
A journal for biology beyond bordersFigure 5:Phylogenetic tree comparing sequence of DGGE bands in are a I. T he area is according to the division shown in Figure 3. T he codes initiated by CO, CS, CF, and CR are those from this study, and the others with their accession number are from GenBank. Hyme nobacter soli was selected as the outgroup species. T he scale bar represents 0.05 substitutions per nucleotide position. Numbers at the nodes are the
Bacterial diversity in subbituminous coal and soil
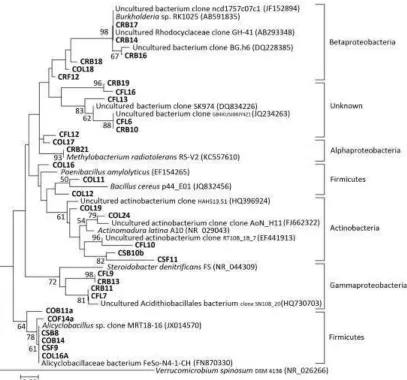
Figure 6:Phylogenetic tree comparing sequence of DGGE bands in area II. T he area is according to the division shown in Figure 3. T he codes initiated by CO, CS, CF, and CR are those from this study, and the others with their accession number are from GenBank. Verrucomicrobium spinosum was selected as the outgroup species. The scale bar represents 0.02 substitutions per nucleotide po sition. Numbers at the nodes are the bootstrap values (%); only values of ≥50% are shown.
Table 1: Description and site coordinate of samples.
S ample Description S ite Coordinate
Coal mixed soil (CS) Coal mined soil S3˚43’44.1”E103˚43’38.1”
Coal seam (CO) Coal seam that has not been mined S3˚44’29.2”E103˚45’11.7”
Coal roof (CR) Horizon of soil on the top of the coal seam S3˚44’29.2”E103˚45’11.7”
Coal floor (CF) Horizon of soil below the coal seam S3˚44’29.2”E103˚45’11.8”
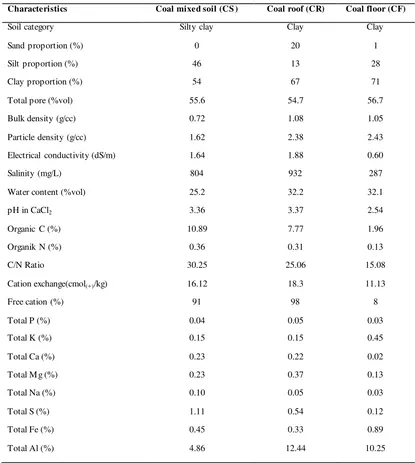
Table 2: Proximate properties of coal samples.
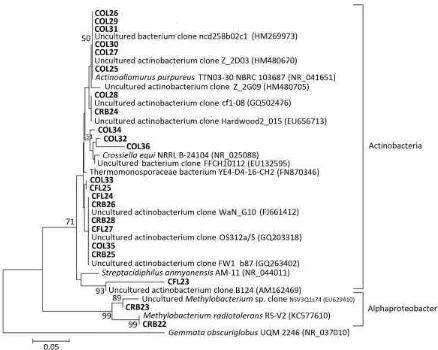
Figure 7:Phylogenetic tree comparing sequence of DGGE bands in area III. T he area is according to the division shown in Figure 3. T he codes initiated by CO, CS, CF, and CR are those from this study, and the others with their accession number are from GenBank. Gemmata obscuriglobus was selected as the outgroup species. The scale bar represents 0.05 substitutions per nucleotide position. Numbers at the nodes are the bootstrap values (%); only values of ≥50% are shown.
Bacterial diversity in subbituminous coal and soil
Table 3: Physical and chemical properties of soil samples.
Characteristics Coal mixed soil (CS ) Coal roof (CR) Coal floor (CF)
Soil category Silty clay Clay Clay
Electrical conductivity (dS/m) 1.64 1.88 0.60
Table 4: Number of DGGE bands.
Sample Direct method (L) Filtration method (F) Blending method (B)
Coal seam (CO) 35 30 32
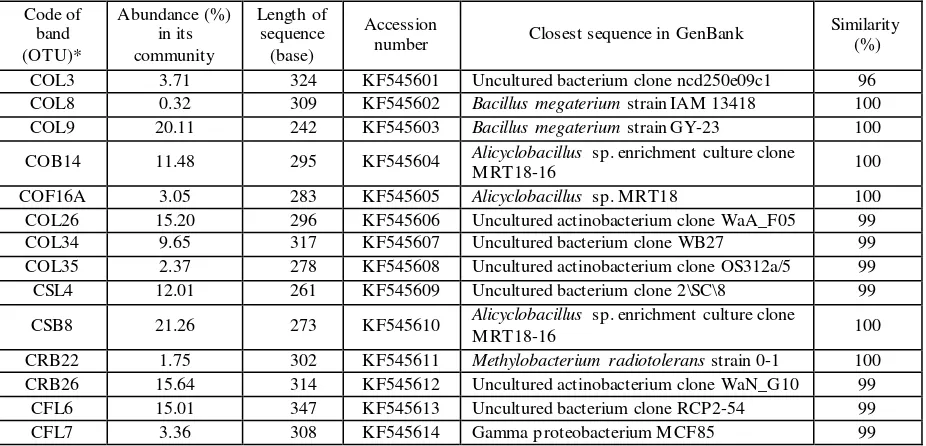
Table 5: Similarity of selected sequences to the closest relatives of 16S rRNA gene derived from the respective bands in DGGE gel.
Code of
number Closest sequence in GenBank
Similarity (%)
COL3 3.71 324 KF545601 Uncultured bacterium clone ncd250e09c1 96
COL8 0.32 309 KF545602 Bacillus megaterium strain IAM 13418 100
COL9 20.11 242 KF545603 Bacillus megaterium strain GY-23 100
COB14 11.48 295 KF545604 Alicyclobacillus sp. enrichment culture clone
M RT18-16 100
COF16A 3.05 283 KF545605 Alicyclobacillus sp. M RT18 100
COL26 15.20 296 KF545606 Uncultured actinobacterium clone WaA_F05 99
COL34 9.65 317 KF545607 Uncultured bacterium clone WB27 99
COL35 2.37 278 KF545608 Uncultured actinobacterium clone OS312a/5 99
CSL4 12.01 261 KF545609 Uncultured bacterium clone 2\SC\8 99
CSB8 21.26 273 KF545610 Alicyclobacillus sp. enrichment culture clone
M RT18-16 100
CRB22 1.75 302 KF545611 Methylobacterium radiotolerans strain 0-1 100
CRB26 15.64 314 KF545612 Uncultured actinobacterium clone WaN_G10 99
CFL6 15.01 347 KF545613 Uncultured bacterium clone RCP2-54 99
CFL7 3.36 308 KF545614 Gamma proteobacterium M CF85 99