THE EFFECTIVENESS OF STUDENT TEAM-ACHIEVEMENT DIVISION
(STAD) IN IMPROVING JUNIOR HIGH SCHOOL STUDENTS’ READING
COMPREHENSION
( A Quasi Experimental Study of Eighth Grade Students at One Junior High School in Bandung)
A Research Paper
Submitted to the English Education Department of FPBS UPI in Partial Fulfillment of the Requirement for the Sarjana Pendidikan Degree
By
Nunik Oktafiani
0906732
ENGLISH DEPARTMENT OF EDUCATION
THE FACULTY OF LANGUAGE AND FINE ARTS EDUCATION
INDONESIA UNIVERSITY OF EDUCATION
The Effectiveness of Student
Team-Achievement Division (STAD) in Improving
Junior High School Students’ Reading
Comprehension
Oleh Nunik Oktafiani
Sebuah skripsi yang diajukan untuk memenuhi salah satu syarat memperoleh gelar Sarjana pada Fakultas Pendidikan Bahasa dan Seni
© Nunik Oktafiani 2014 Universitas Pendidikan Indonesia
Juli 2014
Hak Cipta dilindungi undang-undang.
PAGE OF APPROVAL
NUNIK OKTAFIANI
0906732
THE EFFECTIVENESS OF STUDENT TEAM-ACHIEVEMENT DIVISION (STAD) IN IMPROVING JUNIOR HIGH SCHOOL STUDENTS’ READING COMPREHENSION
Approved by: First Supervisor
Prof. Dr. Nenden Sri Lengkanawati, M.Pd. NIP. 195111241985032001
Second Supervisor
Iyen Nurlaelawati, S.Pd., M.Pd. NIP. 19770906200912002
Head of English Education Department Faculty of Language and Fine Arts Education
Indonesia University of Education
THE EFFECTIVENESS OF STUDENT TEAM-ACHIEVEMENT DIVISON
(STAD) IN IMPROVING JUNIOR HIGH SCHOOL STUDENTS’ READING
COMPREHENSION
(A Quasi-Experimental Study of Eighth Grade Students at One Junior High School in Bandung)
ABSTRACT
Nunik Oktafiani (0906732)
First Supervisor: Prof. Dr. Nenden Sri Lengkanawati, M.Pd. Second Supervisor: Iyen Nurlaelawati, S.Pd., M.Pd.
This study investigated whether the use of Student Team- Achievement Division (STAD) is effective in improving junior high school students reading comprehension or not and discovered students’ responses toward this technique in teaching reading comprehension. This study employed a quasi experimental design in which two classes were taken as the samples of this study. One class was assigned as the experimental group and the other one was assigned as control group. The data were obtained through a pre-test and post-test. In addition, questionnaire was given to obtain the students’ responses toward STAD technique. The post-test scores of the two groups were compared by independent t-test. The result showed the significance value was lower than the significance level which was 0.043 < 0.05. It meant that the use of STAD effective in improving junior high school students’ reading comprehension. Moreover, the findings from questionnaire analysis indicated that most of the students gave positive responses toward the implementation of STAD. Nearly all of the students agreed that STAD technique improved their reading ability, helped them understand the text, and made them want to involve in the learning process and, moreover, to participate in the discussion.
Abstrak
Table of Contents
STATEMENT ... i
PREFACE ... ii
ACKNOWLEDGEMENT ... iii
ABSTRACT ... iv
TABLE OF CONTENTS ... v
LIST OF TABLES ... viii
LIST OF FIGURES ... xi
CHAPTER I ... Error! Bookmark not defined.
INTRODUCTION ... Error! Bookmark not defined.
1.1 Background of the Study ... Error! Bookmark not defined. 1.2 Statements of the Problem ... Error! Bookmark not defined. 1.3 Aims of the Study ... Error! Bookmark not defined. 1.4 Scope of the Study ... Error! Bookmark not defined. 1.5 Significance of the Study ... Error! Bookmark not defined. 1.6 Clarification of Key Terms... Error! Bookmark not defined. 1.7 Organization of Paper ... Error! Bookmark not defined.
CHAPTER II ... Error! Bookmark not defined.
THEORETICAL FOUNDATION ... Error! Bookmark not defined.
2.1.1 Definition of Reading ... Error! Bookmark not defined. 2.1.2 Reading Comprehension ... Error! Bookmark not defined. 2.1.3 Teaching Reading Comprehension ... Error! Bookmark not defined. 2.2 Student Teams-Achievement Division (STAD) Error! Bookmark not defined. 2.2.1 The Definition of STAD ... Error! Bookmark not defined. 2.2.2 Components of STAD ... Error! Bookmark not defined. 2.2.3 The Key Elements of STAD ... Error! Bookmark not defined. 2.3 STAD in Teaching Reading ... Error! Bookmark not defined. 2.4 Related Studies ... Error! Bookmark not defined.
CHAPTER III ... Error! Bookmark not defined.
METHODOLOGY ... Error! Bookmark not defined.
3.1 Research Design ... Error! Bookmark not defined. 3.1.1 Research Hypothesis ... Error! Bookmark not defined. 3.2 Data Collection ... Error! Bookmark not defined. 3.2.1 Population and Sample ... Error! Bookmark not defined. 3.2.2 Research Instruments ... Error! Bookmark not defined. 3.3 Research Procedure ... Error! Bookmark not defined. 3.4 Data Analysis ... Error! Bookmark not defined. 3.4.1 Scoring Technique ... Error! Bookmark not defined. 3.4.2 Data Analysis on the Pilot Test ... Error! Bookmark not defined. 3.4.3 Data Analysis on the Pre-test and Post-test Error! Bookmark not defined. 3.4.4 Questionnaire ... Error! Bookmark not defined.
FINDINGS AND DISCUSSION ... Error! Bookmark not defined.
4.1 Research Findings ... Error! Bookmark not defined. 4.1.1 Pilot Test ... Error! Bookmark not defined. 4.1.2 Pre-test Data Analysis ... Error! Bookmark not defined. 4.1.3 Post-test Data Analysis ... Error! Bookmark not defined. 4.1.4 The Result of Questionnaire ... Error! Bookmark not defined. 4.2 Discussion ... Error! Bookmark not defined. 4.2.1 The Effectiveness of STAD Technique ... Error! Bookmark not defined.
4.2.2 Students’ Response toward STAD Technique ... Error! Bookmark not
defined.
CHAPTER V ... Error! Bookmark not defined.
CONCLUSIONS AND SUGGESTIONS ... Error! Bookmark not defined.
5.1 Conclusions ... Error! Bookmark not defined. 5.2 Suggestions ... Error! Bookmark not defined.
REFERENCES……….53
APPENDICES………..
LIST OF TABLES
Table 2.1 Three Part Reading Activities ... 10
Table 2.2 Criteria of Improvement Score ... 12
Table 2.3 Criteria of Reward... 12
Table 3.1 Quasi Experimental Design ... 21
Table 3.2 Time Schedule of the Research... 26
Table 3.3 Experimental Group and Control Group Activities ... 27
Table 3.4 r Coefficient Correlation (Validity) ... 29
Table 3.5 the Criteria of Reliability ... 30
Table 3.6 Criteria of Discrimination Index ... 31
Table 3.7 the Scale of Effect Size ... 34
Table 4.1 the Interpretation of Validity Items... 37
Table 4.2 Level of Difficulty Items ... 38
LIST OF FIGURES
Figure 4.1 the Advantages of STAD ... 44
CHAPTER I
INTRODUCTION
This chapter provides an overview that includes background, statements of the problem, aims of the study, scope of the study, significance of the study, clarification of key terms, and organization of paper.
1.1 Background of the Study
Since reading is considered as an important skill in learning English, it is expected to be taught in the classroom and students are expected to be able to understand and comprehend the text. Even, the essential of learning reading especially for junior high school is clearly stated in KTSP 2006 or school-based curriculum. Unfortunately, research on reading skill in Indonesia has discovered that
students’ reading comprehension skill is still far from satisfactory (Sukyadi & Hasanah, 2010). It means that many Indonesian students still have inadequate ability to comprehend reading texts.
implicit information (inference). Moreover, the obstacle in comprehending the text
may be related to teacher’s method or technique in teaching reading. In many
schools, reading instruction still focuses on pronouncing words correctly and fluently and translating the text.
Therefore, it is necessary for teachers to find an effective technique in
teaching reading to solve the students’ problems in order to have better reading
comprehension skill. The teachers may apply the technique which allows the students to work in group and share their ideas cooperatively when they have difficulties in identifying the supporting details of the text. According to Brown (2001) teacher should take a role as a facilitator who offers guidance to the students in creating an interesting lesson. Regarding to that situation, Student Team-Achievement Division is considered as a technique to solve the problems.
According to Slavin (2005, p. 143), STAD is the most flexible technique in cooperative method because it can be applied in variety level of classes, subject matter areas, and characteristics of school. In this cooperative learning type, the teaching begins with a class presentation because the students should know what they are going to learn. After that, students are divided into groups of four or five with different academic levels, sexes, and background ethnics. In the group, all of the members discuss the material and work cooperatively. Next, each student has to take the quiz individually in order to test the students’ comprehension. The quiz uses the same topic with the material.
Willingness to gain rewards automatically forces higher achiever to assist lower achiever. The STAD method is therefore an alternative solution which may be used in teaching a large class with mixed-ability students.
There are some previous studies related to STAD technique. Van Wyk (2012) concluded that STAD can promote positive attitudes, show better achievements, and motivate students to learn. In addition, Aprianti et al (2013) found that STAD can
increase students’ motivation and improve students’ ability in reading and comprehending recount texts. The improvement can be seen from the students’ result from the first test to the last test. It was seen from the result of observation sheets that
showed the percentage of students’ activity in every meeting. Furthermore, Anto et al
(2013) also state that STAD is more effective to be used in teaching reading than conventional method. In STAD classroom, students have better reading competence than students in conventional classroom do.
Observing the implementation of STAD, this study investigates not only the
effectiveness of STAD in improving junior high school students’ comprehension in reading, but also students’ responses toward the use of STAD technique in their
reading activity.
1.2 Statements of the Problem
This study is conducted to answer the following research questions:
1. Is STAD technique effective in improving junior high school students’ reading comprehension?
2. What are the students’ responses toward STAD in teaching reading comprehension?
1.3 Aims of the Study
The aims of this study are to find out the effectiveness of STAD in improving
responses toward the use of STAD technique in their reading comprehension activities.
1.4 Scope of the Study
This study limits its investigation into two aspects. The first one is the effectiveness of the STAD technique in improving junior high school students’ reading comprehension. The second one is about the learners’ responses toward the use of STAD in their reading activity. This study is conducted in one of junior high schools located in Bandung.
1.5 Significance of the Study
This study is expected to help the writer to enrich the knowledge about STAD technique in teaching reading to junior high school students. Furthermore, this study makes the teachers more realize that STAD is worth trying in teaching reading comprehension especially in junior high school. This study also helps students to improve their ability in comprehending the English text in learning process and also to gain their self confidence in expressing their idea.
1.6 Clarification of Key Terms
In order to avoid misunderstanding, there are some terms that need to be clarified in this study, as follows.
1. Reading comprehension refers to activity that requires the ability of reading to get the correct messages from the text which is intended for the readers (Nuttal, 1996, as cited in Gilakjani and Ahmadi, 2011). Reading comprehension in this study refers to the language skill which was taught to the students in the experimental group and the control group by using different technique.
3. Student Teams-Achievement Divisions (STAD) in this study refers to instructional technique that involves students to work in groups of four or five
cooperatively in order to enhance students’ comprehension of a text which
covers: identifying main idea, identifying supporting detail, vocabulary, and making inferences. In this study, this technique was used in the experimental group to teach reading comprehension.
1.7 Organization of Paper
Chapter I is introduction. This chapter provides information about background of the study, statements of the problem, aims of the study, scope of the study, significance of the study, clarification of key terms and organization of paper.
Chapter II is Theoretical Foundation of the Study. This chapter consists of the theories and findings from other related research about teaching reading comprehension and STAD technique of cooperative learning.
Chapter III is Research Methodology. This chapter presents the methodology of the study, which includes the method and the design used, research instrument, hypothesis, data collection, research procedure, and data collection.
CHAPTER III
METHODOLOGY
This chapter describes the procedures of the study in order to find out the research questions which are (1) Is STAD technique effective in improving junior
high school students’ reading comprehension? (2) What are the students’ responses toward STAD in teaching reading comprehension? This chapter consists of research design, variables, research hypothesis, research site and participant, research instrument, research procedures, data collection, and data analysis.
3.1 Research Design
This research was conducted based on quasi-experimental research. According to Creswell (2005, cited in Chavez, 2008) quasi-experimental research is designed to describe a relationship between variables or to predict an outcome. This
research investigates the improvement of students’ reading comprehension using
STAD technique. There were two classes taken as the subjects groups in this research. The first group was an experimental group, which was given the treatment of the research, while the second group was a control group, which was taught using the conventional teaching method in which the teacher lectured the students in three phases (pre-, while-, post-). Thus, the research used an experimental design with the pre-test and post-test control group design.
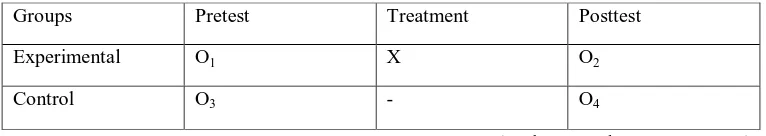
Table 3.1
Quasi Experimental Design
(Cohen et al, 2007, p. 283) Notes
X : the exposure of a group to an experimental variable O : the process of observation measurement
From the table above, both classes were given the same test; pre-test and post-test but they got different treatments. After the pre-post-test, the experimental group was given STAD technique as the treatment for four times, while the control group was given conventional teaching method. After the treatment, post-test was given to both groups. The aim of this research is to find out whether the students who were taught by using STAD technique could get higher score than those who were taught using the conventional technique or not.
Variable is defined as an attribute of a person or an object which differs from person to person, text to text, object to object, or time to time (Hatch and Lazaraton, 1991, p. 63). There are two variables which were investigated in this research; they are independent variable and dependent variable. Independent variable is the variable which influences dependent variable, while dependent variable is the variable that will be affected by independent variable (Coolidge, 2000, p. 15).
For this research, the implementation of STAD was chosen as the independent variable because this technique is the major variable to be investigated. Teaching reading comprehension was chosen as the dependent variable.
Groups Pretest Treatment Posttest
Experimental O1 X O2
3.1.1 Research Hypothesis
Hypothesis is one of the important aspects in this research because it can predict or temporarily answer the research problems. Hypothesis can be described as a statement about the possible outcome of the research (Hatch & Lazaraton, 1991, p. 24). For this research, there are two hypothesis taken which are null hypothesis and alternative hypothesis.
Null hypothesis of this study is when there is no significant difference between the post-test means of control after applying the treatments. Whereas, the alternative hypothesis is when there is significant difference between the post-test means of control and experimental group after applying the treatments. The hypothesis in this study is formulated as follows.
H0 : µ control = µ experimental
Ha : µ control ≠ µ experimental
3.2 Data Collection
3.2.1 Population and Sample
The population of this research was the second grade students in one of the junior high school in Bandung. The population taken was due to these considerations: 1) the students had learned basic English; 2) due to the limitation of time, costs, and energy of the researcher, so the research population was only second graders in the related school in Bandung where the researcher had an experience in doing internship in the school before; 3) because the researcher had an experience in teaching in the school before, the characteristics of population has been identified, for example the
similarity of students’ English ability. The last consideration was in line with
The sample of this research were two diverse classes; they were VIII-A as the experimental group and class VIII-C as the control group. Each class consisted of 35 students. However to anticipate the absence of the sample of the research, this research only took 25 students from each class as the sample. As a result, the total fixed numbers of the sample was 50 students. Both groups had similar characteristic, such as ability in reading comprehension. During the execution of the research, students of VIII-A as the experimental group was taught by STAD technique as the treatment for four meetings.
3.2.2 Research Instruments
In this study, two kinds of research instruments were employed. They were test (pre-test and post-test) and questionnaire. The research instruments are explained below.
3.2.2.1 Reading Comprehension Test
Reading comprehension test was used as the instrument of this research to
measure students’ reading ability. This reading test comprises 20 multiple choice
items which were tested to the experimental and control classes. The reading comprehension test was used as pre-test and post-test and given to the both groups. Pre-test was aimed to discover the students’ previous ability in reading and post-test
was done to assess students’ reading ability after having the treatment.
research, appropriateness of the reading passages, and the relevance of the items to the curriculum. Reading comprehension test used was provided in the appendix B.
3.2.2.2 Questionnaire
To investigate the students’ response toward the implementation of STAD
technique, the questionnaire was held. It was given to the group who got the treatment. This instrument was given after the post-test. The rationale of using questionnaire is because questionnaire is suitable for obtaining more data without spending too much time
The type of questionnaire used in this study was closed-ended questionnaire. Questions and responses for this type of items used Guttman scale categories. The questionnaire was set in a form of checklist. The questions were arranged from the general to the specific. It consisted of 10 of “yes” or “no” questions in bahasa Indonesia to avoid misunderstanding from the participants. It was in line with Sugiyono (2010) who states that the use of language in the questionnaire should be easy and adjusted to the social and culture of respondent. As the scoring system of
Guttman scale categories, the answer “yes” was counted 1 and the answer “no” was
counted 0. The questionnaire used in this study can be seen in the appendix B.
3.3 Research Procedure
The research was conducted from March 10th to April 10th of 2014. The steps of the research procedures were as follow:
1. Preparing the Lesson Plan
addition, method/technique, steps of the activity, source lesson, and the evaluation were also involved.
2. Organizing the Research Instruments
Organizing the research instrument includes creating the test item for both pre-test and post-test, piloting the pre-test and post-test and constructing questions for questionnaire.
3. Administering Pilot Test
Pilot-test was done for testing the test whether the test was valid and reliable to be tested for eight grade students or not. Pilot test consisted of fifty multiple choice questions related to texts with one genre that was recount text. The test materials were adapted from several textbooks used by the second grade of junior high school students and also articles from the internet and national examination.
4. Administering Pretest
After conducting the pilot test and finding the validity and reliability of the result of the instrument, the pretest was held at the first meeting of the research. The pretest aimed to get the data about the previous reading ability of the students and to find out that the students from both group had same capability and same English proficiency before given the instrument.
5. Conducting Treatment
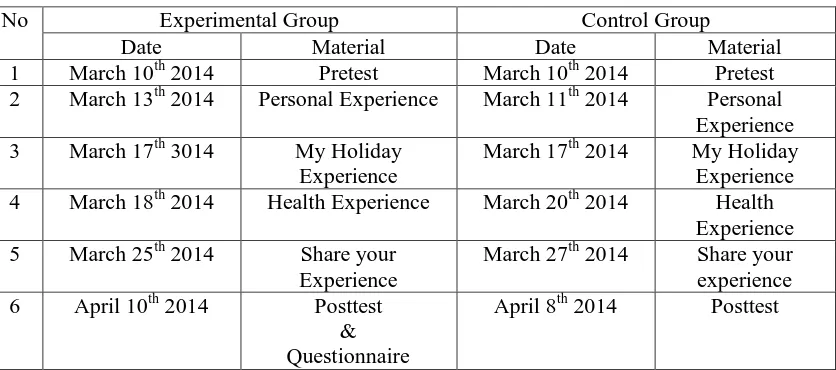
Table 3.2
Time Schedule of the Research
No Experimental Group Control Group
Date Material Date Material
1 March 10th 2014 Pretest March 10th 2014 Pretest meetings of classroom activities. Classroom activities in the experimental group were emphasized on group discussion which is ended by individual quiz. The group consisted of four to five students with different achievement level which was based
Table 3.3
Experimental Group and Control Group Classroom Activities
Meeting Reading - Teacher reads the text followed by students - In group, students give a title of the text, and answer comprehension questions on the worksheet
- Teacher observes the process and gives intervention if needed
- Students take individual quiz
- Teacher counts students’ improvement score and gives reward
- Summarizing the material and providing feedback
- Brainstorming about personal experience
- Teacher reads the text followed by students
- Students make a list of vocabulary - Students give a title of the text - Students answer comprehension
questions on the worksheet
- Teacher counts students’ improvement score and gives reward
- Summarizing the material and providing feedback
- Brainstorming about holiday activities
- Students arrange the paragraph - Students make a list of vocabulary
- Teacher explains how to find mind idea
- Teacher reads the text followed by students - In group, students discuss the material and answer comprehension questions on the worksheet
- Teacher reads the text followed by students
- Students make a list vocabulary - Students answer comprehension
questions on the worksheet
- Brainstorming about experience in writing a letter
- Teacher explains about verb 2 and pronoun referent briefly
- Brainstorming about experience in writing a letter
- Teacher explains verb 2 and pronoun referent
- In group, students discuss the material, complete the text and answer comprehension questions on the worksheet
- Teacher observes the process and gives intervention if needed
- Students take individual quiz
- Teacher counts students’ improvement score and gives reward
-Summarizing the material and providing feedback
6. Administering Post-test
The last meeting of the research was post-test which was held to both experimental group and control group. The test was same with the pre-test. It was
conducted to measure the students’ reading comprehension ability after receiving the treatment. It also aimed to find out the difference of the students score of both groups. 7. Administering Questionnaire
The questionnaire was distributed to 35 students but the researcher only took 25 as many as the samples in experimental group. The questionnaire was given to
investigate the students’ perception towards the implementation of STAD in teaching
reading comprehension. The questions of the questionnaire were presented in the appendix B.
3.4 Data Analysis
The data of the research was analyzed through several steps including scoring technique, data analysis on the pilot test, data analysis on pre-test and post-test, and data analysis on the questionnaire.
3.4.1 Scoring Technique
3.4.2 Data Analysis on the Pilot Test
Before applying the instrument to experimental and control group, the value of its validity and reliability was sought. Therefore, the pilot test was conducted. There are 50 items of multiple choice were tested to 30 students in similar level which were beyond the sample of the study.
Moreover, difficulty and discrimination test of the instrument were also analyzed to discriminate between the higher ability test takers and the lower ability test takers. The test was done to see whether the test items were relevant with the population or not.
3.4.2.1 Data Analysis on the Validity Test
Validity refers to the appropriateness of a given test to measure of what it is supposed to measure (Henning, 1987; cited in Alderson et al, 1995, p. 170). Therefore, validity test was measured to support any inferences that the writer made based on the data gained using particular instrument.
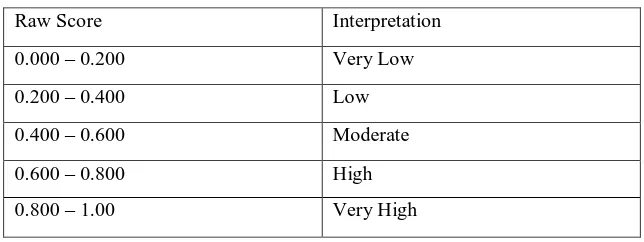
In order to make the validity of the test, the researcher used the assistance of Anates V4. The index validity of each item was interpreted with the following criteria:
Table 3.4
r Coefficient Correlation (Validity)
Raw Score Interpretation
0.000 – 0.200 Very Low
0.200 – 0.400 Low
0.400 – 0.600 Moderate
0.600 – 0.800 High
0.800 – 1.00 Very High
3.4.2.2 Data Analysis on the Reliability Test
The reliability test is defined as the extent to which a result can be considered stable when administered under similar condition (Brown, 1996, p. 192). To test the
reliability, the Cronbach’s alpha in SPSS 16 for Windows was used. The finding was interpreted according to the following criteria:
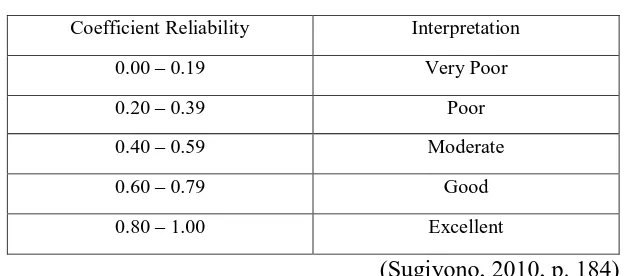
Table 3.5
The Criteria of Reliability
Coefficient Reliability Interpretation
0.00 – 0.19 Very Poor
0.20 – 0.39 Poor
0.40 – 0.59 Moderate
0.60 – 0.79 Good
0.80 – 1.00 Excellent
(Sugiyono, 2010, p. 184)
If the value of Cronbach’s alpha of the test reaches the range 0,40 to 1,00, the test is
considered to be reliable to be used. In contrast, if the value is less than 0.40, the test is considered inappropriate to be used in the study.
3.4.2.3 Difficulty
Difficulty level was defined as the proportion of the test takers who answer the correct item (Fulcher and Davidson, 2007, p. 102). This test was used to measure
whether the item is relevant to the students’ ability or not. In this study, the difficulty level was measured by using ANATES V4.
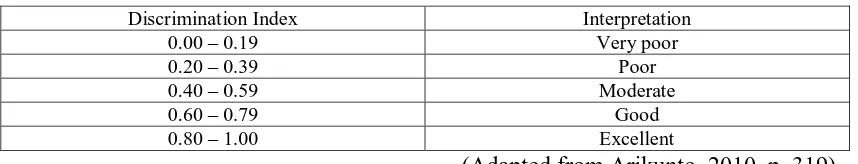
3.4.2.4 Discrimination Index
It is important to know how each item discriminates and distinguishes students at different level of ability. Getting correct answer is directly related to more ability in question and getting wrong answer is directly related to less ability in question (Henning, 1987, p. 50, cited in Fulcher and Davidson, 2007, p. 102).
In this study, ANATES V4 was used in calculating the discrimination item. The result was interpreted according to the following criteria:
Table 3.6
Criteria of Discrimination Index
Discrimination Index Interpretation
0.00 – 0.19 Very poor
0.20 – 0.39 Poor
0.40 – 0.59 Moderate
0.60 – 0.79 Good
0.80 – 1.00 Excellent
(Adapted from Arikunto, 2010, p. 319)
3.4.3 Data Analysis on the Pre-test and Post-test
3.4.3.1 Normality of Distribution Test
According to Kranzler & Moursund (1999) normality distribution is one formula used to analyze whether the data is in normal distribution or not. The data in
this study are students’ pre-test and post-test scores. Normal distribution test was conducted in this study to see whether the data were distributed between the highest score and the lowest score. The distribution of the data in this study was examined by using the Kolmogorov-Smirnov test that was employed through SPSS 16 for Windows. It was conducted in three steps. The first step was stating the hypothesis and setting the alpha level at 0.05 and it was two tailed test. The hypothesis was stated as the following
H0 = the scores of the experimental and the control group are normally
HA = the scores of the experimental and the control are not normally
distributed
The second was analyzing the data by using Kolmogrov-Smirnov formula in SPSS 16. The last step was Comparing the Asymp Sig with The Level of significance to the test hypothesis. If it is lower than the set alpha level (p < 0.05), the null hypothesis will not be retained, which means that distribution of the sample is probably not normal. In contrast, if the output is greater than the set alpha level (p > 0.05), the null hypothesis is accepted, which means the scores are normally distributed.
3.4.3.2 The Homogeneity of Variance Test
The test was conducted after doing the normality of distribution test. In this study, the test was aimed at determining whether or not the variance of the experimental and the control groups was homogeneous. It was important to be done because the scores in this study were taken from separate groups in one population. In analyzing the variance homogeneity of the scores, this study used The Levene Test Formula in SPSS 16 for Windows. This test was conducted in three steps. The first step was stating the hypothesis and setting alpha level at 0.05. The hypothesis is stated as the following:
H0 = the variances of the experimental and the control group are homogeneous
HA= the variances of the experimental and the control group are not
homogeneous
3.4.3.3 The Independent t-test
After the data about students’ reading comprehension ability had been proven
as a normal distribution, the data were calculated using independent t-test. The independent t-test in this study is used to measure the effectiveness of STAD. In this study, independent t-test was analyzed using SPSS 16 by comparing the level of significance to test the hypothesis as follows.
H0 = there are no significant differences between the pre-test/post-test mean of the
experimental and the control groups.
Ha = there are significant differences between the pre-test/post-test mean of the
experimental and the control groups.
If the result shows the significant value is more than or equal with the level of significance (0.05), the null hypothesis is accepted and it will be concluded that there is no significance difference between the two means. On the other hand, the null hypothesis will be rejected if the significant value is less than the level of significance (0.05). It means that the means is significantly different from the other mean.
3.4.3.4 Dependent t-test
The dependent t-test, in this case, was employed to find out the progress of the
students’ reading comprehension ability of the experimental group after getting
STAD technique as the treatment. Dependent t-test in this study was analyzed using SPSS 16. To examine the dependent t-test, there are some steps to follow: stating alpha level ( p = .05); stating null hypothesis; employing the dependent t-test; interpreting the result. The null hypothesis is that there is no difference between the pre-test and the post-test score which means no progress or improvement.
As the result obtained, it was compared to tcritical. If tobtained is equal to or
greater than tcritical, the null hypothesis can be rejected, and if tobtained < tcritical, the null
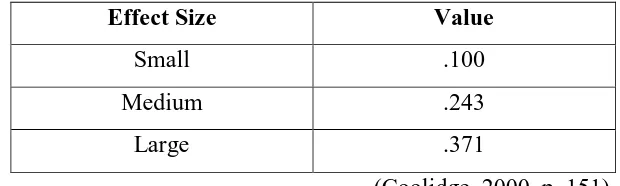
3.4.3.5 The calculation of effect size
The calculation correlation of the effect size was calculated to measure how well the treatment test worked and to know the influence of independent variable upon the dependent variable (Coolidge, 2000, p. 151). In this study, the effect size is
used to measure how well STAD technique can improve the students’ reading
comprehension. The formula of effect size can be derived as follows:
Note:
r = effect size
t = tobt or t value from the calculation of independent t-test
df = N1 + N2– 2
Value of effect size was interpreted by the following scale:
Table 3.7
The Scale of Effect Size
Effect Size Value
Small .100
Medium .243
Large .371
3.4.4 Questionnaire
Questionnaire in this study was employed in order to find out the information and toelaborate the data concerning the research question about students’ responses toward the use of STAD in improving reading comprehension. The questionnaires were distributed to the experimental group.
. Afterwards, the data from questionnaire were analyzed based on the
frequency of students’ answer. The data gained from questionnaires were calculated using thepercentage scale formula. The formula is as follows:
P = x 100 P = Percentage