USING DOUBLE NUMBER LINE TO SUPPORT STUDENTS IN LEARNING
RATIO AND SCALE
Wisnuningtyas Wirani1, Siti M. Amin2, Agung Lukito3, Monica Wijers4, Dolly van Eerde5
Surabaya State University1,2,3, Utrecht University4,5
1) [email protected], 2) [email protected], 3) [email protected], 4) [email protected], 5) [email protected]
Abstract
According to studies, students use addition in solving ratio problems. However, ratio relates to the notion of multiplication or division. To support students in learning ratio, especially the concept of multiplicative comparison and composed unit, we designed a local instruction theory which employs the double number line as the model. In line with the aim of the design research approach, the study aims at contributing on the innovation of instructional design. Five fifth graders of SDIT At Taqwa participated on the first cycle of the study. During the learning, the students were able to express the notion of multiplicative comparison and composed unit using the double number line. The result of the analysis of the study implies that the local instruction theory which employs the double number line supports students in learning ratio.
Key Words: ratio, scale, double number line, composed unit, multiplicative comparison, RME, local instructional theory
INTRODUCTION
Several studies report that students find difficulty in solving ratio using multiplication (Hart, 1984; Karplus, Karplus, & Wollman, 1974; Küchemann, Hodgen, & Brown, 2014; Singh, 2000). Karplus et al. (1974) finds that students have a tendency to do addition in finding the equivalent ratio of 3/2, while for the ratio 2/1 students were able to find its equivalent ratios by using proportion. A decade later, (art 4 investigated students’ errors in solving ratio problems and found out that students normally use the building up method by using addition to solve ratio problems. Singh (2000) confirms the previous findings. He reports that students used formal method to solve proportion problems. Moreover, students used subtraction and addition to solve proportion problems. Especially when students could not obtain integer relationship between two numbers. The process of using addition or subtraction to solve ratio problems contradict one of the two key concepts of ratio, multiplicative comparison.
it may help students to perceive the relationship between numbers on the line (Abels, Wijers, Pligge, & Hedges, 2006).
In Indonesia, the study about students learning ratio is rare. We do not have enough information about how Indonesian students learn ratio, especially the concept of multiplicative comparison. Observing the Indonesian mathematics textbook, students are led to learn ratio without using any model. In addition, the lack of mathematical activity which enable students to investigate the concept of ratio, leads the teacher to instruct students to use formal method in solving ratio problems. The disadvantage of using formal method is doing the wrong cross multiplication (Ellis, 2013). Students who do not grasp the concept of ratio have a possibility to operate the numbers incorrectly.
Learning ratio in elementary school becomes a foundation for students in learning proportion in secondary school. Students will need to reason about the slope in the linear equation (Rathouz, Cengiz, Krebs, & Rubenstein, 2014). The slope or the gradient of the linear equation is also a representation of ratio. In fact, the gradient illustrates the same value of different ratios which usually called as equivalent ratios.
Considering the lack of study about ratio and mathematical activities which encourage students to investigate the concept of ratio in Indonesian mathematics classroom, there should be a study which employs learning instructions about ratio. These learning instructions are expected to help students to grasp the concept of ratio using double number line as a supportive model.
To encounter the mentioned problems and to investigate how students learn ratio, we design learning sequences about ratio and scale. Furthermore, the study involves a supportive model namely double number line. We choose map and travelling contexts to support the emergent modelling in learning ratio and scale. The study aims to contribute to the development of local instructional theory on ratio and scale, especially in Indonesia. According to the aim of the research, we propose a research question for this study: How can the double number line support students in learning ratio and scale?”
THEORETICAL FRAMEWORK
Lamon defines ratio as a comparison between two quantities. Based on Lamon’s definition, scale is also a ratio. It compares two quantities, the real distance and the distance on the map. According to Ellis (2010, in Rathouz et al., 2014), there are two key concepts of ratio, multiplicative comparison and composed unit. The key concepts can be used to determine the equivalent ratios.
In designing learning instructional theory on ratio, we use Realistic Mathematics Education (RME). According to Gravemeijer (1997), there are three key principles of RME:
The study focuses on the self-developed models which is also called as emergent modelling. In emergent modelling, there are four different levels (Gravemeijer, 1997): 1) Situational level
2)Referential level 3)General level 4) Formal level
METHOD
To match the aim of the study, we choose design research as the approach of this study. Another reason of choosing design research as the approach of this study is because design research provides insights about innovative ways of teaching (van Eerde, 2013). In this study, we designed five meetings about ratio and scale. There were two cycles in the study. However, in this paper we will only discuss the activities on the first cycle. We may say that the first cycle is the pilot study and the second cycle is the real experiment. In the first cycle, the researcher became the teacher while in the second cycle, the regular teacher played a role as the teacher. The participants of the first cycle were students in a small group (five students). The students were divided into two groups, the girls group and the boys group. For the second cycle, the participants were the teacher and students in one classroom. We collected data from video registrations, pretest, students’ work, posttest, and interview. To analyze the collected data, we compared the HLT to the actual learning.
RESULT AND DISCUSSION
In this paper, the researcher focuses on the third meeting of the first cycle. In the first activity, the students worked in groups. They needed to make a double scale line for a certain Bali map. Before the students worked on the problem, the researcher discussed about the double scale line with the students.
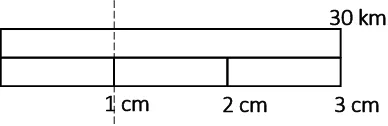
In the previous meeting, the students struggled to use the double scale line to show the relationship between the distance on the map and the real distance. To help the students, the researcher gave an example of a double scale line which represents a certain comparison between the real distance and the distance on the map. First, the researcher drew two lines with the same length. For the lower line, the researcher divided the line into three equal parts. Each part has length of 1 cm (see figure 1). The researcher asked the students what will be the real distance for 1 cm.
Figure 1: An illustration of a double scale line which represents ratio 3 cm:30 km
The students struggles when it comes to division or multiplication. The researcher asked the students to state the small part using fraction. However, it was also difficult for them.
30 km
It took a long time for them to answer. Finally a student named Lili stated that one small part of the whole equals to one-third. Another student added that for 1 cm, it represents 10 km.
Once the review has finished, the class focused on the problem in the first activity. Given, 4 cm on a certain Bali map represents 80 km. The students were asked to draw the double scale line on the board. Considering the real 4 cm on the board would not be clear to see, the researcher asked the students to draw a larger representation of 4 cm. The students understood that they had to draw an exact 4 cm to represent the relationship between the distance on the map and the real distance into a double scale line.
In accordance with the HLT, the students drew inappropriate information about the relationship between the distance on the map and the real distance (see figure 2).
Figure 2: The example of the students’ work on the board
From figure 2, the student drew two lines with the same length. He divided the lower line into four smaller parts and put information for every smaller part equals to 4 cm. In addition, the student put information 80 km in the end of the upper line. When the researcher asked the students to reason about the drawing and the information, none of them were able to explain. Therefore, the researcher cleared the students’ confusion by telling since 4 cm represents 80 km, the information should be put on the same vertical line. From the drawing, the students divided the lower line into four smaller parts. Since one smaller part represents 1 cm, the 4 cm should be placed in the end of the lower line.
To check whether the students have understood, the researcher asked a similar question. Given, 3 cm on the map represents 60 km. One student named Aisyah volunteered to draw and to give an explanation. The students drew a double scale line as in figure 3. Fragment
illustrates the student’s explanation about her illustration.
Figure 3: An illustration of the student’s double scale line
Fragment 1: Using division to determine the real distance for one smaller part of the lower line on the double scale line
1 2 3 4 5 6
Researcher
Aisyah Researcher Aisyah Researcher
: Can you explain your illustration? Why did you put information 60 km and 3 cm there?
: Because 3 cm equals 60 km. : Hmm, then?
: It is 3 cm because each small part is 1 cm.
: If one small part is 1 cm, then what is its real distance? 60 km
7 8 9
Aisyah Researcher Aisyah
: 20.
: How did you know? : From 60, 60 divided by 3.
From the transcript, we may say that the student put 3 cm on the same vertical line as 60 km because she understands that 3 cm on the map represents 60 km. Therefore, the information should be on the same vertical line. In addition, the student knew that 1 cm represents 20 km. The student used division to determine the real distance for 1 cm on the map. It is possible that the student focus on the relationship between numbers on the double scale line to determine the real distance for given distance on the map.
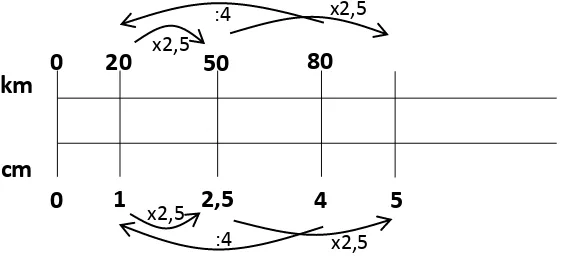
After the researcher asked the similar question, the students started to realize and drew the correct double scale line on their worksheet. Figure 4 shows an example of the students’ work. The student divided the lower line into four smaller parts. Moreover, she put appropriate information on the double scale line. Since one smaller part represents 1 cm and 4 cm on the map represents 80 km, she put 4 cm and 80 km on the same vertical line which is placed in the end of the line.
Figure 4: The example of the students’ answer of an appropriate double scale line
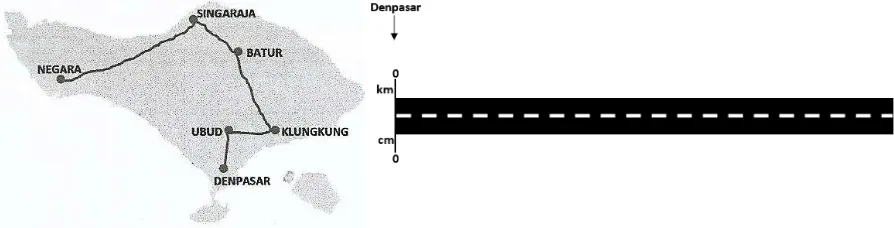
In the next activity, the students had to determine the real distances of several places from Denpasar if the distances on the map are given. Not forget to mention, information from the previous activity also used in this problem, 4 cm on the map represents 80 km. There is a picture of Bali map which contains a route and the route is stretched as in figure 5. The students had to use the stretched line to show how they determine the real distances.
Figure 5: Bali map and the stretched route
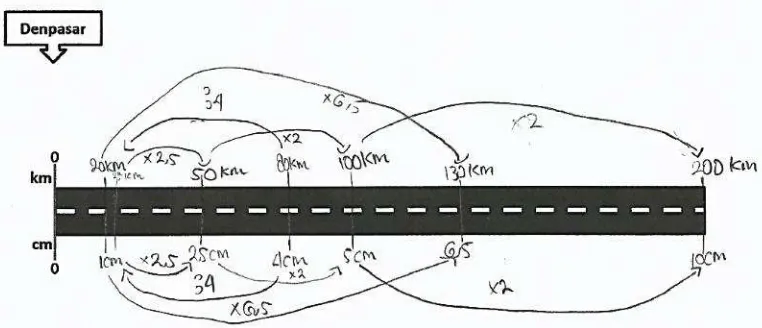
One student named Rangga became a volunteer to work on the problem. He was able to draw the stretched route, to write some of the given information on the stretched route, and to work on the problems with the help of his friends. Figure 6 illustrates the model he drew. The student was able to find the multiplicative relationship between numbers. To show the multiplicative comparison between numbers, the researcher asked the student to draw lines with arrows so that other students can follow the steps of his work.
Figure 6: An illustration of the student’s work on the board
Fragment illustrates the student’s struggle to work with the model and see the relationship between numbers. The student took a long time to think. Therefore, the researcher asked his friends to help him.
Fragment 2: The student’s struggle in solving the problem
1
: (drawing the position of 5 cm on the model) : Okay.
…
: How do you get 5 using the known numbers? : Multiply it.
: Multiply? Multiply by what? : Multiply by this. (pointing at 4) : (think again) By this. (pointing at 2,5) : Then? 2,5 times what which is equal to 5? : Me!
: Two! (drawing a line from to 2,5 to 5) : Now, try it yourself Rangga.
: (asking Ganang) What is the direction of the arrow? : (completing the line with an arrow directed to 5) …
: (talking about numbers on the lower line) You see, 2,5 is here. From here (pointing at 2,5) to here (pointing at 5) is multiplied by 2. Then how many is it? (the real distance on the upper line) : Multiplied by 2.
: 2 (the scale factor on the upper line) multiplied by what? : By 50.
students about a number line, in which the numbers on the line are well ordered. By ordering the given numbers, we may help the students to reason if there is an incorrect answer, for instance the real distance on the left side is greater than the real distance on the right side.
Line 7 illustrates that Ganang did not pay attention to the numbers when he answered to multiply a known number with a scale factor to get 5. After he thought well, he realized that it was difficult to multiply 4 as the known number with a scale factor to get 5. Using the known numbers, he was able to choose a number and to make a connection from 2,5 to 5. Rather than using 4, it was easier for him to multiply 2,5 with a scale factor to get 5, that is 2.
In line 19, the researcher asked the students what number on the upper line which is multiplied by the scale factor 2. By asking the question, the researcher wanted to know whether the students only guessed or they truly understood what they need to do to determine the real distance. When the student mentioned that 2 multiplied by 50, it means that the students had the notion of ratio as a composed unit. To find an equivalent ratio, the students must be able to perceive numbers on the same vertical line as a composed unit (1 and 20; 2,5 and 50; 4 and 80). Later, they had to multiply the composed unit with a scale factor.
After the students drew lines and arrows on the board, other students followed to express the multiplicative comparison between numbers using lines and arrows. Not only to show the relationship between numbers, but also to show the steps of their work. As seen in figure 7, the student used lines and arrows to show how she solved the problem. Observing the model, we knew that the student started from the given information 4 cm on the map represents 80 km. Even though the student found 1 cm on the map represents 20 km, she did not use 1 cm every time she tried to relate other numbers. In addition, we may know that the students did not pay attention to the exact measurement between numbers. The students estimated the location of 4 cm on the model and ordered other given numbers on the model.
CONCLUSION
The activities on the third meeting focus on supporting the students to order the given numbers on the more formal model and to express the notion of multiplicative comparison between numbers using the model. According to the analysis, the activities can support the students to work with the more formal model and to illustrate the relationship between numbers by using multiplicative comparison.
At first, the students had to order the given numbers on the model. By ordering the given numbers, it enables the students to see the relationship between numbers. Next, the students started to solve the problem by making a multiplicative relationship between numbers. Even though the students did not learn the term multiplicative comparison , they understood that they needed to do multiplication or division to determine the real distances. The students showed the relationship between numbers using lines, arrows, and the relationship (multiplication or division). By giving lines and arrows, it enables other students to follow the steps in solving the problem. Other than that, the process of multiplying or dividing numbers on the same vertical line with a scale factor illustrates that the students had the notion of ratio as a composed unit.
)n general, the activities on the third meeting can support students’ in learning ratio and scale. However, the activities cannot be well implemented without the support of the teacher. It is important for the teacher to support students with relevant questions related to ratio and to orchestrate the discussion.
ACKNOWLEDGEMENTS
The author thanks Direktorat Jenderal Pendidikan Tinggi for funding the study (1794.1/E4.4/2013).
REFERENCES
Abels, M., Wijers, M., Pligge, M. A., & Hedges, T. (2006). Models you can count on. Chicago: Encyclopædia Britannica, Inc.
Ellis, A. (2013). Teaching Ratio and Proportion in the Middle Grades. Retrieved from http://www.nctm.org/uploadedFiles/Research_News_and_Advocacy/Research/Cl
ips_and_Briefs/research%20brief%2021%20-%20Teaching%20Ratio%20and%20Proportion%20in%20the%20Middle%20Gra des_Final(1).pdf
Gravemeijer, K. (1997). Mediating Between Concrete and Abstract. In T. Nunes, & P. Bryant (Eds.), Learning and Teaching Mathematics: An International Perspective (pp. 315-345). East Sussex: Psychology Press.
Hart, K. M. (1984). Ratio: Children's Strategies and Errors. Berkshire: NFER-NELSON.
Karplus, E. F., Karplus, R., & Wollman, W. (1974, October). Intellectual development beyond elementary school IV: Ratio, the influence of cognitive style. School Science and Mathematics, 74(6), 476-482. doi:10.1111/j.1949-8594.1974.tb08937.x
Lamon, S. J. (2012). Teaching fractions and ratios for understanding: essential content knowledge and instructional strategies for teachers (3rd ed.). New York: Taylor & Francis.
Rathouz, M., Cengiz, N., Krebs, A., & Rubenstein, R. N. (2014). Tasks to develop language for ratio relationships. Mathematics Teaching in the Middle School, 20(1), 38-44.
Singh, P. (2000). Understanding the concept of proportion and ratio constructed by two grade six students. Educational Studies in Mathematics, 271-292.
van Eerde, D. (2013). Design research: Looking into the heart of mathematics education. The First South East Asia Design/Development Research (SEA-DR) International
Conference, (pp. 1-11). Palembang. Retrieved from