Gadjah Mada International Journal of Business September-December 2009, Vol. 11, No. 3, pp. 361–391
FACTORS AFFECTING CHOICE
IN A MULTI-STAGE MODEL
The Influence of Saliency and Similarity on Retrieval
Set and the Implication of Context Effect on
Consideration Set
Eric Santosa
Unisbank Semarang, IndonesiaWhile it is considered a new paradigm in consumer research, the multi-stage model of consumer decision-making remains un-clear as to whether brands are easily retrieved. Likewise, the process of consideration, after particular brands are successfully retrieved, is still in question. This study purports to investigate the effects of saliency and similarity on the ease of retrieval. In addition, referring to some studies of context effect, the effects of attraction, compromise, and assimilation are examined to observe whether they contribute to consideration. A within-subject design is employed in this study. Previously, three preliminary studies are arranged to determine the dominants, new entrants, attributes, and other criteria nominated in the experimental study. The results turn out to be supporting the hypotheses.
Introduction
The multi-stage model asserts that a choice should be produced from a process of sequence. First of all, a product or a brand that falls into a choice should be available in a re-trieval set. The rere-trieval set consists of products or brands successfully re-trieved from all products or brands available in the market. Secondly, a choice should be produced from the retrieved products or brands that are fruitfully considered in a consideration set. Consequently, products or brands not successfully retrieved and/or con-sidered are not potentially taken.
According to literature and previ-ous studies, the process of retrieval is influenced by several factors, such as primacy, recency, distinctiveness, first-mover product, pioneer product, fre-quency, saliency, the strength of asso-ciation between the brand node and other active nodes, and the availability of retrieval cues (i.e., category, brand, and attribute). Likewise, the process in the consideration set is affected by some factors, such as price, design, quality, color, etc., which are likely compensatory or non-compensatory. If there are two or more products in a particular situation of similar price, design, quality, or color, which one will be considered? Consumers may find a difficulty making a decision. In such a situation, the theory of attrac-tion effect and compromise effect might be helpful. The theory of attrac-tion effect postulates that a particular
the other when a third product is in-serted into the set due to its dominating position. The compromise effect rec-ommends that a particular product pose a compromise position when a third product inserted is more considerably of choice.
Meanwhile, another situation may prevail. While the third product in-serted is inferior to the two existing products, whether of a particular at-tribute or more, how big is its chance to be considered? The dominating prod-uct is obviously taken into account. The third will have a high chance too under the circumstances that it is alike to the dominating product. The last situation refers to the theory of assimi-lated effect. Whether the product ex-erts domination, compromise, or as-similation should be carried out from the retrieval set. Therefore, the pur-pose of this study is to examine par-ticular products, whether the existing or the new ones —which pose any of the three effects (i.e., domination, com-promise, assimilation) or even two of the three —are products successfully retrieved due to their saliency or simi-larity. Furthermore, this research aims to investigate whether the attraction effect, the compromise effect, and the assimilation effect work in the consid-eration set.
In addition, the effects of attraction, compromise, and assimilation are also activated in the consideration set. The implications of these findings on con-sumer decision research are then dis-cussed.
Theoretical Developments
It is widely believed that choice involves uncertainty about future con-sequences of current actions and un-certainty as to future preferences re-garding those consequences (March 1978; Savage 1954). While there is often uncertainty as to the true values of alternatives of different attributes, consumers may also be uncertain about the weights of the attributes and on their preferences for different combi-nations of attribute values (Simonson 1989).
Some studies demonstrate that individual choice behavior under pref-erence uncertainty can better be un-derstood when analyzed based on avail-able reasons or justifications for and against each alternative (Montgomery 1983; Slovic 1975; Slovic, Fischhoff and Lichtenstein 1982; Tversky in Simonson 1989). In particular, Mont-gomery (1983) suggests that decision makers determine that they are pre-pared to make a choice when they find arguments strong enough for making a decision. Likewise, Slovic (1975) de-fines that decision makers faced with a need for choosing between two equally valued alternatives tend to prefer the one that is superior in more important attributes.
Bettman (1979) introduced an in-tegration processes theory. According to the theory, in making a decision, consumer is facilitated through two ways: (1) compensatory and (2) non-compensatory integration processes. The compensatory integration process combines all beliefs about the conse-quences of the choice alternatives to form an overall evaluation toward each alternative. On the other hand, the non-compensatory integration process ac-counts for beliefs about the positive and negative consequences of the choice alternatives but does not com-pensate for each other.
Attraction effect (Huber et al. 1982; Huber and Puto 1983; Ratneshwar et al. 1987; Pan et al. 1995; Highhouse 1996; Herne 1997; Herne 1999; Amaldoss et al. 2005; Kim and Hasher 2005; Kohler 2007) is in accor-dance with the context. It explains that a product posing asymmetrical or rela-tively dominance gets a greater possi-bility to be chosen when a new alterna-tive, which is asymmetrical or rela-tively dominated, comes nearby. While allowing a better understanding of consumer choice, it actually leads to the development of compromise effect (Simonson 1989). The compromise effect postulates that an alternative would tend to gain market share when it becomes a compromise or middle option in the set.
While the position of middle op-tion requires more exploraop-tions, Pan and Lehmann (1993) observe two models: (1) frequency effect and (2) range effect. Based on the frequency effect, if a new alternative enters to the midst of two existing products, in which it increases the frequency between the two products, the two existing prod-ucts will be perceived as more dissimi-lar. Meanwhile, the range effect sug-gests that if a new alternative comes outside the two existing products, in which it increases the range, the two existing products will be perceived as more similar to each other.
Furthermore, Pan and Lehmann (1993) explore that the frequency and range effects lead to another model known as categorization effect.
Actu-by Lingle, Altom and Medin (1984), and developed by some other research-ers such as Cohen and Basu (1987), and Sujan and Bettman (1989). It theo-rizes that when a new alternative’s specifications are similar to a sub-group of existing products, it is likely that the new alternative would be cat-egorized as the subgroup. In a later study, Lehmann and Pan (1994) make use of the term “assimilation” instead of “categorization.”
In the meantime, the term “con-text” refers to a consideration stage. The fact that the alternatives will likely be considered in the consideration stage fingers out that there is a stage before-hand that impels options to be valu-ably considered. In other words, there is possibly a phase that primarily se-lects particular numbers out of some other numbers. The concept of choice being limited to a small number of brands, which are brands a buyer con-siders when he/she contemplates pur-chasing a unit of the product class, is known as the evoked set (Howard 1989). In accordance with the idea, Howard and Sheth (in Lunn 1974) generate an exclusive model that fo-cuses on memory base. The concept of memory-based decision making itself denotes the decision making deduced from information saved in memory (Lynch and Srull in Kardes 2002).
1987; Hauser and Wernerfelt 1990; Robert and Lattin 1991). However, most do not expound clearly on what criteria used in screening products, particularly from stage 1 to stage 2, except Johnson and Payne (1985) who clarify that available alternatives are first screened on the basis of a simple non-compensatory rule (stage 1) and the remaining alternatives are analyzed more carefully using a compensatory rule (stage 2). In addition, Hauser and Wernerfelt (1990) employ the cost evaluation as a standard whereas Rob-ert and Lattin (1991) operate a trade-off between cost and value consider-ations.
Later on, some research develops more than two stages in choice deci-sion making (Nedungadi 1990; Shocker et al. 1991; Kardes et al. 1993). A choice should be produced from a process of sequence starting from a
universal set to retrieval set and con-sideration set, and ending in choice. The process is renowned as the multi-stage model.
Multi-stage Model
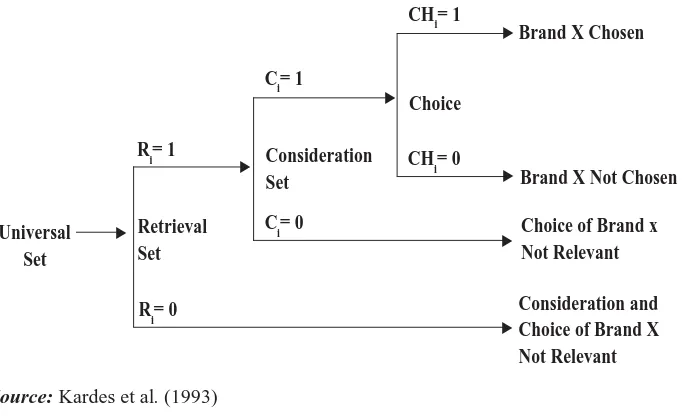
The multi-stage model was initi-ated by Shocker et al. (1991). Encour-aged by the stream of memory-based decision making, it accordingly sists of universal set, retrieval set, con-sideration set, and choice. The univer-sal set refers to all brands available in the market place. The retrieval set com-prises the subset of brands in the uni-versal set that consumers can access from memory. Not all brands exposed to consumers would be encoded and saved into the memory; hence, the retrieval set is much smaller than the universal set (Alba and Chattopadhyay 1985, 1986). The consideration set is composed of the subset of brands in
Source: Kardes et al. (1993)
Figure 1. Multi-stage Model
Universal Set
X Retrieval
Set Ri= 1
X
X
Ci= 1
Consideration Set
Ci= 0
X
CHi= 1
Choice
CHi= 0
Brand X Chosen
Choice of Brand x Not Relevant
XBrand X Not Chosen
X
Ri= 0 Consideration and
Choice of Brand X Not Relevant
the retrieval set scrutinized carefully in a particular choice occurrence. Since consumers may not consider all brands retrieved, the consideration set is often smaller than the retrieval set. Finally, one brand is selected from the consid-eration set (Figure 1).
As shown in Figure 1, not all products available in the market are captured and stored in a consumer’s memory; in fact, only a few are suc-cessfully retrieved. If a particular prod-uct does not appear in the retrieval set, it will not emerge either in the consid-eration set, meaning that it is impos-sible to become a choice. In other words, a particular product not suc-cessfully retrieved is irrelevant to the consideration and choice. On the other hand, a particular product that appears in the retrieval set is not necessarily considered or chosen. Accordingly, a choice is a particular product success-fully retrieved and considered.
Brand Retrieval
Consumers obtain product infor-mation from many sources, such as advertisements, packages, point of purchase displays, word-of-mouth communications, and magazines (Kardes et al. 1993). Basically, infor-mation can be classified into three types: (1) item information, (2) asso-ciative information, and (3) serial or-der information (Li and Lewandowsky 1995). The item information records the occurrences of events; the associa-tive information is required to remem-ber the relationships among separate
events, while the serial order informa-tion records the temporal sequence of a string of events. Such information must be stored and readable whenever needed, or otherwise invaluable. It embraces three stages: (1) encoding, (2) storage, and (3) retrieval (Restle 1975).
While any information stored is likely to be recalled, it suffers from the problem of priority: which one should be prioritized, the first one or the last one? Li and Lewandowsky (1995) sug-gest that retrieval involves two direc-tions: (1) forward and (2) backward recalls. When the process of recall is in the forward direction, it is instructed to recall a list from the beginning to the end. Data indicate extensive primacy (advantages for early list items) and little recency (advantages for late list items). On the contrary, the backward direction means that primacy is mini-mum, and recency tends to be much steeper.
The concept of primacy-recency is still in dispute. Some researchers prefer the concept of primacy (Murdock 1983; Lewandowsky and Murdock 1989; Johnson 1991; Kardes et al. 1993; McElree and Dosher 1993) whereas others prefer the concept of recency (Bjork and Whitten 1974; Collins and Loftus 1975; Glenberg et al. 1983; 1980; Glenberg and Swanson 1986).
The contradiction leads much re-search to provide evidence that the process of recall pursues both forward and backward recalls (Rudel and Denckla 1974; Geiselman and Callot 1990; Lewandowsky and Li 1994; Li and Lewandowsky 1995). While Alba and Chattopadhyay (1985; 1986) and Alba and Hutchinson (1987) focused their studies on factors influencing the retention, Nedungadi (1990) investi-gated factors that ease the recall. Al-though they begin from a different point of view, to some extent they substantiate the findings of Sujan and Bettman (1989) that a distinctive prod-uct gets easier to be recalled. In addi-tion, Nedungadi (1990) clarifies that bearing a particular product in mind will spontaneously remember other products that serve as competitors. The enlightenment is very simple: when an ad gives information, which helps con-sumers recall a particular brand, other brands that are similar spontaneously arise. If a specific competitor turns out to be more favorable, the initial brand that explicitly informs customers through the ad becomes obsolete.
First-mover products, according to Nedungadi (1990), also enjoy ad-vantages of being brought in mind easily. Based on this idea, Kardes et al. (1993) find that pioneer products have a higher probability in the retrieval set. Kahnemann and Miller (1986) intro-duce an idea of flexible process that makes use of internally and externally generated retrieval cues to activate information stored in the long-term memory and incorporate it into a par-ticular concept constructed in the work-ing memory. The idea is in accordance with the findings of Collins and Loftus (1975) that the accessibility of brand depends on three factors. The first fac-tor is the strength of activation of the brand node, i.e., the frequency, recency, and salience of brand instantiation and evaluation. The second factor is the strength of association between the brand node and other active nodes. Meanwhile, the last factor is the avail-ability of retrieval cues, i.e., category, brand, and attribute.
Consideration Set
accordance with the concept of evoked set, i.e., brands that a consumer has in his/her memory, that he/she considers acceptable, and that he/she considers when purchasing the product category (Howard 1989).
While it is a commonly incorrect perception that choice sets are rela-tively static (Hauser and Wernerfelt 1990), Nedungadi (1990) recommends that choice sets are not fixed, but can change across choice occasions. This idea essentially means that the influ-ence of memory will not be confined to the informational inputs used in brand evaluation, but will extend to the re-trieval and consideration of the brands themselves. Consequently, the retrieval and consideration will likely produce different outcomes.
Some other studies follow the stream. Hauser and Wernerfelt (1989 1990), Simonson and Tversky (1992), Assael (1995) scrutinized the consid-eration set, and confirm that choice sets vary depending on choice occa-sions. Roberts and Lattin (1991), Brown and Wildt (1992), Kardes et al. (1993), Lehmann and Pan (1994) ex-plored the consideration sets as a con-struct. The findings show that the prod-uct composition has shrunk. There are some products that are supposedly su-perior because of their specific posi-tions, such as domination, compro-mise, and assimilation. The subsequent section discusses each of them at a glance.
Attraction Effect
Huber et al. (1982) and Huber and Puto (1983) are researchers who ini-tially proclaim the attraction effect. Their findings were subsequently in-vestigated by Ratneshwar, Shocker, and Stewart (1987). Respondents were shown two different brands (A and B) that each had two attributes, and they had to choose one of the two. Two weeks later, they had to choose the same two products but with one new brand (C). The new product was domi-nated by one of the original alterna-tives (B) but not by the other (A). It is found that the respondents tend to alter their choice. The addition of brand C increases the attractiveness and choice probability of the now asymmetrically dominating alternative (brand B). Huber and Puto (1983) extended this finding by adding non-dominating al-ternatives that were relatively inferior to one of the two alternatives in the core set.
Further-more, Huber and Puto (1983) explored more studies on the attraction effect. In their experiment, the new alterna-tive was only relaalterna-tively inferior to one of the two alternatives in the core set. The finding also depicts the alteration of choice.
The terms asymmetrical dominat-ing product, relatively inferior prod-uct, and dominated product are de-fined as follows. An asymmetrical dominating product is a product that in the perceptual space of two given at-tributes has superiority, whether in one particular attribute or both, rela-tive to the other products. A relarela-tively inferior product is a product that in the perceptual space of two given attributes has inferiority in only one attribute compared to another product. Mean-while, a dominated product is a prod-uct that in the perceptual space of two given attributes has inferiority in one attribute or both relative to another product.
Compromise Effect
Simonson (1989) who introduced the compromise effect was inspired by the study of Huber and Puto (1983), in which the attraction effect still works when a relatively inferior alternative comes closer to an existing product. The now-becoming superior product is actually a weak justification since it is not clearly true that one alternative is superior to the other. Interestingly, Huber and Puto (1983) also report that the relatively superior product is la-beled as “safe”, “compromise” alter-native.
When a new alternative C is added to a set containing brands A and B, where C is relatively inferior to B, this will increase the attractiveness of B (attraction effect). The decision mak-ing, which is to choose B, could be justified in two ways. First, the choice is based on the relative superiority relationship. Second, it is predicated upon the fact that following the addi-tion of the relatively inferior alterna-tive (C), the superior brand (B) can be seen as a compromise choice in terms of its attribute values between brand A and the new inferior alternative, brand C. If the decision maker is uncertain as to which of the two attributes is more important, a selection of a compro-mise alternative considered to be com-bining both attributes might be easiest to justify (Stein and Miller in Simonson 1989).
Assimilation Effect
To make a new inferior alterna-tive in some ways similar to existing brands could be accomplished by as-signing the new alternative to be close to the existing brands with which they have similar specifications. Basically, two basic processes that describe how individuals cope with new informa-tion are: (1) assimilainforma-tion and (2) ac-commodation (Rumelhart and Norman 1972). Assimilation occurs when a new concept is integrated into the present mental scheme whereas ac-commodation prevails when a new mental scheme is created or the present scheme undergoes substantial modifi-cations to interpret the new concept.
Schemes are cognitive structures representing one’s expectation about a domain (Bettman 1979). Over time, an individual is likely to develop a scheme or set of expectations about a product category. These expectations might include hypotheses about the usual values on attributes, the important weights of attributes, and the variabil-ity across brands on attributes (Sujan and Bettman 1989). By grouping simi-lar objects, information-processing efficiency as well as cognitive stabil-ity is enhanced (Lingle, Altom and Medin 1984; Cohen and Basu 1987). The process of assimilation may occur when new information is slightly-to-moderately discrepant from the cat-egory scheme, but is not likely when the new information is strongly dis-crepant (Sujan and Bettman 1989).
While a sole alternative is less likely to be chosen (Glazer, Kahn and Moore 1991), a brand positioned to be close to another brand is deemed more similar to each other (Pan and Lehmann 1993), and regarded as an assimilated brand (Lehmann and Pan 1994). In addition, being an assimilated alterna-tive will increase the brand’s choice probability (Lehmann and Pan 1994).
Choice
Choice decision is normally based on particular criteria, such as attitude-based and attribute-attitude-based criteria (Kardes 2002). While an attitude to-ward brand is formed by belief and evaluation, the decision then follows the formula of A0 = Σbiei (Fazio and Roskos-Ewoldsen 1994). Choice based on attributes distinguishes three types of judgment: (1) compensatory, (2) non-compensatory, and (3) combina-tion process (Peter and Olson 2002). The compensatory process combines all the salient beliefs about the conse-quences of the choice alternatives to form an overall evaluation or attitude toward each behavioral alternative. On the other hand, the non-compensatory process refers to the imbalance of posi-tive and negaposi-tive consequences of the choice alternatives. The combination process is a mix of both.
Forming Hypotheses
existing brands accordingly meet the criteria of primacy. Furthermore, those which are salient may be easily memo-rable (Collins and Loftus 1975). The term “salient” refers to brand (Nedungadi 1990) and attribute (Alba and Chattopadhyay 1985 1986; Alba and Hutchinson 1987). Therefore, par-ticular products that hold primacy and saliency are inclined to have a greater probability to be retrieved. Accord-ingly, a hypothesis can be constructed as follows:
H1: The existing brands which are salient have a higher probability to be included in the retrieval set.
On the other hand, new alterna-tives spontaneously meet the criteria of recency. If the new alternatives are close or similar to the existing brands, the probability of being recalled be-comes higher. Therefore, it leads to the following hypothesis:
H2: The new alternatives which are close or seemingly alike to the existing brands have a higher probability to be included in the retrieval set
Huber et al. (1982), and Huber and Puto (1983) show that the choice probability of asymmetrically nating products increases when a domi-nated product is added to the set. Like-wise, Kardes et al. (1993) proclaim that the most salient product gets easier to be considered. Furthermore, Simonson (1989), Simonson and Tversky (1992), Pan and Lehmann (1993), and Lehmann and Pan (1994)
find that the entry of an inferior prod-uct strengthens the probability of the dominant product of being considered. The evidence of the research leads to a presumption that not only does the particular existing product get easier to be considered, but a new entrant will also enjoy the consideration if it is superior to the existing product. Con-sequently, if there are a number of new alternatives entering a set of alterna-tives, they will have an effect that potentially alters the judgment, par-ticularly because of the new entrants. Whether the new entrants are inferior or superior to existing products, along with the existing products, will pro-duce a new subset in which the most dominant product will be easier to be considered. Therefore, a hypothesis can be formulated as follows:
H3: The entry of a number of new alternatives, whether inferior or superior to an existing product, will make the dominant product easier to be considered.
H4: If a number of new alternatives enter into a set, in which both the existing and new alternatives si-multaneously create a compro-mise set, the most comprocompro-mise option accordingly gets a higher choice possibility.
Referring to the findings of Lingle, Altom and Medin (1984), Cohen and Basu (1987), Sujan and Bettman (1989), Glazer, Kahn and Moore (1991), both Pan and Lehmann (1993) and Lehmann and Pan (1994) imply that a new entrant that is slightly-to-moderately different from a particular existing product, which simultaneously create a subtype group and are re-garded as an assimilated brand, enjoys a higher probability of choice.
Likewise, if a number of new al-ternatives enter into the set, those that are slightly-to-moderately different from particular existing products, which simultaneously create a sub-type group, will enjoy an increase in the probability of choice. Therefore:
H5: If a numbers of new alternatives enter into a set, in which some that are similar to particular ex-isting brands create a subtype group with the existing brands, their probability of choice will increase
The last three hypotheses pro-posed lead to other propositions. While a dominating product gets a higher probability to be considered, the most compromise option also acquires a
similated products will be enhanced with respect to their choice probabil-ity. Accordingly, which position will have a higher possibility when new entrants simultaneously develop a dominating position in one side, the most compromise in another side, and assimilated position in the other side? Motivated by the statement of Kardes et al. (1993) that the most sa-lient product is getting easier to be considered, a proposition that the most prominent product has the highest choice possibility can be developed. The dominant position looks more prominent than does the compromise one; therefore, combined with the as-similated position, the most prominent being proposed is simultaneously the dominating position and the assimi-lated position. If in a particular case, the pose denotes the existing brand, then the assimilated position is auto-matically overridden. But this is not the case if the most prominent is a new entrant. So, a new hypothesis can be proposed:
H6: When a number of new alterna-tives’ entry into a set simulta-neously creates dominating, com-promise, and assimilated posi-tions, the products that pose the dominating and assimilated posi-tions have a greater choice prob-ability.
Research Design
choice is harnessed. This study applies a field experiment. Two phases are carried out: (1) preliminary study and (2) experimental study. The first phase consists of three preliminary studies, and each has particular purposes. The objectives of the preliminary study are to: (1) check out the acceptability of two product categories employed, (2) facilitate brands and the types of re-spondents’ knowledge of the two prod-uct categories and attributes used in judgment, and (3) find out a set of brands that dominate the market, a set of brands that are supposed to be new brands, and a set of attributes em-ployed in judgment.
The experimental study is run through a within-subject design. It is defined as a study that only employs one group, and the same group is treated differently in different experimental conditions (Singh 1986).
Methods
Variables affecting the accuracy of data, such as age, sex, location, and life style, should be controlled. While the age variable is controlled by a consistency of mean, the sex variable is controlled by a consistency of sex ratio. In addition, non-bias data of lo-cation is facilitated by a consistency of similar colleges, i.e., size and the num-ber of students. Furthermore, the lifestyle variable is controlled by a consistency of mean; this indicator refers to Wells and Tigert’s formula-tion as quoted by Assael (1995), which
is based on perceived activities, inter-ests, and opinions.
Data are acquired by delivering questionnaires. An arrangement of product sequence in any question is needed, aiming at describing the most relatively dominating, compromise, assimilated, dominating and assimi-lated, and compromise and assimilated positions, as well as neutral on the other side. Answers are available on ten scales, from 0 to 10 (Jaccard et al. 1986).
This study carried out two prod-uct categories, i.e., freezer and TV. 270 participants were used, including 50 participants of each preliminary study. All of them were college stu-dents, including those whose status were employees. Data are analyzed using three approaches. Firstly, prob-ability is analyzed by employing a logit model estimated by the maxi-mum-likelihood method (Greene 2000; Gujarati 1995 1999; Pindyck and Rubinfeld 1998). The dependent vari-able is the retrieval probability; p = 1 if retrieved, and 0 otherwise. The inde-pendent variables are brand attributes. The model itself is as follows:
P : Probability
X1 ….Xn: Dependent variables
Secondly,
the statistical signifi-cance of consumer preference score inLn [P1]
the form of respondent’s percentage is analyzed to find evidence that sup-ports a particular position as hypoth-esized in the consideration set. Thirdly, regression analysis with dummy vari-ables is employed to observe statisti-cal significant coefficients on prod-ucts that pose particular hypothesized positions (Gujarati 1995; 1999). The dependent variable is all products con-sidered by respondents. The indepen-dent variables are dummy variables assigned as follows: (1) all brands or types before entry are encoded 0, (2) a product, whether the existing product or the new entrant that poses a domi-nating, compromise, assimilated or dominating, and assimilated position is encoded 1, and 0 otherwise. The equation is:
Yi= α1 +α2Di +β1X1 +β2X2+....βnXn
Yi : Products considered by respondents
X1 ….Xn : Existing products and new entrants
D = 1 : If a product has a dominat-ing, compromise,
assimi-lated, dominating and as-similated position
D = 0 : Otherwise
Results and Analysis
a. Preliminary Study
While the main objective of the first preliminary study is to check out respondents’ knowledge of the two categories employed in this study, the second preliminary study investigates further, i.e., to obtain brands that re-cently exist in the market. It also pur-ports to know brands dominating the market and new entrants according to respondents. In addition, it should pro-duce attributes used in assessing choice.
The number of brands that re-cently exist in the market is 21 for freezer and 29 for TV. Meanwhile, the brands dominating the market are five for freezer and nine for TV. Brands deemed to be new entrants are three for freezer and eight for TV. Attributes used in assessing choice for any cat-egory vary. It is understandable as to some extent respondents refer to their
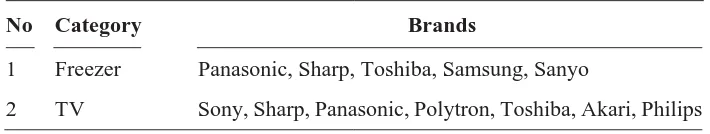
Table 1. The Dominating Brands Nominated in Experimental Study
No Category Brands
1 Freezer Panasonic, Sharp, Toshiba, Samsung, Sanyo
2 TV Sony, Sharp, Panasonic, Polytron, Toshiba, Akari, Philips
subjective judgments. However, at-tributes used are basically not far from four main points, i.e., quality, price, technology, and design.
Since the third preliminary study should be consistent with the previous preliminary studies, the final results obviously appear to be a combination of the three. The objective is then highlighted to generate a set of exist-ing brands, a set of dominatexist-ing brands (Table 1), a set of new entrants (Table 2), and scores of brands based on par-ticular attributes that would be em-ployed in the experimental study. The set of existing brands itself is com-posed of brands that dominate the market and brands of new entrants.
Parallel with scores as one of the objectives defined in the third prelimi-nary study, the scores are desirably settled in the experimental study’s questionnaires. The scores are obtained by dividing total score, which is a sum of numbers between 0-10 favored by the respondents to meet their percep-tions about a brand based on particular attributes, by the number of respon-dents (Appendix 1).
b. Experimental Study
1) Testing Hypothesis 1
Two methods are employed: (1) showing the percentage of respondents who successfully recall particular brands and (2) running the logit model. On the freezer category, the dominat-ing brands included in the retrieval set are several. For the sake of efficiency, not all were brought up; rather, only two were tested, i.e., Panasonic (85,42%) and Sharp (82%) (Table 3). Defining p = 1 if recalled and p = 0 if not recalled, the equation of the logit model for Panasonic is:
Based on the respondents’ scores, which indicate that more than 81 per-cent fall on 7, 8, 9, and 10, the calcu-lated probability is found to be 0.955 by averaging.
Likewise, denoting p = 1 if re-called and p = 0 if not rere-called, the equation of the logit model for Sharp is:
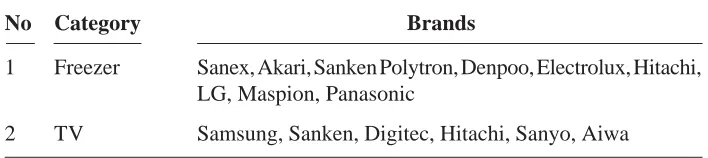
Table 2. The New Entrants Nominated on Experimental Study
No Category Brands
1 Freezer Sanex, Akari, Sanken Polytron, Denpoo, Electrolux, Hitachi, LG, Maspion, Panasonic
2 TV Samsung, Sanken, Digitec, Hitachi, Sanyo, Aiwa
Source: Primary data
Ln [P1]
The results show that 82 percent scores fall on 8, 9, and 10, and the probability of Sharp is equal to 0.962. This means that both brands (Panasonic and Sharp) are successfully retrieved. While Panasonic gets 96 percent of the probability to be retrieved by most respondents (81%), Sharp has 96 per-cent of the probability to be retrieved by 82 percent respondents.
For the TV category, the dominat-ing brands easily recalled are Sony (91.42%), Panasonic (88.25%), Sharp (86.17%), and Polytron (81.92%) (Table 4). The equation of the logit
Based on the respondents’ scores, which depict that more than 86 percent fall on 8, 9, and 10, the probability is 0.857 by averaging calculation.
Analogous to the freezer category, brands taken up into the model are just two, i.e., Sony and Panasonic. The equation of Panasonic itself is:
Subsequently, the score distribu-tion indicates that 82 percent fall on 8, 9, and 10. Accordingly, by averaging, Table 3. Freezer Category: Particular Brands Included in the Retrieval Set
No Brand Number of Respondents %
1 Panasonic 1025 85.42
2 Sharp 984 82
3 Polytron 804 67
4 LG 790 65.83
Source: Data Analysis
Ln [P1]
1 - P1 = -13.308+1.837Sharp
Ln [P1]
1 - P1 = -18.775 + 2.285 Son
Ln [P1]
1 - P1 = -21.562 + 2.612 Pan Table 4. TV Category: Particular Brands Included in the Retrieval Set
No Brand Score %
1 Sony 1097 91.42
2 Panasonic 1059 88.25
3 Samsung 938 78.17
4 Digitec 812 67.67
Both results for the freezer category and for TV category provide evidence that substantiates Hypothesis 1. In ad-dition, it is in accordance with Kardes et al.’s findings (1993) that the domi-nant brands would be easily retrieved.
2) Testing Hypothesis 2
Utilizing criteria such as shape, feature, quality, and color, particular brands are similar to the dominant brands. For the freezer category, the close products are likely to get signifi-cant scores, such as Polytron (67%) and LG (65.83%) (Table 3). Findings for the TV category are in line with those for the freezer category, i.e., Samsung (78.17%) and Digitec (67.67%) (Table 4). By operating the logit model, and in a similar fashion to the testing of Hypothesis 1, this study finds that the probabilities of Polytron, LG, Samsung, and Digitec, are 0.843, 0.804, 0.809, and 0.634, respec. The results point out evidence supporting Hypothesis 2.
3) Testing Hypotheses 3, 4, and 5 Method used in these examina-tions is the percentage analysis through comparison between an assumingly dominating product and dominated products, between compromise prod-ucts or non-compromise prodprod-ucts and base products, and between an assimi-lating product and assimilated prod-ucts. In addition, regression analysis with dummy variables is employed to find out statistically significant coeffi-cients on products that pose dominat-ing, compromise, and assimilated
prod-ucts. The dependent variable is all products considered by respondents. The independent variables are dummy variables assigned as follows: (1) all brands or types before entry are en-coded 0, (2) a product, whether the existing product or the new entrant that poses a dominating, compromise, and assimilated position is encoded 1, and 0 otherwise.
The consideration set consists of a set of alternatives where some be-long to existing brands and the rest belong to new entrants. For the freezer category, the brands included in the set are Panasonic NRA15KD, Samsung Cooltech Bio, Toshiba GRC/D169, and Sharp Nice Crystal VR161N, which are utilized as existing alternatives in the set. The new entrants are Polytron PR158, Samsung Bio SR/AGA17, and Denpoo DL198 (see Appendix 2).
the variance uniquely serves as a treat-ment to attain the effects of attraction, compromise, and assimilation.
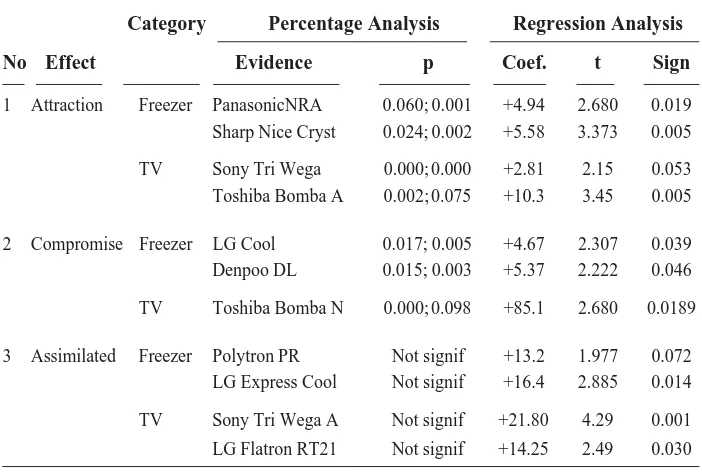
Evidence seems to support the attraction effect, both for freezer and TV categories. Brands tested are Panasonic NRA15KD, Sharp Nice Crystal VR161N, Sony Trinitron Wega HA21P50, and Toshiba Bomba 21A3E (Appendix 4). In comparison with the dominated brands, the results for the dominating brands are statistically sig-nificant. Likewise, the four brands have a positive direction, meaning that it has the same direction as the Consider-ation variable (Table 5). Accordingly, it confirms Hypothesis 3.
The effect of compromise is dem-onstrated by LG Express Cool and Denpoo DL198 in the freezer category and by Toshiba Bomba 21N3XE in the TV category. In comparison with the bases, the results show significant dif-ferences. The three brands also have the same direction as the Consider-ation variable (Table 5). Actually, the percentage analysis on the TV cat-egory yields two brands having sig-nificantly differences from the bases, i.e., Toshiba Bomba 21A3E and Toshiba Bomba 21N3XE. Unfortu-nately, Toshiba Bomba 21A3E is not successful in the regression analysis. Nevertheless, both analyses, i.e.,
per-Table 5. Results of Percentage Analysis and Regression Analysis for
Hypoth-esis 3, 4, 5
Category Percentage Analysis Regression Analysis
No Effect Evidence p Coef. t Sign
1 Attraction Freezer PanasonicNRA 0.060;0.001 +4.94 2.680 0.019 Sharp Nice Cryst 0.024;0.002 +5.58 3.373 0.005
TV Sony Tri Wega 0.000;0.000 +2.81 2.15 0.053 Toshiba Bomba A 0.002;0.075 +10.3 3.45 0.005
2 Compromise Freezer LG Cool 0.017; 0.005 +4.67 2.307 0.039 Denpoo DL 0.015; 0.003 +5.37 2.222 0.046
TV Toshiba Bomba N 0.000;0.098 +85.1 2.680 0.0189
3 Assimilated Freezer Polytron PR Not signif +13.2 1.977 0.072 LG Express Cool Not signif +16.4 2.885 0.014
TV Sony Tri Wega A Not signif +21.80 4.29 0.001 LG Flatron RT21 Not signif +14.25 2.49 0.030
centage analysis and regression analy-sis, provide evidence that supports Hypothesis 4.
While the attraction and the com-promise effects necessitate significant differences, the assimilated effect does not require a significant difference, particularly between assimilated and assimilating brands. The effect is dem-onstrated by Polytron PR158, LG Ex-press Cool, Sony Trinitron Wega TG 21, and LG Flatron RT21FA31. More-over, the four brands get the same effect or direction as the Consider-ation variable, (Table 5). Conse-quently, there is evidence supporting Hypothesis 5.
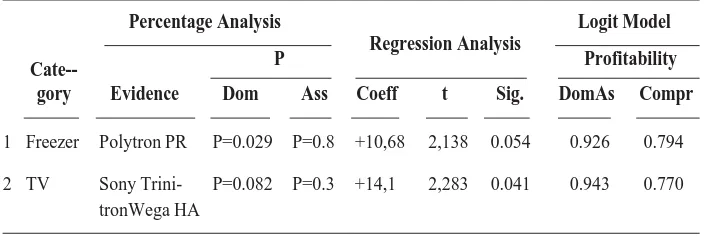
4) Testing hypothesis 6
Employing the same set as that used in examining Hypothesis 5, it is found that Polytron PR158 (freezer category) poses either a dominating or an assimilated position (Table 6). Like-wise, Sony Trinitron Wega HA21P50 (TV category) has a similar position. Regression results indicate that both
products demonstrate the same direc-tion as the Consideradirec-tion variable. Furthermore, the probabilities of the two products are the most preferable vis-à-vis the probability of the com-promise brands (Table 6). Hence, there is evidence that supports hypothesis 6.
Implications and Discussion
The findings demonstrate how a brand should initially undergo recla-mation before being considered a nomi-nee for a choice. Decision to purchase obviously begins with the process of sorting to retrieve. Those that succeed in the retrieval process then should undergo a similar process in the con-sideration stage. While all brands are likely to be chosen, the winner should be specific, which is to possess a domi-nating assimilated position.
This study apparently supports the findings of Nedungadi (1990), Shocker et al. (1991), and Kardes et al. (1993). However, it develops a more compli-cated design in at least three aspects.
Cate--gory Evidence Dom Ass Coeff t Sig. DomAs Compr
1 Freezer Polytron PR P=0.029 P=0.8 +10,68 2,138 0.054 0.926 0.794
2 TV Sony Trini- P=0.082 P=0.3 +14,1 2,283 0.041 0.943 0.770 tronWega HA
Source: Data Analysis
Percentage Analysis
P Regression Analysis Profitability Table 6. Results of Percentage Analysis, Regression Analysis, and Logit
Model for Hypothesis 6
Firstly, it employs more product cat-egories and brands. Secondly, it in-volves a complicated selection pro-cess in the retrieval phase and the consideration stage. The findings ab-solutely provoke a relevant marketing strategy. When introducing a new brand into the market, marketers should consider which brands dominating the market and what characteristics the new brand has. The strategy might be generated as follows. If the new brand is supposedly more superior to the existing brands, it could be posed in two ways. The new brand developed by the same firm as the dominating and existing brand instantly possesses
ad-vantages of assimilation and recency whereas the one that comes from a new player should adapt its attributes, which are new modifications to the old brand, to get an assimilation advantage.
This study has a limitation of employing just two attributes in mak-ing a choice. Hence, it is suggested that future research involves more than two attributes. While some attributes may be compensated or non-compensated to some extent, this improvement may also facilitate respondents to be more rational and liberated. It is expected that the way a consumer makes a choice of a particular brand after making an evaluation becomes clearer.
Reference
Alba, J. W. and A. Chattopadhyay 1985. Effects on context and postcategory cues on recall of competing brands. Journal of Marketing Research 22 (August): 340-349. Alba, J. W. and A. Chattopadhyay. 1986. Salience effect in brand recall. Journal of
Marketing Research 23 (November): 363-369.
Alba, J. W. and J. W. Hutchinson. 1987. Dimension of consumer expertise. Journal of Consumer Research 13 (March): 411-454.
Amaldoss, W. J. Bettman, and J. W. Payne. 2005. Biased but efficient: An investigation of coordination facilitated by asymmetric dominance. Mimeo. Duke University Bettman, J. R. 1979. An Information Processing Theory of Consumer Choice.
Massachu-setts: Addison-Wesley Publishing Co.
Bjork, R. A. and W. B. Whitten. 1974. Recency sensitive retrieval processes in long term free recall. Cognitive Psychology 6: 173-189.
Brown, J. J. and A. R. Wildt. 1992. Consideration set measurement. Journal of the Academy of Marketing Science 3 (20) (Summer): 235-243.
Fazio, R. H., and D. R. Roskos-Ewoldsen. 1994. Acting as we feel, when and how attitudes guide behavior. In Sharon Shavitt and Timothy C. Brook (editor), Persuasion, Psychological Insights and Perspective. Boston: Allyn and Bacon
Geiselman, R. E and R. Callot. 1990. Reverse versus forward recall on script-based texts. Applied Cognitive Psychology 4: 141-144.
Glazer, R., Barbara E. Kahn, and W. L. Moore. 1991. The Influence of external constraints on brand choice: The lone alternative effect. Journal of Consumer Research 18 (June): 119-125.
Glenberg, A. M., M. M. Bradley, T. Kraus, and G. J. Renzaglia. 1983. Study of the long-term recency effect: Support for a contextually guided retrieval hypothesis. Journal of Experimental Psychology: Learning, Memory, and Cognition 10: 16-31. Glenberg, A. M., M. M. Bradley, J. A. Stevenson, T. A. Kraus, M. J. Tkachuk, A. L. Gretz. Fish, J. H. and B. M. Turpin. 1980. A two-process account of long-term serial position effects. Journal of Experimental Psychology: Human Learning and Memory 6: 355-369.
Glenberg, A. M., and N. G Swanson. 1986. A temporal distinctiveness theory of recency and modality effects. Journal of Experimental Psychology: Learning, Memory, and Cognition 12: 3-15.
Greene, W. H. 2000. Econometric Analysis. New Jersey: Prentice-Hall
Gujarati, D. N. 1995. Basic Econometrics (3rd ed.). Singapore: Mc-Graw Hill Book Co. Gujarati, D. N. 1999. Essentials of Econometrics (2nd ed.). Singapore: Mc-Graw Hill Book
Co.
Hauser, J. R., and B. Wernerfelt. 1989. The competitive implications of relevant-set/ response analysis. Journal of Marketing Research 26 (November): 391-405. Hauser, J. R., and B. Wernerfelt. 1990. An evaluation cost model of consideration sets.
Journal of Consumer Research 16 (March): 393-408.
Herne, K. 1997. Decoy alternatives in policy choices: Asymmetric domination and compromise effects. European Journal of Political Economy 13: 575-589. Herne, K. 1999. The effects of decoy gambles on individual choice, experimental.
Eco-nomics 2: 31-40.
Highhouse, S. 1996. Context-dependent selection: The effects of decoy and phantom job candidates. Organizational Behavior and Human Decision Processes 65: 68-76. Howard, J. A. 1989. Consumer in Marketing Strategy. Englewood Cliffs, NJ:
Prentice-Hall, Inc.
Huber, J., and C. Puto. 1983. Market boundaries and product choice: Illustrating attraction and substitution effects. Journal of Consumer Research 10 (June): 31-44.
Huber, J., J. W. Payne and C. Puto. 1982. Adding asymmetrically dominated alternatives: Violations of regularity and similarity hypothesis. Journal of Consumer Research 9 (June): 90-98.
Johnson, G. J. 1991. A distinctive model of serial learning. Psychological Review 98 (2): 204-217
Johnson, E. J. and J. W. Payne. 1985. Effort and accuracy in choice. Management Science 31 (April): 395-414.
Kahneman, D., and D. T. Miller. 1986. Norm theory: Comparing reality to its alternatives. Psychological Review 93 (April): 136-153.
Kardes, F. R. 2002. Consumer Behavior and Managerial Decision Making (2nd ed.). New Jersey: Prentice Hall
Kardes, F. R., G. Kalyanaram, M. Chandrashekaran, R. J. Dornoff. 1993. Brand retrieval, consideration set composition, consumer choice, and the pioneering advantage. Journal of Consumer Research 20 (June): 62-74.
Kim, S., and L. Hasher. 2005. The attraction effect in decision making: Superior performance by older adults. Q J Exp Psychol A 58 (1) (January): 120–133. Kohler, W. R. 2007. Why does context matter? Attraction effects and binary comparisons.
Working Paper Series. Institute for Empirical Research in Economics, University of Zurich. July
Lehmann, D. R., and Y. Pan. 1994. Context effects, new brand entry, and consideration sets. Journal of Marketing Research XXXI (August): 364-374.
Lewandowsky, S., and B. B. Murdock Jr. 1989. Memory for serial order. Psychological Review 96 (1): 25-57.
Lewandowsky, S., and L. Shu-Chen. 1994. Memory for serial order revisited. Psychologi-cal Review 96: 25-57.
Lingle, J. M., M. W. Altom, and D. L Medin. 1984. Of cabbages and kings: Assessing the extendibility of natural object concept models to social things. In Robert S Wyer and Thoms K. Scull Hillsdale (Ed.), Handbook of Social Cognition 1. NJ: Erlbaum: 71-118.
Li, S-C., and S. Lewandowsky. 1995. Forward and backward recall: Different retrieval processes. Journal of Experimental Psychology: Learning, Memory, and Cognition 21. (4): 837-847.
Lunn, J. A. 1974. Consumer decision-process models. In Jagdish N. Sheth (Ed.), Models of Buyer Behavior, Conceptual, Quantitative, and Empirical. New York: Harper and Row Publishers: 34-69.
March, J. G. 1978. Bounded rationality, ambiguity, and the engineering of Choice. Bell Journal of Economics 9 (2): 587-608.
McElree, B., and B. A. Dosher. 1993. Serial retrieval process in the recovery of order information. Journal of Experimental Psychology: General 122 (3): 291-315. Montgomery, H. 1983. Decision rules and the search for a dominance structure: Towards
Nedungadi, P. 1990. Recall and consumer consideration sets: Influencing choice without altering brand evaluations. Journal of Consumer Research 17 (December): 263-276. Pan, Y., and D. R. Lehmann. 1993. The influence of new brand entry on subjective brand
judgments. Journal of Consumer Research 20 (June): 76-86
Pan, Y., S. O’Curry, and R. Pitts. 1995. The attraction effect and political choice in two elections. Journal of Consumer Psychology: 85-101.
Peter, J. P., and J. C. Olson. 2002. Consumer Behavior and Marketing Strategy (6th ed.). New York: McGraw-Hill Book Company.
Pindyck, R. S., and D. L. Rubinfeld. 1998. Econometric Models and Economic Forecasts. Boston: Irwin McGraw-Hill
Ratneshwar, S., A. D. Shocker, and D. W. Stewart. 1987. Toward understanding the attraction effect: The implication of product stimulus meaningfulness and familiarity. Journal of Consumer Research 13 (March): 520-533.
Restle, F. 1975. Learning: Animal Behavior and Human Cognition. New York: Mc Graw-Hill
Roberts, J. H., and J. M. Lattin. 1991. Development and testing of a model of consideration set composition. Journal of Marketing Research 28 (November): 429-440. Rudel, R. G., and M. B. Denckla. 1974. Relation on forward and backward digit repetition
to neurological impairment in children with learning disability. Neuropsychologia 12: 109-118.
Rumelhart, D. E., and D. A Norman. 1972. Accretion, tuning and restructuring: Three models of learning. In E Tulving and W. Donaldson (Ed.), Organization of Memory. New York: Academic Press: 197-246
Savage, L. J. 1954. Foundations of Statistics. New York: John Wiley
Shocker, A., M. Ben-Akiva, B. Buccaro, and P. Nedungadi. 1991. Consideration sets influences on consumer decision-making and choice: Issues, models, and sugges-tions. Marketing Letters 2 (3): 181-197.
Simonson, I. 1989. Choice based on reasons: The case of attraction and compromise effects. Journal of Consumer Research 7 (September): 158-174.
Simonson, I., and A. Tversky. 1992. Choice in context: Tradeoff contrast and extremeness aversion. Journal of Marketing Research 29 (August): 281-295.
Singh, A. K. 1986. Test Measurements and Research Methods in Behavioral Sciences. New Delhi: Tata McGraw-Hill Publishing Company Limited
Slovic, P. 1975. Choice between equally-Valued alternatives. Journal of Experimental Psychology: Human Perception and Performance 1 (3): 280-287.
Slovic, P., B. Fischhoff, and S. Lichtenstein. 1982. Response mode, framing, and information processing effects in risk assessment. In Robin M. Hogarth New Directions in Methodology of social and Behavioral Science: The Framing of Questions and the Consistency of Response. San Francisco: Jossey-Bass
APPENDIX 1. Brands Scores of TV Category Based on Quality
No Brands Score Aver
1 Akari 256 7.11
2 Aiwa 350 8.33
3 Digitec 271 7.74
4 Fujitec 201 6.09
5 Hitachi 262 6.89
6 Intel 186 5.64
7 JVC 305 8.24
8 LG 299 7.29
9 Mitsubishi 186 6.89
10 Panasonic 378 8.79
11 Philips 326 8.81
12 Polytron 343 7.79
13 Panda 94 4.7
14 Sony 482 9.84
15 Sharp 343 7.79
16 Samsung 322 7.85
17 Sanyo 224 7.0
18 Sanken 184 6.81
19 Sanex 106 5.05
20 Sunkyu 79 4.16
21 Toshiba 376 9.16
APPENDIX 2. The Profile of Freezers Based on Price and Quality for H3
Brand/Type Description Price Quality
(Rp) Scaled from 0 (the lowest) to 10
(the highest)
Panasonic NRA15KD 1 door 1.600.000 9
Sharp Nice Crystal VR161N 1 door 1.728.000 9
Samsung Bio SR/AGA17 1 door 1.481.000 8
Denpoo DL 198 1 door 1.644.000 8
Polytron PR 158 1 door 1.456.000 8
Toshiba GRC/D169 1 door 1.612.000 9
Source: Preliminary Study processed
APPENDIX 3. The Profile of TV Based on Price and Quality for H3
Brand/Type Description Price Quality
(Rp) Scaled from 0 (the lowest) to 10
(the highest)
Sony Trinitron Wega TG 21 21"/Stereo/ 3.800.000 10 Flat
Toshiba Bomba 21A3E 21"/Stereo/ 2.274.000 9
Concave
Sharp Universe 20H200 20"/Mono/ 1.883.000 8
Concave
Samsung CS 20F2 BB 20"/mono/ 1.756.000 8
Concave
Polytron Minimax MX 5152 21"/mono/
Semiconcave 2.097.000 8
Sanken ST 2029/39SR 20"/Stereo/ 1.900.000 7
Concave
Digitex DN 2012 20"/mono/ 1.650.000 8
Concave
APPENDIX 4. Dominating vs Dominated
TV Category
(a) Sony vs Samsung (SONSAM)
Number
Variable of Cases Mean SD SE of Mean
Group 1 20 9.325 0.922 0.206
Group 2 20 7.000 1.170 0.262
Mean Difference = 2.3250
Levene’s Test for Equality of Variances: F= 0.333 P= 0.567
t-test for Equality of Means 95%
Variances t-value df 2-Tail Sig SE of Diff CI for Diff
Equal 6.98 38.00 0.000 0.333 (1.651, 2.999)
Unequal 6.98 36.03 0.000 0.333 (1.649, 3.001)
Indication: the difference of two means is very significant a Ho rejected
(b) Sony vs Polytron (SONPOLY)
Number
Variable of Cases Mean SD SE of Mean
Group 1 20 9.325 0.922 0.206
Group 2 20 7.300 1.838 0.411
Mean Difference = 2.0250
Levene’s Test for Equality of Variances: F= 11.845 P= .001
t-test for Equality of Means 95%
Variances t-value df 2-Tail Sig SE of Diff CI for Diff
Equal 4.40 38.00 0.000 0.460 (1.094, 2.956)
Unequal 4.40 27.98 0.000 0.460 (1.083, 2.967)
Continued from APPENDIX 4
(c) Sony vs Polytron (SONSANK)
Number
Variable of Cases Mean SD SE of Mean
Group 1 20 9.325 0.922 0.206
Group 2 20 5.700 2.185 0.489
Mean Difference = 3.6250
Levene’s Test for Equality of Variances: F= 5.138 P= .029
t-test for Equality of Means 95%
Variances t-value df 2-Tail Sig SE of Diff CI for Diff
Equal 6.84 38.00 0.000 0.530 (2.551, 4.699)
Unequal 6.84 25.55 0.000 0.530 (2.535, 4.715)
Indication: the difference of two means is very significant a Ho rejected
(d) Sony vs Digitec (SONDIGIT)
Number
Variable of Cases Mean SD SE of Mean
Group 1 20 9.325 0.922 0.206
Group 2 20 6.375 1.806 0.404
Mean Difference = 2.9500
Levene’s Test for Equality of Variances: F= 4.459 P= .041
t-test for Equality of Means 95%
Variances t-value df 2-Tail Sig SE of Diff CI for Diff
Equal 6.51 38 0.000 0.453 (2.032, 3.868)
Unequal 6.51 28.27 0.000 0.453 (2.021, 3.879)
Continued from APPENDIX 4
(2) t-test Toshiba with Samsung, Polytron, Sanken, Digitec
Group A: Dom
(a) Toshiba vs Samsung (TOSISAM)
Number
Variable of Cases Mean SD SE of Mean
Group 1 20 8.175 1.067 0.239
Group 2 20 7.000 1.170 0.262
Mean Difference = 1.1750
Levene’s Test for Equality of Variances: F= .061 P= .806
t-test for Equality of Means 95%
Variances t-value df 2-Tail Sig SE of Diff CI for Diff
Equal 3.32 38 0.002 0.354 (0.458, 1.892)
Unequal 3.32 37.68 0.002 0.354 (0.458, 1.892)
Indication: the difference of two means is very significant a Ho rejected
(b) Toshiba vs Polytron (TOSPOLY)
Number
Variable of Cases Mean SD SE of Mean
Group 1 20 8.175 1.067 0.239
Group 2 20 7.300 1.838 0.411
Mean Difference = .8750
Levene’s Test for Equality of Variances: F= 8.644 P= .006
t-test for Equality of Means 95%
Variances t-value df 2-Tail Sig SE of Diff CI for Diff
Equal 1.84 38 0.073 0.475 (-0.087, 1.837)
Unequal 1.84 30.50 0.075 0.475 (-0.095, 1.845)
Continued from APPENDIX 4
(c) Toshiba vs Sanken (TOSSANKE)
Number
Variable of Cases Mean SD SE of Mean
Group 1 20 8.175 1.067 0.239
Group 2 20 5.700 2.185 0.489
Mean Difference = 2.4750
Levene’s Test for Equality of Variances: F= 4.056 P= .051
t-test for Equality of Means 95%
Variances t-value df 2-Tail Sig SE of Diff CI for Diff
Equal 4.55 38 0.000 0.544 (1.374, 3.576)
Unequal 4.55 27.58 0.000 0.544 (1.361, 3.589)
Indication: the difference of two means is very significant a Ho rejected
(d) Toshiba vs Digitec (TOSDIGIT)
Number
Variable of Cases Mean SD SE of Mean
Group 1 20 8.175 1.067 0.239
Group 2 20 6.375 1.806 0.404
Mean Difference = 1.8000
Levene’s Test for Equality of Variances: F= 3.203 P= .081
t-test for Equality of Means 95%
Variances t-value df 2-Tail Sig SE of Diff CI for Diff
Equal 3.84 38 0.000 0.469 (.850, 2.750)
Unequal 3.84 30.83 0.001 0.469 (.843, 2.757)
Continued from APPENDIX 4
Freezer Category
PANSAMSUNGBIODOM
Number
Variable of Cases Mean SD SE of Mean
Group 1 20 8.200 2.285 0.511
Group 2 20 6.650 2.739 0.612
Mean Difference = 1.5500
Levene’s Test for Equality of Variances: F= 1.010 P= .321
t-test for Equality of Means 95%
Variances t-value df 2-Tail Sig SE of Diff CI for Diff
Equal 1.94 38 0.059 0.798 (-.065, 3.165)
Unequal 1.94 36.82 0.060 0.798 (-.066, 3.166)
PANDEMPODOM
Number
Variable of Cases Mean SD SE of Mean
Group 1 20 8.200 2.285 0.511
Group 2 20 5.200 2.764 0.618
Mean Difference = 3.0000
Levene’s Test for Equality of Variances: F= 1.408 P= .243
t-test for Equality of Means 95%
Variances t-value df 2-Tail Sig SE of Diff CI for Diff
Equal 3.74 38 0.001 0.802 (1.376, 4.624)
Continued from APPENDIX 4
SHARPCRYSTAL SAMSUNG BIODOM
Number
Variable of Cases Mean SD SE of Mean
Group 1 20 8.050 2.564 0.573
Group 2 20 6.650 2.739 0.612
Mean Difference = 1.4000
Levene’s Test for Equality of Variances: F= .179 P= .675
t-test for Equality of Means 95%
Variances t-value df 2-Tail Sig SE of Diff CI for Diff
Equal 2.36 38 0.023 0.604 (.203, 2.647)