1 INTRODUCTION
The travel industry is currently growing. Many com-panies have tried to promote and sell travel services. In 2015, the online global tourism sales had reached USD 496.210.000.000. This number is predicted to grow into USD 755.940.000.000 by 2019 (https://www.statista.com, downloaded on March 17th, 2017). A similar situation has taken place in Indonesia, where the tourism sector may have the chance to be the source of foreign exchange for In-donesia. Therefore, the government's policy to de-velop tourism industry can be considered as a good strategy. "If the tourism sector grows, transportation, handicraft, and creative industries will also grow. Tourism is a sector that can be the source of foreign exchange, and eventually be the biggest in our coun-try," said Rizal after the meeting with Minister of Tourism Arief Yahya and DKI Jakarta Governor Basuki Tjahaja Purnama.
Along with the development of the tourism sector in Indonesia, the numbers of websites offering travel services are also growing. In fact, consumers can compare information from one website to another and order from the website that meets their expecta-tions (Rowley et al. 2001).
The result of a polling found that email adver-tisements sent by online tour and travel agencies in Indonesia are usually allowed by the consumers, while email spamming is rarely found. The result showed that many respondents registered their email
address to the online tour and travel when they used their services, while the respondents who experi-enced email spamming from the online tour and travel were very few (Septianita et al. 2014).
As for the research gap that happened based on the conceptual framework of the research conducted by Schlosser et al. (1999), perceived intrusiveness mediated the entertainment variable on advertising and attitude toward email advertising (Tezinde et al. 2002). While the research of Zia ul Haq (2009) showed that the entertainment variable on adver-tisement had a direct effect on the attitude toward email advertising.
2 RESEARCH METHOD
This research was included in the basic research in the form of causal research. The type of data used was primary data by distributing online question-naire. The measurement scale used was a numerical scale from 1 (highly disagree) to 7 (highly agree).
The population target of the research was the consumers who have experienced online tour and travel agency service twice within the past one year. As for the characteristics of the population were liv-ing in Indonesia, havliv-ing a minimum of a bachelor degree, and having registered an email address to an online tour and travel agency (Morimoto et al. (2006).
ABSTRACT: This study aims to determine and analyze consumer response to email advertising from online tour and travel agency in Indonesia. This study used purposive sampling approach with an assessment of the researchers who can be made respondents in accordance with the characteristics of the population. The char-acteristics of the population were consumers who bought and used online tour and travel agency twice in the past year, lived in Indonesia, and the minimum of level education was a bachelor. The number of respondents in this study was up to 125 people. The analysis in this study used a model of SEM (Structural Equation Modeling). The result of this study indicated that with the intention of consumers to buy, build a relationship, and trust with good service then consumers will read, open, take advantage of email advertising from tour and travel agencies in Indonesia and even be willing to receive email ads in the future.
Keywords: entertainment, financial rewards, consumer’s response, perceived intrusiveness
Jonathan Kurniawan Halim, Silvia Margaretha & Christina Rahardja Honantha
University of Surabaya, Surabaya, IndonesiaConsumer’s response to e-mail advertisement from tour and travel
agency in Indonesia
162 Copyright © 2018, the Authors. Published by Atlantis Press.
This is an open access article under the CC BY-NC license (http://creativecommons.org/licenses/by-nc/4.0/).
Advances in Social Science, Education and Humanities Research (ASSEHR), volume 186
The sampling method in this research was a non-probability sampling method. The data processing method was using SPSS 22.0 software to test the va-lidity and the reliability. Then, SEM method was ap-plied using Amos 21.0 software for the measurement and structural model.
According to Hair et al. 2003, Goodness of Fit was the correspondence measurement of the real co-variance matrix with the expected model. On the other hand, according to Hair et al. (2010) Goodness of Fit was used to measure a model that indicated how good the model in reproducing the observed covariance matrix among the indicators. Hair et al.
(2010) stated that researchers did not have to report all the model conformity index to show that a model could be considered fit. Therefore, several conformi-ty indexes were used in the model conformiconformi-ty test-ing, such as CMIN/DF (Relative Chi-Square), CFI (Comparative Fit index), TLI (Tucker-Lewis Index), GFI (Goodness of Fit Index), and RMSEA (The Root Mean Square Error Approximation).
The next validity test was by performing the AVE (Average Variance Extracted) calculation for each variable and performing standardized loading (λ) calculation for each indicator. The acceptable AVE score was ≥ 0.50, and the acceptable standardized loading (λ) score was > 0.5 (Hair et al. (2010).
The reliability testing was performed using the Construct Reliability (CR) method for every varia-ble. The value of the Construct Reliability (CR) which was acceptable was ≥ 0.7 (Hair et al. 2010).
The hypothesis testing in Structural Equation Modeling (SEM) used α = 5% (p). The hypothesis was accepted if the value of the Critical Ration (CR) ≥ 1.96, otherwise, the hypothesis was not accepted or unsupported.
3 RESULTS AND DISCUSSIONS
The researcher conducted validity testing on the ear-ly stage using 30 questionnaires resulting in Pearson correlation in each statement scoring a total of a lower significance score of 0.05 (α = 5%), which meant that all items in the statements were valid.
The reliability testing was used to find out the consistency of the measuring instrument. If the Cronbach Alpha score was bigger than 0.6, the statement items could be considered reliable. The re-liability testing was performed on 30 respondents. The data analysis showed that the Cronbach Alpha value of the quality of information, entertainment, financial rewards, perceived intrusiveness, attitudes toward e-mail advertising, intention toward the sender, and consumer response variables was higher
than 0.6. Therefore, the entire variables in this re-search were considered reliable.
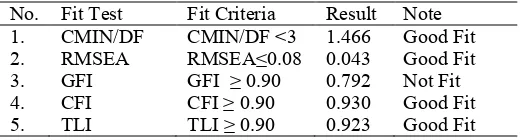
The measurement model should fulfill the criteria of the Goodness of Fit value so that the further anal-ysis was allowed to be conducted. CMIN/DF was a calculation of the chi-square (x2) value divided by
the degree of freedom (DF). The value of CMIN/DF which showed a good fit was < 3. Table 1 shows that the value of CMIN/DF was considered a good fit while it can be considered as close fit if the RMSEA < 0.05. The result showed that the value of RMSEA was considered good fit with a score of 0.033 and fulfilled the criteria of goodness of fit.
The GFI can be considered as a good model (good fit) if the value of GFI ≥ 0.9. However, if the
value of GFI is 0.8 ≤ GFI ≤ 0.9, it can be considered as marginal fit. The result of the research showed that the GFI could be considered as marginal fit with the score of 0.820, but it still fulfilled the criteria of goodness of fit. than 0.90 and fulfilled the criteria of goodness of fit.
The TLI can be considered as a good model (good fit) if the value of TLI ≥ 0.9. Meanwhile, if the
value of TLI is 0.8 ≤ TLI ≤ 0.9, it can be considered as marginal fit. (Hair et al. 2010). The result of the
research showed that the value of the TLI could be considered as good fit with the value of 0.955 which was higher than 0.90 and fulfilled the criteria of can be seen from the value of AVE (Average Vari-ance Extracted) which demonstartes the value of the average variance extracted (AVE) is below 0,5. However, according to Fornell & Larcker (1981) in Huang, Wang, Wu and Wang (2013), the value of AVE which is below 0.5 is acceptable as long as the
163
score of the construct reliability is above 0.6. The score of the whole construct showed a construct reli-ability value of ≥ 0.7 which means that the whole construct could be considered reliable.
Thus, the research may proceed to the next stage. The following table shows the value of the Goodness of Fit. Table 1 show that the values of the structural
model Goodness of Fit have fulfilled the criteria of Goodness of Fit. Therefore, the analysis may
pro-ceed to hypothesis testing.
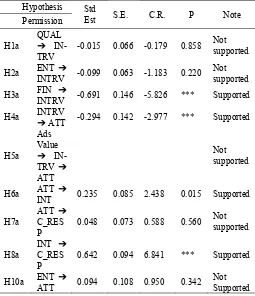
The hypothesis testing was conducted by address-ing the value of CR and the value of ρ. The value of CR ≥ 1.96 and the value of ρ < 0.05, so the hypothe-sis could be considered significant. The estimated value showed the significance of the effect among variables on every path. The bigger the estimated value, the bigger the effect among variables, and it also goes both ways.
Table 2. The Result of Hypothesis Testing
Hypothesis Std
Table 2 shows that hypothesis 1a had an insignifi-cant effect on the Critical Ration value of -0.179 and the ρ value of 0.858 which means that the hypothesis was not supported. Hypothesis 2a did not have a sig-nificant effect on the Critical Ratio value of -1.183 and the ρ value of 0.220 which means that the hy-pothesis was not supported. Hyhy-pothesis 3a had a significant value with the Critical Ratio value of -5.826 and the ρ value of < 0.05 which means that the hypothesis was accepted. Hypothesis 4a had a signif-icant value with the Critical Ratio value of -2.977 and the ρ value of < 0.05 which means that the
hy-pothesis was accepted. Hyhy-pothesis 5 did not have a mediation effect because the quality of information and entertainment variable had an insignificant rela-tion which means that the hypothesis was not sup-ported. Hypothesis 6a had a significant value with the Critical Ratio value of 2.438 and the ρ value of 0.015 which means that the hypothesis was accept-ed. Hypothesis 7a did not have a significant effect on the Critical Ratio value of 0.588 and the ρ value of 0.560 which means that the hypothesis was not sup-ported. Hypothesis 6a had a significant value with the Critical Ratio value of 6.841 and the ρ value of <0.05 which means that the hypothesis was accept-ed. Hypothesis 10a did not have a significant effect with the Critical Ratio value of 0.950 and the ρ value of 0.342 which means that the hypothesis was not supported. From table 2, it can be concluded that of the nine hypotheses there were five hypotheses which were not supported namely hypothesis 1a, 2a, 5a, 7a, and 10a.
4 CONCLUSIONS
Based on the result of the research, it can be con-cluded that of the nine hypotheses, four of them were supported and five of the hypotheses were not supported, such as the quality of information did not have a significant negative effect on the perceived intrusiveness for permission based email in Indone-sia (hypothesis 1a), entertainment did not have a significant negative effect on perceived intrusiveness for permission based email in Indonesia (hypothesis 2a), perceived intrusiveness did not mediate adver-tising value and attitudes toward e-mail adveradver-tising for permission based email in Indonesia (hypothesis 5), attitudes toward e-mail advertising did not have significant positive effect on the consumer response for permission based email in Indonesia (hypothesis 7a), entertainment did not have significant positive effect on the attitudes toward e-mail advertising for permission based email in Indonesia (hypothesis 10a). However, the existing model has described the result of the data in the field. It is shown by the re-sult of the testing the goodness of fit which shows that the level of model fitness on the data can be considered good.
Based on the result of the research, the intention toward the sender on consumer response had the biggest effect compared to the rest. Therefore, the management of online tour and travel agency fo-cused more on making the customers intent to pur-chase and build a good relationship with the online tour and travel agency. It will build a positive per-spective and trust on the services offered by the online tour and travel agency. It will also cause the
164
consumers read and accept the e-mail offers from the tour and travel agency more often in the future (Milne et al. 1993).
REFERENCES
Milne, G. & Gordon, M.E. 1993. Direct mail privacy-efficiency trade-offs within an implied social contact framework, Journal of Public and Ma rketing 12(2): 206-216.
Morimoto, M. & Chang, S. 2006. Consumers’ attitudes toward unsolicited commercial e-mail and postal direct mail mar-keting methods: intrusiveness, perceived loss of control, and irritation, Journal of Interactive Advertising 7(1): 8-20. Rowley, J. 2001. Remodeling marketing communications in an
Internet environment, Internet Research 11(3): 203-212. Septianita, W., Agus, W.W., & Arif, A. 2014. Effect System
Quality, Information Quality, Service Quality of Rail Tick-eting System (RTS) to User Satisfaction 1(1): 53-56. Schlosser, A.E., Shavitt, S., & Kanfer, A. 1999. A Survey of
internet users’ attitudes toward internet advertising, Journal of Interactive Marketing 13(3): 34-54.
Tezinde, T., Smith, B., & Murphy, J. 2002. Getting permission: exploring factors affecting permission marketing, Journal of Interactive Marketing 16(4): 28-36.
Zia ul Haq. 2009. E-mail advertising: A study of consumer atti-tude toward e-mail advertising among Indian users, 8 207-223.
165