SUPPLY RESPONSE ANALYSIS OF PADDY IN KEDIRI: MANAGERIAL
IMPLICATIONS
Analisa Respon Penawaran Padi Di Kediri: Implikasi Manajerial
Vii Nurul Choirina1, Slamet Hartono2, and Any Suryantini2 1Student of Magister Manajemen of Agribusiness, Faculty of Agriculture
Universitas Gadjah Mada
2Lecturer of Social Economic of Agriculture Department, Faculty of Agriculture Universitas Gadjah Mada
Jl Flora, Bulaksumur, 55281 Yogyakarta [email protected]
Diterima tanggal : 5 April 2016 ; Disetujui tanggal : 13 Juni 2016
ABSTRACT
Research of farmer’s response analysis to price is important to increase paddy production in Kediri. Farmers are conducted as the object of the research because they are the decision maker on all of farming activities. This study is aimed to know the effect of harvest area response, productivity response, supply response paddy, and managerial implications in Kediri. The analysis method used the Nerlove approach through harvest area response and productivity response. Data were collected annually from 1992 to 2015. The result showed that harvest area in previous year was the signiicant factor to the harvest area. Grain price, fertilizer price index, rainfall, harvest area in previous 2 years and 3 years had no signiicant effect. Factors which had signiicant impact for the productivity were grain price and productivity in the previous year, but fertilizer price index, harvest area, and rainfall had no signiicant effect. Paddy supply-elasticity in short term and long term was inelastic so that supply paddy was unresponsive on grain price changing. Managerial implication formulation consists of procedural implications and policy implications. Procedural implications included the use of a transplanter, jajar legowo system, use of fertilizer in 6 right-ways completed with a demonstration plot. The policy implication is was composed by price and non-price policies. Price policies were showed by costs of good sold which was supported by coopertaion between farmers and BULOG and the use of combine harvester. Non-price policies were embodied with the increasing of cropping index and wetland transformation into settlements.
Keywords: elasticity, managerial implications, paddy, price, supply response
INTISARI
INTRODUCTION
Food is the most basic requirements for human resources of a nation. Food security requiresavailability of food in suficient quantity and quality, distribution ways in affordable prices and food safety. Food safety means they are safe to be consumed for people to support their daily activities.(Purwantini, et al., 2002).
East Java is one of the cetral of rice productions and contribute for national spare. East Java is able to supply more than 17 percent of national rice and provides rice for 15 others provinces through Bulog (Deptan Jatim, 2014). In order to strengthen food security towards national food self-suficiency, the government of East Java province focuses on excalation production of staple food crops. One of them is paddy.
Kediri is the one of rice crops, especially paddy in Jawa Timur. In the other hand, Kediri is supported not only
by the width of the wetland but also the large of population which are relied on agriculture for livelihood (BPS, 2015). The problems are luctuation of productivityand declining of land area harvested from 2010 until 2013.
The rapid growth of the population of Kediri demands the availability of rice on a local scale. Kediri government should achieve food security and food self-sufficiency. One way to make it happened is to make agriculture on the top priority in development plan. Food security can be done by some programs such as the intensification of seeds, balanced fertilization, pest and disease control, and utilizing marginal land.
The expansion can not be done easily because one of the main characteristics of agricultural products is the lag time between planting and harvesting which is called as gestation period. The results signiikan terhadap luas panen. Harga gabah, indeks harga pupuk, curah hujan, luas panen pada 2 tahun sebelumnya dan 3 tahun tidak berpengaruh signiikan. Faktor yang memiliki dampak signiikan terhadap produktivitas adalah harga padi dan produktivitas pada tahun sebelumnya, namun indeks harga pupuk, luas panen, dan curah hujan tidak berpengaruh signiikan. Elastisitas penawaran beras dalam jangka pendek dan jangka panjang bersifat inelastis sehingga penawaran padi tidak responsif terhadap perubahan harga gabah. Formulasi implikasi manajerial terdiri dari implikasi prosedural dan implikasi kebijakan. Implikasi prosedural termasuk penggunaan transplanter, sistem jajar legowo, penggunaan pupuk dalam 6 cara benar dilengkapi dengan plot demonstrasi. Implikasi kebijakannya disusun oleh kebijakan harga dan non-harga. Kebijakan harga ditunjukkan oleh biaya barang yang terjual yang didukung oleh kerjasama antara petani dan BULOG dan penggunaan pemanen gabungan. Kebijakan non-harga diwujudkan dengan meningkatnya indeks tanam dan transformasi lahan basah menjadi permukiman.
obtained by farmers based on estimation of future periods and their experiences in the past. When a commodities price of agriculture increase at a certain time, the increase is not followed automatically by productivity and areal increasing. It is beacuse resource allocation decisions have been set at the previous time. The farmers’ responses occurred after the time difference (lag) as the impact of changes in input prices, output, and government policies. If the price is estimated higher, farmers will continue their ways and change their ways at the next period by altering the composition of the resource, so that in the short term price elasticity is inelastic.
Improvement and sustainability of rice production is largely determined by the farmer’s participation in the government’s programs. Efforts to increase production will not be achieved if farmers do not give any supports for the programs. In this condition, farmers is the critical success factos of agricultural production improvement program so goverment needs to run incentif systems for those who increase production sucessfully.
Farmer decisions in allocating resources, whether land, labor, and funds for a variety of land-use options is determined by the response of farmers to price, government policies and other factors. Supply response research determines the success of the price increase in production in Kediri, because in the end farmers who
will make decisions on production and business activities.
Hutaharuk (1996) showed a response to the price of rice acreage outside Java was greater than in Java that indicated that there were any limitations acreage in Java. Response acreage outside Java was responsive to the price of rice. It showed that price increasing wasfollowed by an increase in acreage. This was a reason for farmers to plant the commodity. The price was so important for the consideration of farmers in planting a particular commodity.
The problem of this research were: 1) the factors that affect in response harvest area; 2) factors that affect the response of productivity; 3) Paddy supply-elasticity in Kediri; 4) To describe the magerial impication of supply response result.
Then the study was conducted in order to: 1) determine the factors that affect the response harvest area and productivity; 2) determine the elasticity of supply of paddy in Kediri, both short term or long term; 3) Determine magerial implication of supply response.
METHODS
research, the method is applied to know manajerial implication from paddy supply response. Method for determining the location was purposive method, that was Kediri.
The data used in this research was secondary data. Data were collected annually from 1992 to 2015.To guess the harvest area response and productivity response, the resarche used the grain price, fertilizer price index, harvest area, productivity, and rainfall.All of data related to rupiah were delated by the consumer price index by using the base year 2007. Delation was needed to eliminate external factors, such as inlation. The data were taken from Badan Pusat Statistik Kediri, Dinas Pertanian Kediri, and BULOG Kediri.Both primary data and indepth interview were used in this research in which agriculture departement, rice miller, and farmers as the subject of research.To determine the factors that affect the response, partial model Nerlovedeveloped by Marc Nerlove was adapted.The rearch used harvest area response and productivity r e s p o n s e a p p r o a c h a n d r e g r e s s i o n analysis.
1. Harvest Area Response
Partial adjustment models for harvest area response in this study as follows: At = b0 + b1HRGt + b2 indeksHRGPPKt +
b3CHt+ b4At-1 + b5At-2 + b6At-3+ ut
Information:
At = harvest area in t-year (ha) HRGt = grain price in t year(Rp/Kg) indeksHRGPPKt= fertilizer price index CHt = rainfallin t-year(mm/th)
At-1 = harvest area in the previous year (Ha)
At-2 = harvest area in the previous 2 years (Ha)
At-3 = harvest area in the previous 3 years (Ha)
ut = error
b1,..,b6 = coeficient of regression
To facilitate the estimation using OLS, the response equation harvest area was transformed into a linear form as follows:
LnAt = Lnb0 + b1LnHRGt +
b2indeksHRGPPKt + b3LnCHt+ b4
LnAt-1 + b5LnAt-2 + b6LnAt-3 + ut
2. Productivity Response
Partial adjustment models for productivity response in this study as follows :
Yt = d0 + d1HRGt + d2 indeksHRGPPKt
+ d3CHt + d4At + d5Yt-1 + ut
Information:
Yt = paddy productivity in t-year (kw/ha)
At = harvest area in t-year (Ha)
Yt-1 = paddy productivity previous year (kw/ha)
ut = error
d1,..,d6 = coeficient of regression
To fulil the estimation with OLS, then the response equation productivitywas transformed into a linear form as follows:
LnYt = Lnd0 + d1LnHRGt +
d2indeksHRGPPKt + d3LnCHt +
d4LnAt + d5LnYt-1 + ut
To analyze the supply elasticity of short-term and long-term used the following formula:
Elasticity area on output prices in the short term (ԐAP ( sr )) and long term (ԐAP( lr)) on the average value and the price of each area were :
(ԐAP(sr)) = b1 (P/A)
(ԐAP(lr)) = (ԐAP(sr)) /(1-b4)
Elasticity of short-term productivity of each of the output price (ԐYP (sr)) and area (ԐYA(sr)) were :
(ԐYP(sr)) = d1(P/Y) dan (ԐYA(sr)) = d5(A/Y)
Long-term elasticity of output and productivity on the price of harvest areas were:
(ԐYP(lr)) = (ԐYP(sr))/(1-d5) dan (ԐYA(lr)) = (ԐYA(sr))/(1-d5)
Supply elasticity deals can be formulated as follows :
ԐP = ԐYP + ԐAP (1+ԐYA)
Information:
ԐP = supply response commodity, ԐYP = productivity elasticity to the
price,
ԐAP = area elasticity to the price, and ԐYA = productivity elasticity to the
harvest area.
3. To know managerial implication To ind the managerial implication, we used:
a. Data reduction, the methode which guided us to concern in choosing, focusing, abstaracting, and also transforming row-noticed data.
b. Data arranged in a logic way so that the conclusion could be showed.
c. Conclusion was stated to ind the data interpretation.
RESULTS AND DISCUSSION
1. Researsch Area Describtiondaily needs and irrigation before it reachs Brantas river.
In the structure of the economy Kediri, agriculture still had an important role. Agriculture sector contributedabout 26.94 percent and came as the irst position among all sectors to the GDP in 2014. Contribution of the agricultural sector was dominant and absorbent employment in this sector was high enogh, the agricultural sector is still the prominentsector for its economic condition.
Kediri is known as one of the agricultural center in East Java province with an area of 47.786 hectares paddy ields and 90.819 hectares areothers. In 2014, Kediri tried hard to extense farm area to anticipate its declining.As a result, the area of wetland in the year increased by 0.14 percent. Although the increase there were a few, but such efforts should be continued to improve. It also need any appreciationsto suceed food security.
The decline in rice production in 2014 was caused by irrigation possibilities that already need to be repaired and upgraded, the harvest area was decreasing, and pests (BPS, 2015). As a result, stems and grains of rice which were produced no longer contained solid, and a decrease in harvested area of 195 ha or 0.38 percent. In 2014 Purwoasri, Plemahan and Kandangan district werethe biggest three which contributued much in rice production in Kediri. Beside that, districts with a high production were in Kunjang, Badas, Papar and Plosoklaten.
2. Supply Response Analysis a. Harvest Area Response
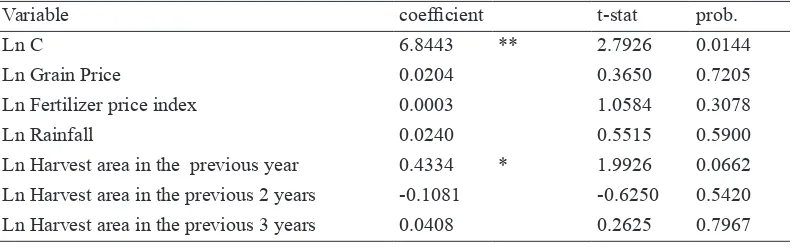
The results of the analysis of the factors that affect the harvest area were presented in Table 1.
The value of F arithmetic was 2.639 with a probability of 0.063. The value was signiicant with an error rate of 10%. The results showed that all independent variables (the price of grain, fertilizer price index, rainfall, the harvest area in the previous year, harvest area in the previous 2 years, and the harvest area in the previous 3 years) had significant effect on the dependent variable (harvest area).
R2 values of 0.53 or 53% indicated that independent variables such as the price of grain, fertilizer price index, rainfall, harvest area in the previous year, harvest area in the previous 2 years, and the harvest area in the previous 3 years gave effect of 53% the harvest area, while 47% were influenced by other factors outside the model.
derived from 1-regression of coeficients harvest area in the previous year (1-b4At-1), that was 0.567.
Table 2 showed the elasticity of short-term and long-short-term variables inluencing the harvest area.
Table2. Elasticity of short-term and
long-term variables influencing the harvest area
Variable
Short Term Elasticity
Long Term Elasticity
Ln Harvest area in the previous year
0.433 0.763
Source: Secondary data, 2016 (calculated)
Factors that affect the harvest area was the harvest area in the previous year with marked positive and regression coeficient 0.433, signiicant at the 1 % error rate. Value
Table 1. Results of regression test harvest area
Variable coeficient t-stat prob.
Ln C 6.8443 ** 2.7926 0.0144
Ln Grain Price 0.0204 0.3650 0.7205 Ln Fertilizer price index 0.0003 1.0584 0.3078
Ln Rainfall 0.0240 0.5515 0.5900
Ln Harvest area in the previous year 0.4334 * 1.9926 0.0662 Ln Harvest area in the previous 2 years -0.1081 -0.6250 0.5420 Ln Harvest area in the previous 3 years 0.0408 0.2625 0.7967
F hit= 2.639Prob = 0.063
R2 = 0.530
Source : Secondary data, 2016 (calculated) Information:
*** = signiicant in error 1% ** = signiicant in error 15% * = signiicant in error 10%
indicated the short-term elasticity means that if the harvest area in the previous year increase 1 %, the harvest area in the current year will increase by 0.433 %. In the short term elasticity was inelastic which means that changes in harvest area in the previous year larger than the harvest area. Long-term elasticity of 0.763, which means was inelastic too, if the harvest area in the previous year increase 1%, the harvest area now would increase by 0.763 %. The elasticity could be seen in Table 2.
between the price of a commodity by the amount of the offer was positive, so the higher the price of a commodity, the greater the amount of the commodity supplied, and ceteris paribus. In this study were not statistically correspond to the theory, this is caused by the increase or decrease price of grain does not make getting up or down harvest area because doing extending very dificult in the area of research. Beside that, the area in Kediri islikely to decline due to land conversion to residential.
The price index of fertilizer had no signiicant effect on the harvest area. Subsidized fertilizer urea is a major fertilizer in rice cultivation. In real condition the increase or decrease in fertilizer prices will not make farmers reduce or increase acreage.In the research area, rice planting season has been scheduled so when prices
of fertilizer decrease, farmers can not add acreage because of limited land. This also happens with rainfall does not affect the harvest area. Increases or decreases in rainfall does not make farmers increase or decrease the acreage because of limited land.
The harvest area in the previous 2 years had no signiicant effect on the harvest area. It showed harvest area in the previous 2 years did not increase harvest area. The harvest area in the previous 3 years had no signiicant effect on the harvest area.
b. Productivity Reponse
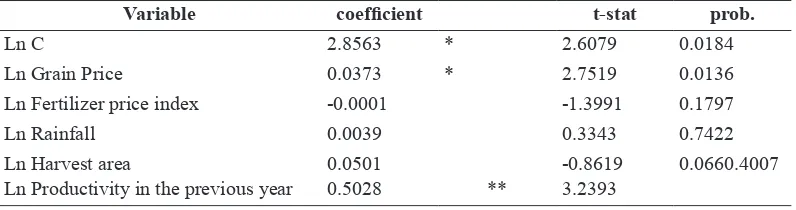
The results of the analysis of the factors that affected the productivity response were presented in Table 3.
The test results F, R2, and the mean of the regression model were shown in table 3. The value of F arithmetic amounted to
Table 3. Result of regression test of productivity
Variable coeficient t-stat prob.
Ln C 2.8563 * 2.6079 0.0184
Ln Grain Price 0.0373 * 2.7519 0.0136 Ln Fertilizer price index -0.0001 -1.3991 0.1797
Ln Rainfall 0.0039 0.3343 0.7422
Ln Harvest area 0.0501 -0.8619 0.0660.4007 Ln Productivity in the previous year 0.5028 ** 3.2393
F hit= 11.331Prob = 0.000 R2 = 0.769
Source: Secondary data, 2016 (calculated) Information:
11.331 with a probability of 0.000. The value was signiicant with an error rate of 1%. The results showed that all independent variables (price of grain, fertilizer price index, rainfall, harvest area, and productivity in the previous year) had signiicant effect on the dependent variable (productivity). R2 values of 0.769 or 76.9% indicated that independent variables such as price of grain, fertilizer price index, rainfall,harvest area, and the productivity in the previous year had the effect of 76.9% the productivity response, while 23.1% were inluenced by other factors outside the model.
Signiicance test of the regression coeficient or t test in the study was held by looking at the α value stated in the column probability (prob.). and analyzed coeficient regression to determine short term and long-term elasticity which variables inluencing the productivity response.Adjustment coeficient (δ) derived from 1-regression of coeficients productivity in the previous year (1-b5Yt-1), that was 0.498.
Table 4 showed the elasticity of short-term and long-short-term variables inluencing the productivity.
Table4. Elasticity of short-term and
long-term variables influencing the productivity
variable Short term elasticity
Long term elasticity
Grain Price 0.0373 0.0748 Productivity
in the previous year
0.5028 1.0096
Source: Secondary data, 2016 (calculated)
Factors that significantly affected productivity was the grain price, harvest area and productivity in the previous year. The price of grain was statistically signiicant effect on the productivity with marked positive and regression coeficient 0.037, signiicant at 5% error level. This value indicated the short-term elasticity means that if the grain prices increase 1%, the productivity current year will increase by 0.037%. In the long term elasticity was 0.0748, if the grain prices increase 1% the productivity increased by 0,0748%. In the short term and long termprice of grain inelastic, that means the change in productivity greater than the real grain prices. Nevertheles the increase grain prices made farmers more intensive to manage rice crops in ields.
Productivity in the previous year affectedstatistically signiicant with a positive regression coefficient of 0.50in 1% error level. It showed every 1% productivity in the previous year could increase productivity 0.50% in the short term.In the long term each 1% of productivity in the previous year would increase 1,009% productivity (Table 4). Increased productivity in the previous year made farmers more intensive to improve the productivity of rice.
that farmers would continue to produce rice as possible as the increasing or decreasing in fertilizer prices. For farmers, fertilizer was the most important requirement of rice so that the price increase caused nothing.Rainfall was also not signiicant effect and positive marked. It showed that increasing rainfall did not increasing productivity. Water requirements for rice cultivation in the study area was illed by irrigation, mostly taken from the Brantas River . When rainfall is low, farmers will use the irrigation so that the decline in rainfall did not affect the productivity. Harvest area statistically had no signiicant effect on the productivity of rice. According to Kepala Dinas Pertanian Kediri, condition does not occur in this research because extensiication can only be done in marginal areas and needs some adapatation techniques.
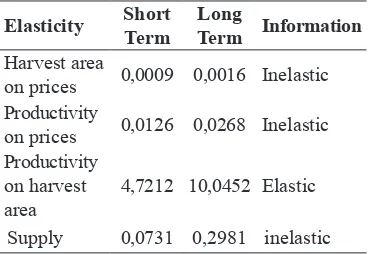
c. Supply Elasticity
Supply elasticity results were shown in Table 5, which included elasticity area, productivity, and supply.
Table 5. Area Elasticity, Productivity, dan
Paddy Supplyin Kediri Elasticity Short
Term
Long
Term Information Harvest area
on prices 0,0009 0,0016 Inelastic Productivity
on prices 0,0126 0,0268 Inelastic Productivity
on harvest area
4,7212 10,0452 Elastic
Supply 0,0731 0,2981 inelastic
Source: Secondary data, 2016 (calculated)
Table 5 showed that elasticity of
harvest area to grain price was inelastic, 0.0009 for the short term and 0.0016 for the long term. The analysis showed that if the prices increase by 100%, it would increase the harvest areaof 0.09% in the short term and 0.16 % in the long term. Elasticity of productivity on the prices was inelastic for the short term that is 0.012 and 0.026 for the long term. If the prices increase 100%, it would increase productivity 1.2% for the short term and 2.6% for the long term. Research conducted by Leo (2000), the elasticity of harvest area and productivity response of the rice price in Java was also inelastic both short term and long term.
Productivity elasticity to the prices was greater than the elasticity harvest area to the prices, in the short term and long term. It showed that the contribution of increased production due to increased productivity was greater than the increase in harvest area. Increased productivity is done with the use of improved seed that has a high yield.
Paddy supply elasticity in Kediri was inelastic, 0.073 in the short term and 0,298 in the long term. It can be argued that the change of supply not responsive to changes in the price of grain. If the price increase 100%, the supply would increase by 6.6% in the short term and 19.9% in the long term .
Paddy supply elasticity was less responsive because farmers could not immediately adjust their production activities in response to price increasing because farmers will adjust price forecasts in the future in the form of the difference between the estimated proportion with the reality. Gujarati (2005) , mentioned three main reasons underlying it, namely 1) psychological; 2) technical; and 3) institutional.
Psychologically farmers were often reluctant to make changes because it is generally fixed on the old traditions. Technically, the agricultural production process needs lag time in between planting and harvesting. Similarly, the introduction of new production techniques requires time to be adopted by farmers and growers adapt new production techniques before it could eventually increase the production.
Institutional change could not happened because there were rules, such as the existence of a contractual agreement binding on production time. Farmers in Kediri sell their grain in the middleman with the prices below the loor price set by goverment. Though BULOG provides grain prices above the base price, but farmers prefer
to sell to middlemen because farmers get cash immediately without delay. BULOG uptakes in minimal quantity .Based onRice Productivity Index coeficient, BULOG only absorbs below 70% of global production produced by Farmer (Citra Indonesia,2015).
Besides that, Firdaus (2008) mentioned that agricultural commodities was seasonal and dependent on nature. Seasonal nature of agricultural commodities made farmers less responsive to the price. The higher prices raisesafter the harvest time. Kediri planting pattern is paddy at the irst season and followed by other crops.
Table 6. Respondents percentage.
No Aspect Reason Persentage
(%)
1. The width of area
The widht of
area dificult to
upgrade: effect in term of the wide o to change their plant and also give no effect in the width of farming area.
So, the price-response of paddy happened after the other crops harvested.
3. Managerial implication
Mnagerial implicationis divide into two terms : procedural implication and policy implication. Procedural implication relates to the way and procedur in increasing the rice production. Policy implication is the right policy to motivate farmers in increasing production result.
Table 6 showed the result of indepth interview.
a. Implikasi Prosedural
R e s p o n d e n t s s t a t e d t h a t extensification manner by increasing farming area was imposible (Table 6). Respondents said that there were so many farm area which was repalced into the housing area. Extensiication could be done by renting the farm area but there wre a few chance to rent because the land owner was less than those who wante to rent.
Intensiication process was used by getting the wider farm to increase produtivity. Jajar legowo and the using of transplanter were used in Kediri to support intensiication system. In the other case, some farmers did not follow thistechnology because they assumed that their conventional way of farming was beneficially enough. Some demotration plots were build by using transplanter and jajar legowo system and the harvest index signiicantly higher. Others things whih was important to do was recording the production
beire The jajar legowo system was compared with tanam tegel system—the conventional system one. This note was used in evaluatin meeting in farmers organization.
The fertilizer price index did not signiicantly give effect in widht area and productivity. So the additional subsidized fertilizer was no need to do. To make sure that the fertilizer was proper enough, the soil test should be taken to konow that the use of fertilizer was in a right kind, in a right way, in a right time, and also in a right matter. The demonstartion plot was neede to show that the right use of fertilizer colud lead us into the high productivity.
b. Policy implication
The main objectives of Policy implication was to make the productivity higher and harvest area getting wider. The policy impplied in price and non price implication.
Rice harvest index was the solution of non-price policy. Harvest index was the average of harvesting produced in a year. Farmers planted rice in twice or ifth times in a year because water irigation was served properly. Departement of agriculture and farmers organization made a regulation in planting pattern to ind the certain harvest index.
fourth season; (b) The water irigation was available a year long; (c) Each farming activites was held quic and fast and overlapped in some process; and (d) The rice was plated in the same times.
Brantas river was the source of Kediri water irrigation but to deliver the water to farm, the legal regulation and social regulation were needed.
Other policy was also needed to state the regulation in replacing farm into another function such as housing and industrial area. All of this was regulated in UU num. 41 2009.
Price policy is done by increasing grain price When government attempt to increase the price of rice, the productivity will higher because farmers will more interesting in their farm activities. They know that they will gain the higher beneit. The price policy was regulated in Inpres Number 5 2015 by determining the grain price.
The use of rice corporation as the center of rice market was also a good policy to apply. Farmers, land owner, and everyone who had relationship in agriculture activity were binded in this cooperate. In Kediri, the agriculture cooperate has the same function with farmers organization. To sell their rice to BULOG, farmers organization hold an important role.
CONCLUSION AND SUGGESTION
Factors affected significantly harvest area response was harvest area inprevious year with the positive marked. Grain price, fertilizer price index, rainfall, harvest area in the previous 2 year and 3 year had no signiicant effect. Harvest area afected significant and caused positive effect; productivity in the previous year afected signiicant and caused negative in productivity response, but fertilizer price index and rainfall had no signiicant effect. Supply paddy elasticity in short term and long term is inelastic which means supply paddy unresponsive on grain price.
Procedural implication which was choosen in this way was to arrange jajar legowo planting system, to use fertilizer in certain doze and to build a laboratorium ield as this demonstartion plot. Non-price implication was applied by increasing rice plant index and regulating 0ver land function. The price imlication could be followed with increasing the rice price and binding a good linkage with BULOG.
ACKNOWLEDGEMENT
1. To both parents and all of families for uncountable prays and unconditional support.
2. To all lecturers and staffs who help this research for the guidance and support. 3. Special thanks to Dr.Slamet Hartono, SU.M.Sc and Dr. Any Suryantini, SP, MM, who gives the chance to build the research.
REFERENCES
Badan Pusat Statistik. 2015. Kabupaten Kediri Dalam Angka 2015, Bab V Pertanian, Tanaman Pangan. Kediri : BPS Kabupaten Kediri Jawa Timur.
Citra Indonesia. 2015. Diunduh di http://citraindonesia.com/201509/ [internet], accesed 12 April 2016. Deptan Jatim. 2014. Rencana Strategis
(Renstra) Dinas Pertanian Provinsi Jawa Timur Tahun 2009-2014 (Revisi). Surabaya : Dinas Pertanian Provinsi Jawa Timur.
Firdaus, M. 2008. Manajemen Agribisnis. Jakarta : Bumi Aksara.
G a r s i d e d a n H a s y i m i . S i m u l a s i Ketersediaan Beras di Jawa Timur. JITI 14 (1): 47-58
Gujarati, D. 2005. Ekonometrika Dasar. Penerjemah: Zain dan Sumarno. Jakarta : Penerbit Erlangga.
Hutahuruk, J. 1996. Analisis Dampak
Kebijakan Harga Dasar Padi dan
Subsidi Pupuk terhadap Permintaan
dan Penawaran Beras di Indonesia.
Program Pasca Sarjana. IPB.
Leo, Zukhiri Agusty. 2000. Respon Penawaran Padi di Indonesia. Bogor : IPB.
Oktavianto, L.K. 2009. Analisis Respon P e n a w a r a n K e l a p a S a w i t d i Indonesia. Fakultas Ekonomi dan Manajemen. IPB. Bogor.
Purwantini, T.B., Ariani Mewa, Marisa Yuni. 2002. Analisis Kerawanan Pangan dalam Perspektif Disentralisasi Pembangunan di Nusa Tenggara Timur. Pusat analisis ekonomi dan Kebijakan Pertanian. Bogor.
Singarimbun. 1995. Metode Penelitian Survei. Jakarta : LP3ES.