A
SAR INTENSITY IMAGES CHANGE DETECTION METHOD BASED ON FUSION
DIFFERENCE DETECTOR AND STATISTICAL PROPERTIES
Bin Cui a,b, *, Yonghong Zhangb, Li Yana, Xuanxuan Caib
a School of Geodesy and Geomatics, Wuhan University, 129 Luoyu Road, Wuhan, China – [email protected] b Chinese Academy of Surveying & Mapping, 28 Lianhuachi West Road, Beijing, China - [email protected]
Commission I, WG I/3
KEY WORDS: SAR Change Detection, Multi-Temporal SAR Intensity Images, Log Ratio, Log Likelihood Ratio, Dual Thresholds Selection, Ratio Value of Adjacent Grey-Level
ABSTRACT:
Detecting the land cover changes is an important application of multi-temporal synthetic aperture radar (SAR) images. This study puts forward a novel SAR change detection method which has two-steps: change detector construction and change threshold selection. For change detector construction, considering the SAR intensity images follow the gamma distribution, the conditional probabilities of the binary hypothesis test are provided, then the log likelihood ratio (LLR) combined with the log ratio (LR) to construct a detector which can enhance the degree of change to calculate the diversity degree convenient between the two images;for change threshold selection, owing to the characteristic that the curve about the ratio value of adjacent grey-level (GL) values in normalized difference map, the normalized difference map can be segmented in three parts by two thresholds selected which correspond to the regions of unchanged, backscatter enhanced and weakened separately. And as this, the change areas can be also determined simultaneously. The experimental results on different areas and sensors indicate that the proposed algorithm is effective and feasible.
1. INTRODUCTION
The task of change detection is to detect the land cover changes between multi-temporal images in the same scene, and this is also an important application of remote sensing images. Among kinds of remote sensing images, SAR image is widely concerned as it can work normally in all kinds of weather and illumination conditions, especially in disaster monitoring (Di Martino et al., 2007), urbanization studies (Bovolo et al., 2007), agricultural and forest survey (Lakshmi et al., 2015; Bruzzone et al., 1997). But due to it has a special image model, the speckle noises would also reduce the ability to utilize the information from the images. At present, a lot of research have been done in SAR change detection, mostly in two fields: change detector construction and difference image analysis (Xiong et al., 2012). In change detector construction, there are many methods, like LR based on pixel, mean-ratio (MR) (Inglada et al., 2007) and neighbourhood-based ratio (NR) (Gong et al., 2012) used the information of neighbour pixels, method based on distribution divergence (Gao et al., 2010), method based on intensity and texture changes (Gong et al., 2014) and likelihood ratio (LLI) method (Xiong et al., 2012); in difference image analysis, the major popular measures are thresholding, clustering and graph cutting. As the simplest method, the thresholding methods have been widely concerned, such as OTSU (OTSU, 1979), Kittler and Illingworth (K&I) (Kittler et al., 1986), maximum-entropy (Kapur et al., 1985), expectation-maximization (EM) (Dempster et al., 1977) and some other improvement methods based on them (Bazi et al., 2005).
To detect the change areas more precisely and distinguish the different change type in the difference map. In consideration of using the statistical properties can cope with the speckle noisy better when compared with processing the image pixel-by-pixel. And assuming the SAR intensity images follow the gamma distribution (Oliver et al., 2004), the conditional probabilities of
* Corresponding author
the binary hypothesis test (changed versus unchanged between two images) would be provided, then the fusion difference detector (FDD) combined by LLR and LR can enhance the degree of change thus can make the calculation of the diversity degree convenient between the two images; for change threshold selection, the thresholds have been selected from the ratio curve (TRC) by using the statistical properties, as the characteristic of the ratio value of adjacent GL in normalized difference map, the normalized difference map can be segmented in three parts – unchanged, backscatter enhanced and weakened regions by two thresholds selected. Because of this, the change areas and the different change type can be determined simultaneously. By using the proposed change detection method, the difference map generated has a better performance in visual effect and differentiates the different change type regions from the unchanged regions in change map.
2. METHODOLOGY
2.1. Change Detector Construction
The methods widely used nowadays to construct a change detector often have a filter in the pre-processing part which lead to a result of reduction the speckle noisy and information in the image at the same time. So, in this letter, none filter would be used in the pre-processing part to avoid the information lost.
2.1.1.LR
���= log���= log� −log� (1)
where X, Y = multi-temporal SAR intensity images
2.1.2. LLR
As the (Xiong et al., 2012), the probability density functions (PDF) in a homogenous with an L -look image can be described as equation (2):
In this letter the homogenous areas are replaced by the adjacent N-1 pixels around���, and if the number of image is 2, the SAR images change detection would be formulated as the binary hypothesis test with the null hypothesis versus the alternative hypothesis as equation (4) and (5):
�0(�ℎ�����): �(�1) =�1≠ �(�2) =�2 (4)
�1(���ℎ�����): �(�1) =�1=�(�2) =�2=�0 (5)
where �0 = null hypothesis �1 = alternative hypothesis
�� = the average value of N pixels around ��� (including���)
The conditional probabilities of accepting null hypothesis or alternative hypothesis as the joint PDF that all follow the same PDF can be defined as (6) and (7):
As the maximum likelihood estimation, the likelihood functions �0 and �1correspond to �(�|�0) and �(�|�1) are (8) and (9):
After take the logarithm and derivative of the likelihood functions, the estimations of�0, �1and �2 can be described as
As the simplification of LLI can be expressed as (12):
����= ����������0�1�=�(�4�1+�1�22)2�exp(0) (12)
Where ���� = the difference map generated by LLI �1= �1∑��=1��1
�2= 1
�∑��=1��2
Then the LLR calculated in this article can be expressed as (13):
����= log(�) = log (
4�1�2
(�1+�2)2) (13)
2.1.3. FDD
In consideration of the advantages of the two methods, the change detector used would be constructed by the fusion of the two methods. The expression would be defined as equation (14):
����=���∗ ���� (14)
where ���� = the difference map generated by FDD ���= the difference map generated by LR ���� = the difference map generated by LLR
If X and Y represent the different multi-temporal SAR intensity images. When X-Y>0, which means the backscatter enhanced, and the larger the X-Y is, the more clearly the change is. �0 is the probability image accepting null hypothesis and �1 is the probability image accepting alternative hypothesis, the values of the LLR are all less than 0 except the average of the calculate windows in the two images are the same which correspond to the values greater than 0 and close to 0. Usually, the average of the two calculate windows would not exact same, which lead to a result that the ���� much less or slightly less than 0, as the ��� is greater than 0, so ���� is less than 0 or slightly larger than 0. Among this, the values around 0 correspond to the unchanged parts in the difference map, and to the normalized difference map, the small value would correspond to the high probability of backscatter enhanced. Similarly, when X-Y <0, the large value corresponds to the high probability of backscatter weakened. For those weak change, whatever enhanced or weakened, as the two parts both close to 0, the ���� would also close to 0.
statistical information and the ability of reflect the change type recessively from the LR. By combining these two methods, the difference map generated can enhance the degree of change and reflect the different change type at the same time.
From the equation (1) and (13), both show that the small change probability correspond to the product of two components is around zero, and the high change probability correspond to a large absolute value of the product. So the change detector expressed in equation (14) can be defined as equation (15):
����= (log��1−log��2)∗ �log� 4�1�2
(�1+�2)2�� (15)
2.2. TRC
Assuming the changed regions are smaller than the unchanged regions in multi-temporal images. After obtained the difference image and mapped the difference image to 0-255 to select the thresholds convenient. By using the statistical information of the normalized difference map, each stability interval in the curve about the ratio value of adjacent GL correspond the different regions of change type in normalized difference map.
The curve generated would be a discontinuous function, the interval which has the maximum value and the minimum value of the curve has been selected as the threshold selection interval. It shows an obvious single steep peak and the maximum value close to the minimum value from the left side. The lower threshold which segments the backscatter enhanced regions and the unchanged regions would be the first point at the left side of the monotonically increasing interval to the maximum value, and why not choose the inflection point is under this condition the interval would not a whole interval as it can be described as the equation (16). And the upper threshold which segments the unchanged regions and the backscatter weakened regions would be the first point at the right side of the monotonically increasing interval from the minimum value to the inflection point, which described as the equation (17). Since this, the change areas would be segmented, furthermore, the changed regions are divided into the backscatter enhanced and weakened regions simultaneously. The flowchart of the proposed method is shown in Figure 1.
�ℎ������= (arg min�(��))−1 �ℎ�� (�� ↗ ��−���) (16)
�ℎ������= (arg min�(��)) + 1 �ℎ�� (�� ↗ ��+���) (17)
where �ℎ������ = the lower threshold �ℎ������ = the upper threshold
�(��) = the ratio value of adjacent GL
�� ↗ ��−��� = monotonically increasing interval from the inflection point to the maximum. �� ↗ ��+��� = monotonically increasing interval from
the minimum to the inflection point.
3. EXPERIMENTS AND ANALYSIS
To validate the effectiveness of the proposed method, two data sets with different areas and sensors are tested in the experiments.
3.1. Bern Data Set
The first data set is made up of the images acquired by the European Remote Sensing 2 sensor over Bern, Switzerland, on 20 April and 25 May 1999 respectively and a ground-truth image with photo interpretation, from them, it is easy to find that the ground changed owing to the flood, as shown in Figure 2(a), (b) and (c). They are all 301×301 pixels.
Image X Image Y
LR LLR
1
Difference Map
2
Change Map
①:Fusion of two methods
②: Thresholds selection
Figure 1. The flowchart of the proposed method
In the experiment, a 3×3 window is used to instead the homogenous region and the difference image has been normalized to 0-255 to calculate convenient. Before thresholds selection, a 3×3 Lee filter has been done on the difference image which is shown in Figure3 (a).
(a) (b) (c) Figure 2. Multi-temporal images of Bern. (a) Image acquired on
20 April. (b) Image acquired on 25 May. (c) Ground-truth.
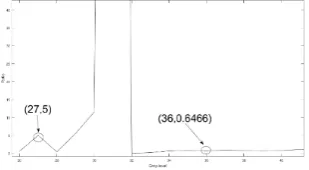
From the curve about ratio value of adjacent GL shown in Figure 3(b), a steep peak is clearly shown on the left side of it, implying the backscatter enhanced regions are small.
(a) (b)
Figure 3. (a) Difference image generated by FDD on Bern. (b) Curve about the ratio value of adjacent GL on Bern difference
image.
Figure 4 is the local amplification of the Figure 3(b), which shows that the lower and upper thresholds selected are 27 and 36, the values lower than 27 represent the backscatter enhanced regions, those between 27 and 36 are the unchanged regions and higher than 36 represent the backscatter weakened regions.
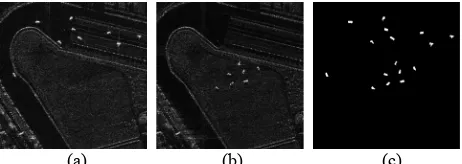
Figure 5(a), (b) and (c) show the change images segmented by the best histogram entropy method based on Genetic Algorithm improved (KSW-GA), dual thresholds Otsu (D-OTUS) and RTC. Which the unchanged pixels are 128, and 0 and 255 represent the backscatter enhanced and weakened regions in the proposed method, respectively. Figure 5(c) also shows that the backscatter enhanced region is small which has also reflected in figure 3(b). Moreover, in figure 5(a) and (b), the dual thresholds may not segment the backscatter enhanced and weakened regions.
(a) (b) (c) Figure 5. Change images generated by difference dual thresholds selection methods on Bern. (a) KSW-GA. (b)
D-OTSU. (c) RTC.
Figure 6(a), 6(b) and 6(c) show the change images are only divided into unchanged or changed class whatever backscatter weakened or enhanced, 0 and 255 represent the unchanged and changed pixels, respectively.
(a) (b) (c) Figure 6. Change images which the backscatter enhanced and weakened regions are both classified as the changed regions on
Bern. (a) KSW-GA. (b) D-OTSU. (c) RTC.
To compare the proposed method to other methods, the backscatter enhanced and weakened pixels are both regarded as the change pixels, and compared with KSW-GA and D-OTSU through the false alarms (FA), missed alarms (MA), percentage correct classification (PCC) as equation (18) and the kappa coefficients as equation (19).
FA: the unchanged pixels in ground truth incorrectly classified the changed pixels in the change detection result.
MA: the changed pixels in ground truth incorrectly classified the unchanged pixels in the change detection result.
PCC =� − �� − ��
� (18)
where S = the number of the pixels in image
kappa =��� − ��
1− �� (19)
where Pc is shown in equation (20)
Pc = (�0∗ �0+�1∗ �1)
�2 (20)
where �0,�1 = the number of changed and unchanged pixels in ground truth
�0,�1 = the number of changed and unchanged pixels in the change detection result by the test methods
The result is list in Table 1, shows that besides the FA is worse, the RTC in MA, PCC and Kappa coefficients are all better than the other two methods.
Methods FA MA PCC Kappa
KSW-GA 0.015% 0.491% 99.49% 0.753
D-OTSU 0.014% 0.525% 99.46% 0.733
TRC 0.153% 0.168% 99.68% 0.872
Table 1. Comparison of change detection results on Bern.
3.2. Beijing Data Set
The second data set is made up of two images acquired by airborne SAR sensor over Beijing, China, on 4 April and 6 April 2004 respectively and a ground-truth image as reference image with photo interpretation, from the ground-truth, it is easy to find that the ground changed owing to the vehicles positions as shown in Figure 7(a), (b) and (c). They are all 900×900 pixels.
(a) (b) (c) Figure 7. Multi-temporal images of Beijing. (a) Master image.
(b) Slave image. (c) Ground-truth.
The 3×3 window is instead the homogenous region and the difference image have been also normalized to 0-255. Before the threshold selection, a 7×7 median filter has been done on the difference image to reduce the errors brought by the low registration precision, Figure 8(a) shows the difference image. From the curve shown in Figure 8(b), a steep peak is clearly shown and on both sides beside it, the curve presents an oscillating state and ratio values fluctuate randomly, which means that there are both backscatter enhanced and weakened regions in the difference image.
(a) (b)
Figure 8. (a) Difference image generated by FDD on Beijing. (b) Curve about the ratio value of adjacent GL on Beijing
difference image.
Figure 9 shows that the lower and upper thresholds selected are 84 and 97, the values lower than 84 represent the backscatter enhanced regions, those between 84 and 97 represent the unchanged regions and higher than 97 represent the backscatter weakened regions.
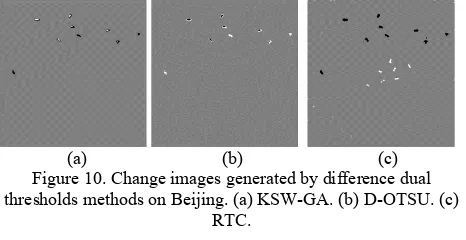
Figure 10(a), (b) and (c) show the change images segmented by the KSW-GA, D-OTSU and TRC. Through these figures, the RTC has a better performance than the other two methods obviously, which that two can only detect the single change type. The same to the data set 1, 0, 128 and 255 represent the regions of backscatter enhanced, unchanged and backscatter weakened separately in the change images.
(a) (b) (c) Figure 10. Change images generated by difference dual thresholds methods on Beijing. (a) KSW-GA. (b) D-OTSU. (c)
RTC.
Figure 11(a), (b) and (c) show the change images are only divided into two class which the rules are same to the data set1 used.
(a) (b) (c) Figure 21. Change images which the backscatter enhanced and weakened regions are both classified as the changed regions on
Beijing data set. (a) KSW-GA. (b) D-OTSU. (c) RTC.
By compared the proposed method with KSW-GA and D-OTSU through the FA, MA, PCC and Kappa coefficients. The result is list in Table 2, shows that besides the FA caused by the low registration precision is worse, the RTC in MA, PCC and Kappa coefficients are all better than the others, which others may not find the regions that caused by one of the change type.
Methods FA MA PCC Kappa
KSW-GA 0.02% 0.305% 99.67% 0.604
D-OTSU 0.043% 0.277% 99.68% 0.634
TRC 0.114% 0.120% 99.77% 0.787
Table 2. Comparison of detection results on Beijing.
4. CONCLUSION
In this letter, a change detector FDD constructed by the LR and LLR has been proposed, which the difference image generated has a good performance in visual effect and the anti-noise ability. Then by using the difference image above, a dual thresholds selection method named TRC based on the curve about the ratio value of adjacent grey-level is provide. Through the experiments on different areas and sensors, the proposed method not only identify the change regions between the two images precisely but also can discriminate the change regions whether backscatter weakened or enhanced.
REFERENCES:
Bovolo, F. and Bruzzone, L., 2007. A Split-Based Approach to Unsupervised Change Detection in Large-Size Multitemporal
Images: Application to Tsunami-Damage Assessment. IEEE
Transactions on Geoscience and Remote Sensing, 45(6), pp. 1658-1670.
Bruzzone, L. and Serpico, S.B., 1997. An iterative technique for the detection of land-cover transitions in multitemporal remote-sensing images. IEEE Transactions on Geoscience & Remote Sensing, 35(4), pp. 858-867.
Dempster, A.P., Laird, N.M. and Rdin, D.B., 1977. Maximum Likelihood from Incomplete Data via the EM Algorithm. Journal of the Royal Statistical Society, 39(1), pp. 1-38.
Di Martino, G., Iodice, A., Riccio, D. and Ruello, G., 2007. A Novel Approach for Disaster Monitoring: Fractal Models and Tools. IEEE Transactions on Geoscience and Remote Sensing, 45(6), pp. 1559-1570.
Gao C S, Zhang H, Wang C and Wu F, 2010. SAR change detection based on generalized Gamma distribution divergence and auto-threshold segmentation. Journal of Remote Sensing,
14(4), pp. 710—724.
Gong, M., Cao, Y. and Wu, Q., 2012. A Neighborhood-Based Ratio Approach for Change Detection in SAR Images. IEEE Geoscience and Remote Sensing Letters, 9(2), pp. 307-311.
Gong M, Li Y, Jiao L, et al., 2014. SAR change detection based
on intensity and texture changes [J]. Isprs Journal of
Photogrammetry & Remote Sensing, 93(93), pp. 123-135.
Inglada, J. and Mercier, G., 2007. A New Statistical Similarity Measure for Change Detection in Multitemporal SAR Images
and Its Extension to Multiscale Change Analysis. IEEE
Transactions on Geoscience and Remote Sensing, 45(5), pp. 1432 - 1445.
Kapur, J.N., Sahoo, P.K. and Wong, A.K.C., 1985. A new method for gray-level picture thresholding using the entropy of the histogram. Computer Vision Graphics & Image Processing, 29(3), pp. 273-285.
Kittler, J. and Illingworth, J., 1986. Minimum error thresholding.
Pattern Recognition, 19(1), pp. 41-47.
Lakshmi, S.V., Sathyamoorthy, K. and Kumar, T.K.S., 2015. An Unsupervised Change Detection in Satellite IMAGES Using
MRFFCM Clustering. International Journal of Computer
Applications Technology & Research, 4(4), pp. 214-219.
OLIVER, C. and QUEGAN, S., 2004, Understanding Synthetic Aperture Radar Images, 2nd Ed. SciTech Publishing Inc, pp.83-84.
Otsu, N., 1979. Threshold Selection Method from Gray-Level
Histograms. IEEE Transactions on Systems Man and
Cybernetics, 9(1), pp. 62-66.