7
(Evidence from Liquidity 45 Stocks Listed in Indonesia Stock Exchange)
Liem Pei Fun and Sautma Ronni Basana Faculty of Economics, Petra Christian University
Jl. Siwalankerto 121−131 Surabaya 60236 E-mail: pfun@peter.petra.ac.id; sautman@peter.petra.ac.id
Abstract
Stocks with low PE ratio are perceived as having cheaper current price hence expected to generate higher return in subsequent period. This paper aimed to examine stocks with high PE Ratio followed by low stocks return and on the contrary. Using stocks which are included as member of Liquidity 45 in period 2005-2010 as samples Results showed that there is signifi-cance difference between low PE and high PE portfolio stock return in short term (holding pe-riod of six months) but there is no significance difference if they are hold for one, two, three, and four years. This research also finds that there is no significant relationship between stock return and trailing PE Ratio.
Keywords: Price to earnings ratio, stock selection, stocks return
Abstrak
Saham dengan PE Ratio rendah dianggap memiliki harga saat ini yang murah sehingga diharapkan memperoleh return tinggi pada periode berikutnya. Penelitian ini bertujuan untuk menguji apakah saha m dengan PE Ratio yang tinggi akan diikuti dengan return saham yang rendah pada periode berikutnya dan sebaliknya. Penelitian ini menggunakan saham-saham yang tergabung dalam Likuiditas 45 selama periode 2005−2010 sebagai sampel. Hasil penelitian menunjukkan bahwa terdapat perbedaan signifikan antara return portofolio saham dengan PE Ratio apabila portofolio ditahan untuk jangka pendek (enam bulan) tetapi tidak ada perbedaan yang signifikan apabila ditahan untuk satu, dua, tiga, dan empat tahun. Penelitian ini juga menemukan bahwa tidak ada hubungan yang signifikan antara return sa-ham dan trailing PE Ratio.
Kata Kunci: Price to earnings ratio, pemilihan saham, return saham
INTRODUCTION
Price to Earnings (PE) Ratio has been exten-sively used by financial (securities) analysts and investors as an investment tool to pick which stocks to be bought. PE Ratio gains popularity among securities analysts and investors since it is easy to calculate and understand. Thus far, many securities analysts, particularly in Indonesia, rec-ommend investors to buy certain stocks if their PE Ratio is low compared to their counterparts. Stock with low PE ratio is perceived as having cheaper current price hence expected to generate higher return in subsequent period.
Some researches support this PE Ratio hy-pothesis. Using NYSE common stocks as sample of analysis, Basu (1977, 1983) confirmed by Jaffe et al. (1989) found that stocks with high (low) PE ratios generate lower (higher) returns. Tseng (1988) conclude that low PE ratio portfo-lios are found to have higher risk adjusted return than high PE ratio portfolios. Trevino & Robert-son (2002), using US stock market data, found that current PE ratios are useful in estimating long-term average stock returns but not for short-term average stock returns.
stock return. Ahmed (2003) found that there is no sig-nificant relationship between yearly return of S&P 500 Index and PE Ratio. Asri (2002a, 2002b) tested the existence of low PE Ratio effects in Indonesia stock market using 267 stocks listed in Jakarta Stock Exchange and selected the period of 1994−2000 as the focus of analysis. He found that low PE effect does not exist in Indonesian market. However, his finding about the non existence of low PE effect could be caused by illiquid stocks categorized in low PE portfolio. Illiquidity issue is the biggest shortcoming of his research.
Mixed result of the relationship between PE Ratio and stock return and the shortcoming of pre-vious research motivate author to carry out this research in Indonesia stock market using Liquidity 45 stocks listed in Indonesia Stock Exchange (IDX) as sample. Since Liquidity 45 stocks are used instead of all stocks listed in IDX, this research does not suffer from illiquidity stocks concerned in previous research. Results of this study can be used by securities analysts and investors for their investing strategy. If low PE Ratio investing strategy works in Indonesia stock market, investors could earn systematically above average return by investing in liquid stocks with low PE Ratio. Therefore this paper attempts to analyze whether stocks with high PE Ratio followed by low stock return and on the contrary, stocks with low PE Ratio followed by high stock return. This study can indicate the predictability of stock return using PE Ratio by examining historical relationship between PE Ratio and subsequent stock return.
LITERATURE REVIEW
PE Ratio is widely used and recognized by securities analysts and investors for common stocks valuation. Basically, PE Ratio can be calculated by dividing stock price per share with its earnings per share. However there are two main variations of PE Ratio, based on the way it is calculated, which are trailing (current) PE and leading (forward) PE. The usage of most recent four quarter or past 12 months EPS in the denominator resulting in trailing PE while the usage of next year expected EPS in the denomi-nator resulting in leading PE. For the purpose of prediction, the usage of forecasted EPS (usually based
on analysts’ consensus estimates) is preferable than
most recent four quarter or past 12 month EPS. However, unlikely for listed companies in US stock
exchange which their analysts’ earnings growth rate forecasts can be obtained from I/B/E/S database, there is no database which provide those information in
Indonesia. Therefore, this research uses EPS as reported in company audited financial statements. Using Gordon Growth Dividend Discount Model, PE Ratio can be calculated as follows:
0 0 0
0 (1 )/
E
g r g D
E
P
(1)
which can be rearranged to,
g r
g E
D E P
0/ 0 (1 )
0 0
(2)
From the model above, we know that funda-mental factors affecting PE Ratio are dividend payout ratio (
D
0/ E
0), expected constant dividend growth rate (g), and stock’s required rate of return (r) which reflecting its risk. From the equation, it can be seen that dividend payout ratio and expected growth rate have positive relationship with PE Ratio while stock’s required rate of return has inverse relationship to PE Ratio. Holding all else constant: 1) the higher the divi-dend payout ratio (D
0/ E
0), the higher the PE ratio, 2) the higher the expected growth rate (g), the higherthe PE Ratio, and 3) the higher the stock’s required
rate of return (r), the lower the PE Ratio. From this relationship, therefore, stocks with high PE Ratio
often called “growth stocks” since the higher the
expected growth rate, the higher the PE Ratio while
stocks with low PE Ratio often called “value stocks”.
Damodaran (2006) states that other things held equal, higher growth firms will have higher PE ratios than lower growth firms. Other things held equal, higher risk firms will have lower PE ratios than lower risk firms and other things held equal, firms with lower reinvestment needs will have higher PE ratios than firms with higher reinvestment rates. However, he also reminds that other things are difficult to hold equal since high growth firms tend to have risk and high reinvestment rates.
com-pared to their counterparts because they are perceived to be undervalued relative to their counterparts.
According to the mispricing view, there is an inverse relation between PE ratio and portfolio stock returns. Specifically, stocks with low PE ratios earn significantly higher returns than stocks with high PE ratios suggesting that an investor could earn higher returns by investing in low PE ratio portfolios. Basu (1977) introduced this proposition and carried out empirical research to test the hypothesis. Using NYSE industrial firms in the period of September
1956 −August 1971, he found that low PE Ratio port-folios earn superior risk adjusted returns. Basu (1983) enhanced his previous research and found that high Earnings Price (low PE) stocks earned significantly greater risk adjusted returns even after controlling for firm size. Tseng (1988) and Jaffe et al. (1989) found similar results which show that low PE ratio portfolios have higher risk adjusted return than high PE ratio portfolios. Fama & French (1992) also found positive abnormal returns related with low PE stocks. Trevino & Robertson (2002) examine the relationship bet-ween current PE ratios and subsequent stock market average returns using US stock market data. Their findings indicate that PE ratios are not useful in predicting short term returns but useful in estimating long-term average stock returns. In emerging equity markets, Aydogan & Gursoy (2000) conclude that the relationship between Earnings Price Ratio (EP), PBV, and future returns has low explanatory power in the models estimated.
On the contrary, some studies find that there is no significant relationship between PE Ratio and stock return. Ahmed (2003) performed regression analyses between PE Ratio and yearly stock returns from S&P 500 index in periods 1992−2001 and 1983
−2001 to examine correlation between both variables. He found that PE Ratio does not have significant relationship with yearly return both before and after risk-adjusted scenarios. Asri (2002a, 2002b) scruti-nized the existence of low PE Ratio effects in Indonesia stock market using 267 stocks listed in Jakarta Stock Exchange and selected the period of 1994 −2000 as the focus of analysis. He found that low PE effect does not exist in Indonesian market. However, his finding about the non existence of low PE effect could be caused by illiquid stocks categorized in low PE portfolio.
RESEARCH METHODOLOGY
This research uses Liquidity 45 stocks listed in Indonesia Stock Exchange (IDX) as sample. PE Ratio
is calculated by dividing current stock price with earnings per share. This research use Earnings Per Share (EPS) as reported in the audited financial statement. The dependent variable in this research is average holding period return while the independent variable is PE Ratio. quintile are categorized as stocks with high PE Ratio while stocks in one third of bottom quintile are categorized as stocks with low PE Ratio.
Descriptive statistics and ANOVA are carried out to examine whether subsequent low PE stock portfolio return is significantly different with high PE stock portfolio return. Paired sample t test is employ-ed to examine mean difference between subsequent low PE stock portfolio return and high PE stock port-folio return for various holding period (six months, one, two, three, and four years). Null hypothesis and alternative hypothesis for tests of mean difference are as follows: and stock return is carried out to examine the relationship between both variables. The linear regression model is:
0
b
= intercept of regression line1
b
= slope (coefficients) of regression linei
X = PE Ratios
i
= error termOrdinary Least Squared (OLS) regression is employed to estimate the intercept and slope that minimize sum squared errors. OLS assumes that errors have zero mean, constant variance (homoscedastici-ty), are uncorrelated with each other and normally distributed. These OLS assumptions are tested before interpreting the results.
RESULTS AND ANALYSIS
Stocks which are included as member of Liqui-dity (LQ) 45 in the period August 2005−January 2006 are sort based on their calculated PE Ratio. The period of August 2005−January 2006 is deliberately chosen because this paper attempt to examine short term (holding period of six months and one year) and long term (holding period for two, three, and four years) subsequent portfolio stock return.
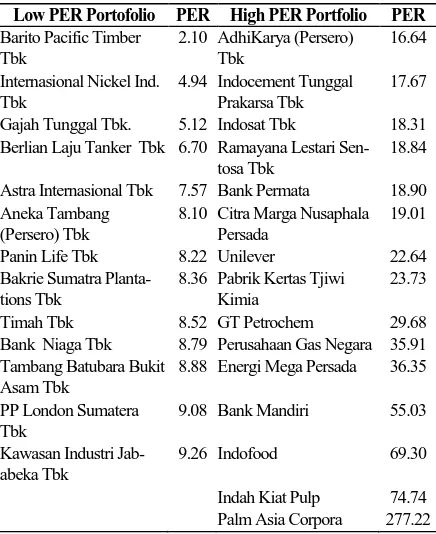
Table 1. Low and High PER Portfolio
Low PER Portofolio PER High PER Portfolio PER
Barito Pacific Timber Tbk
2.10 AdhiKarya (Persero) Tbk
16.64
Internasional Nickel Ind. Tbk
4.94 Indocement Tunggal Prakarsa Tbk
17.67
Gajah Tunggal Tbk. 5.12 Indosat Tbk 18.31
Berlian Laju Tanker Tbk 6.70 Ramayana Lestari Sen-tosa Tbk
18.84
Astra Internasional Tbk 7.57 Bank Permata 18.90
Aneka Tambang (Persero) Tbk
8.10 Citra Marga Nusaphala Persada
19.01
Panin Life Tbk 8.22 Unilever 22.64
Bakrie Sumatra Planta-tions Tbk
8.36 Pabrik Kertas Tjiwi Kimia
23.73
Timah Tbk 8.52 GT Petrochem 29.68
Bank Niaga Tbk 8.79 Perusahaan Gas Negara 35.91 Tambang Batubara Bukit
Asam Tbk
8.88 Energi Mega Persada 36.35
PP London Sumatera Tbk
9.08 Bank Mandiri 55.03
Kawasan Industri Jab-abeka Tbk
9.26 Indofood 69.30
Indah Kiat Pulp 74.74
Palm Asia Corpora 277.22
Source: IDX, 2006
After calculating and rank 45 stocks based on their PE Ratio, stocks in one third of top quintile are categorized as stocks with high PE Ratio while stocks in one third of bottom quintile are categorized as
stocks with low PE Ratio. In other words, there are 15 stocks in low PE portfolios and 15 stocks in high PE portfolios while 15 stocks with moderate are not used because the focus of this research is for contrasting low PE portfolio and high PE portfolio. However, there are two companies (Semen Cibinong Tbk. and Jakarta International Hotel & Development Tbk.) which are excluded from low PER portfolio because their Earnings Per Share (EPS) and corresponding PER are negative. Negative PER are not really mean-ingful for the analysis therefore low PER portfolio only consist of 13 stocks. Table 1 shows list of com-panies included in low PE portfolio and high PE port-folio with their corresponding PE Ratio.
Return of Low and High PER Stocks
Buy and hold approach during observation period is taken to calculate short term returns (holding period of six months) and long term returns (holding period of one, two, three, and four years). Buy and hold approach means that after buying low PE stocks, investors hold them for certain period of time (six months, one, two, three, and four years), not buying and selling every month. Table 2 shows subsequent holding period six months, one, two, three, and four years returns for individual stocks classified in low PE portfolio.
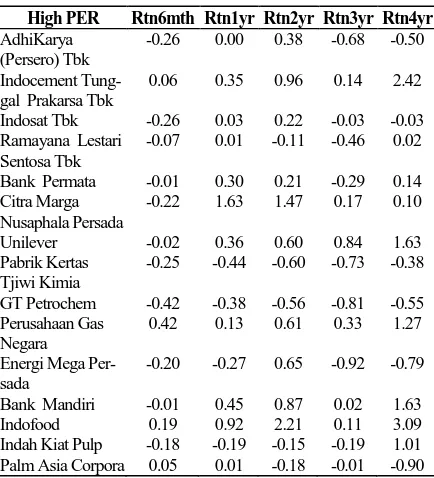
Table 3 shows following holding period six months, one, two, three, and four years returns for individual stocks categorized in high PE portfolio.
Table 4 below shows average (mean) return of low and high PE stocks portfolio. For calculating portfolio return, it is assumed that investors are investing the same amount of money on each stock inside the portfolio (weighted average). From Table 4, it can be seen that average stock return in low PE portfolio is higher than average stock return in high PE portfolio for all holding period (six months, one, two, three, and four years). In a glance, it seems that investing in low PE stocks generate higher subsequent returns than investing in high PE stocks.
However, after tested for mean difference using paired sample t test with α = 0.05, it is found that only six months holding period return of low PE portfolio which significantly different from high PE portfolio. There are no significance difference between low PE and high PE portfolio stock return in long term (holding period of one, two, three, and four years).
Table 2. Low-PER and Return
Low PER Rtn6mth Rtn1yr Rtn2yr Rtn3yr Rtn4yr
Barito Pacific Timber
Table 3. High-PER and Return
High PER Rtn6mth Rtn1yr Rtn2yr Rtn3yr Rtn4yr
In the next stage, linear regression between PE Ratio and portfolio stock returns (for holding period of six months, one, two, three, and four years) are carried out to examine the relationship between both variables. Ordinary Least Squared (OLS) regression is employed to estimate the intercept and slope of PE Ratio for each holding period portfolio return that minimize sum squared errors. This is done to determine whether PE Ratio is a significant factor to predict stock returns in the future, both for short term (six months) and long term (one, two, three, and four
years) holding period. There are no violations on OLS assumptions that errors have zero mean, constant variance (homoscedastic), are uncorrelated with each other and normally distributed. Therefore, we can continue to the results interpretation. Results from OLS regression are shown in the Table 5.
Results from the regression between portfolio
stock return and PE Ratio revealed that both in low PE and high PE portfolios, PE Ratio parameter is not significant at each holding period return. The PE Ratio coefficient is very small, nears zero, and insig-nificant. It shows that there is no significant relation-ship between (trailing or current) PE Ratio and stock return. Moreover, R-squared or coefficient of deter-mination from the regression is small which indicate that variation in stock returns cannot be explained well by variation in PE Ratio. Many others factors besides PE that contribute to stock returns.Table 4. Short-term and Long-term Return of Low & High PER Portfolio Short and Long term Return
Rtn6mth Rtn1yr Rtn2yr Rtn3yr Rtn4yr Low-PER
Bodie et al. (2008) states that riskier firms will have higher required rate of return hence their PE Ratio will be lower. In other words, stocks with low PE Ratio is not necessary a good bargain since their PE Ratio could be lower simply because they are riskier firm and hence investors demand higher required rate of return. Low PE Ratio stock does not necessarily mean that its current price is cheap or undervalued hence does not necessarily generate higher return in the subsequent period.
Investors need to carefully examine the driver or fundamental factors affecting PE Ratio of particular companies that they want to invest in instead of just following common investing strategy by investing in low PE Ratio stocks. Before deciding whether par-ticular stock is over or undervalued, investors need to examine differences between firms that may affect the PE Ratio. Results of this study also entail investors to consider other fundamental factors of companies instead of just looking at their PE Ratios.
CONCLUSION
In Indonesia, investing in low PE Ratio stocks has been common investment strategy followed by investors. Stock with low PE ratio is perceived as having cheaper current price hence expected to gene-rate higher return in subsequent period. Using stocks which are included as member of Liquidity 45 in Indonesia Stock Exchange with observation period
2005−2010 as samples, findings show that there is significance difference between low PE and high PE portfolio stock return in short term (holding period of six months) but there is no significance difference bet-ween both portfolio stock return if they are hold for one, two, three, and four years. This finding provides a signal for investors to invest in low PE stocks for short-term time horizon (six months) in order to realize the benefits (profit taking).
When it is processed further using regression analysis to determine whether PE Ratio is a signi-ficant factor to predict stock returns in the future, both for short term (six months) and long term (one, two, three, and four years) holding period, results show that there is no significant relationship between stock return and (trailing) PE Ratio. This finding implies that (trailing) PE Ratio is not useful in estimating both short term and long term stock returns which suggests that investors can not earn systematically above average return by investing in liquid stocks with low PE Ratio. This research uses Earnings Per Share
(EPS) as reported in the company’s audited financial
statement. For further research, the usage of normalized EPS (exclude extraordinary items from earnings) or estimate EPS instead of reported
EPS could be explored. This research could be extended in term of period of analyses, portfolio rebalancing, and other independent variables or research methodologies. Decomposition of PE Ratio into a fundamental component and a mispriced component can be carried out to gain deeper under-standing and more useful investment tools for investment strategy.
REFERENCES
Ahmed, M. 2003. The Performance of Common Stocks in Rela tion to Their P /E Ratio. Unpublished Thesis. University of Nevada. Asri, M. 2002a. Price Earnings Ratio Model
Consis-tency: Evidence from Jakarta Stock Exchange.
Bunga Rampai Kajian Teori Keuangan, 613
−625.
______. 2002b. Re-examining the Existence of Low Price-Earnings Ratio Effects. Bunga Rampai Kajian Teori Keuangan.
Aydogan, K. & Gursoy, G. 2000. P/E and Price-To-Book Ratios as Predictors of Stock Returns in Emerging Equity Markets. Emerging Markets Quarterly, 4(4): 60−67.
Basu, S. 1977. Investment Performance of Common Stocks in Relation to Their Price-Earnings Ratios: A Test of the Efficient Market Hypo-thesis. Journal of Finance, 32(3): 663−682.
_______. 1983. The Relationship between Earnings’
Yield, Market Value and Return for NYSE Common Stocks: Further Evidence. Journal of Financial Economics, 12(1): 129−156.
Bodie, Z., Kane, A., & Marcus, A. J. 2008. Invest-ments. New York: McGraw−Hill.
Damodaran, A. 2006. Damodaran on Valuation. Second Edition. New York: John Wiley & Sons Inc.
Fama, E. & French, K. R. 1992. The Cross−Section
of Expected Stock Returns. J our na l of Finance. 47(2): 427−465.
IDX. 2006. IDX Annual Statistics (diakses Nopember 2012 dari http://www.idx.co.id/en-us/home/publi-cation/statistic.aspx.
Jaffe, J., Keim, D. B., & Westerfield, R. 1989. Earnings Yields, Market Values, and Stock Returns.
Journal of Finance, 44(1): 135−148.
Stowe, J. D., Robinson, T. R., Pinto, J. E., & McLeavey, D. W. 2007. Equity Asset Valuation. New York: John Wiley & Sons Inc.
Trevino, R. & Robertson., F. 2002. P/E Ratios and Stock Market Returns. Journal of Financial Planning, 15(2): 76−84.
Tseng, K. C. 1988. Low Price, Price−Earnings Ratio, Market Value, and Abnormal Stocks Return.