Red Hat Linux 9
Red Hat, Inc.
1801 Varsity Drive Raleigh NC 27606-2072 USA Phone: +1 919 754 3700 Phone: 888 733 4281 Fax: +1 919 754 3701 PO Box 13588
Research Triangle Park NC 27709 USA
rhl-sap(EN)-9-Print-RHI (2003-02-20T01:08)
Copyright © 2003 by Red Hat, Inc. This material may be distributed only subject to the terms and conditions set forth in the Open Publication License, V1.0 or later (the latest version is presently available at http://www.opencontent.org/openpub/). Distribution of substantively modified versions of this document is prohibited without the explicit permission of the copyright holder.
Distribution of the work or derivative of the work in any standard (paper) book form for commercial purposes is prohibited unless prior permission is obtained from the copyright holder.
Red Hat, Red Hat Network, the Red Hat "Shadow Man" logo, RPM, Maximum RPM, the RPM logo, Linux Library, PowerTools, Linux Undercover, RHmember, RHmember More, Rough Cuts, Rawhide and all Red Hat-based trademarks and logos are trademarks or registered trademarks of Red Hat, Inc. in the United States and other countries.
Linux is a registered trademark of Linus Torvalds.
Motif and UNIX are registered trademarks of The Open Group.
Intel and Pentium are a registered trademarks of Intel Corporation. Itanium and Celeron are trademarks of Intel Corporation. AMD, AMD Athlon, AMD Duron, and AMD K6 are trademarks of Advanced Micro Devices, Inc.
Netscape is a registered trademark of Netscape Communications Corporation in the United States and other countries. Windows is a registered trademark of Microsoft Corporation.
SSH and Secure Shell are trademarks of SSH Communications Security, Inc. FireWire is a trademark of Apple Computer Corporation.
All other trademarks and copyrights referred to are the property of their respective owners. The GPG fingerprint of the [email protected] key is:
Introduction... i
1. Changes to This Manual ... i
2. Document Conventions ... i
3. More to Come ... iv
3.1. Send in Your Feedback ... iv
4. Sign Up for Support ... iv
1. The Philosophy of System Administration ... 1
1.1. Automate Everything ... 1
1.2. Document Everything ... 2
1.3. Communicate as Much as Possible... 3
1.3.1. Tell Your Users What You Are Going to Do ... 3
1.3.2. Tell Your Users What You Are Doing ... 4
1.3.3. Tell Your Users What You Have Done ... 4
1.4. Know Your Resources... 5
1.5. Know Your Users ... 6
1.6. Know Your Business... 6
1.7. Security Cannot be an Afterthought ... 6
1.7.1. The Risks of Social Engineering... 7
1.8. Plan Ahead ... 7
1.9. Expect the Unexpected ... 8
1.10. In Conclusion. . . ... 8
1.11. Red Hat Linux-Specific Information ... 8
1.11.1. Automation ... 8
1.11.2. Documentation and Communication ... 9
1.11.3. Security ... 10
1.12. Additional Resources ... 10
1.12.1. Installed Documentation ... 10
1.12.2. Useful Websites ... 12
1.12.3. Related Books ... 12
2. Resource Monitoring ... 15
2.1. Basic Concepts... 15
2.2. System Performance Monitoring ... 15
2.3. Monitoring System Capacity ... 16
2.4. What to Monitor?... 16
2.4.1. Monitoring CPU Power ... 17
2.4.2. Monitoring Bandwidth... 18
2.4.3. Monitoring Memory... 18
2.4.4. Monitoring Storage ... 19
2.5. Red Hat Linux-Specific Information ... 20
2.5.1.free... 20
2.5.2.top... 21
2.5.3.vmstat... 22
2.5.4. The Sysstat Suite of Resource Monitoring Tools ... 23
2.6. Additional Resources ... 26
2.6.1. Installed Documentation ... 27
2.6.2. Useful Websites ... 27
3.1.1. Buses ... 29
3.1.2. Datapaths... 30
3.1.3. Potential Bandwidth-Related Problems ... 30
3.1.4. Potential Bandwidth-related Solutions ... 30
3.1.5. In Summary. . . ... 31
3.2. Processing Power ... 32
3.2.1. Facts About Processing Power... 32
3.2.2. Consumers of Processing Power... 32
3.2.3. Improving a CPU Shortage ... 33
3.3. Red Hat Linux-Specific Information ... 36
3.3.1. Monitoring Bandwidth on Red Hat Linux ... 36
3.3.2. Monitoring CPU Utilization on Red Hat Linux... 37
3.4. Additional Resources ... 41
3.4.1. Installed Documentation ... 41
3.4.2. Useful Websites ... 41
3.4.3. Related Books ... 42
4. Physical and Virtual Memory ... 43
4.1. Storage Access Patterns ... 43
4.2. The Storage Spectrum... 43
4.2.1. CPU Registers ... 44
4.2.2. Cache Memory... 44
4.2.3. Main Memory — RAM ... 45
4.2.4. Hard Drives ... 46
4.2.5. Off-Line Backup Storage ... 47
4.3. Basic Virtual Memory Concepts ... 47
4.3.1. Virtual Memory in Simple Terms ... 47
4.3.2. Backing Store — the Central Tenet of Virtual Memory ... 48
4.4. Virtual Memory: the Details ... 48
4.4.1. Page Faults ... 49
4.4.2. The Working Set ... 49
4.4.3. Swapping... 50
4.5. Virtual Memory Performance Implications ... 50
4.5.1. Worst Case Performance Scenario... 50
4.5.2. Best Case Performance Scenario ... 51
4.6. Red Hat Linux-Specific Information ... 51
4.7. Additional Resources ... 54
4.7.1. Installed Documentation ... 54
4.7.2. Useful Websites ... 54
4.7.3. Related Books ... 54
5. Managing Storage ... 57
5.1. An Overview of Storage Hardware... 57
5.1.1. Disk Platters ... 57
5.1.2. Data reading/writing device ... 57
5.1.3. Access Arms ... 58
5.2. Storage Addressing Concepts ... 59
5.2.1. Geometry-Based Addressing ... 59
5.2.2. Block-Based Addressing... 60
5.3. Mass Storage Device Interfaces ... 60
5.3.1. Historical Background ... 61
5.3.2. Present-Day Industry-Standard Interfaces ... 62
5.4. Hard Drive Performance Characteristics ... 64
5.4.1. Mechanical/Electrical Limitations ... 64
5.5.1. Partitions/Slices... 67
5.5.2. File Systems ... 69
5.5.3. Directory Structure... 71
5.5.4. Enabling Storage Access... 71
5.6. Advanced Storage Technologies ... 72
5.6.1. Network-Accessible Storage... 72
5.6.2. RAID-Based Storage ... 73
5.7. Storage Management Day-to-Day ... 78
5.7.1. Monitoring Free Space... 78
5.7.2. Disk Quota Issues ... 80
5.7.3. File-Related Issues ... 81
5.7.4. Adding/Removing Storage... 82
5.8. A Word About Backups. . . ... 88
5.9. Red Hat Linux-Specific Information ... 88
5.9.1. Device Naming Conventions ... 88
5.9.2. File System Basics ... 89
5.9.3. Mounting File Systems ... 91
5.9.4. Network-Accessible Storage Under Red Hat Linux ... 94
5.9.5. Mounting File Systems Automatically with/etc/fstab... 95
5.9.6. Monitoring Disk Space ... 95
5.9.7. Adding/Removing Storage... 97
5.9.8. Implementing Disk Quotas ... 101
5.9.9. Creating RAID Arrays ... 105
5.9.10. Day to Day Management of RAID Arrays ... 106
5.10. Additional Resources ... 107
5.10.1. Installed Documentation ... 107
5.10.2. Useful Websites ... 108
5.10.3. Related Books ... 108
6. Managing User Accounts and Resource Access ... 109
6.1. Managing User Accounts... 109
6.1.1. The Username ... 109
6.1.2. Passwords... 112
6.1.3. Access Control Information... 116
6.1.4. Managing Accounts and Resource Access Day-to-Day ... 117
6.2. Managing User Resources ... 119
6.2.1. Who Can Access Shared Data ... 119
6.2.2. Where Users Access Shared Data... 120
6.2.3. What Barriers Are in Place To Prevent Abuse of Resources ... 121
6.3. Red Hat Linux-Specific Information ... 121
6.3.1. User Accounts, Groups, and Permissions ... 121
6.3.2. Files Controlling User Accounts and Groups ... 123
6.3.3. User Account and Group Applications ... 126
6.4. Additional Resources ... 127
6.4.1. Installed Documentation ... 128
6.4.2. Useful Websites ... 128
7.1.1. Printing Considerations... 131
7.2. Impact Printers ... 132
7.2.1. Dot-Matrix Printers ... 132
7.2.2. Daisy-wheel Printers ... 133
7.2.3. Line Printers... 133
7.2.4. Impact Printer Consumables ... 133
7.3. Inkjet Printers... 133
7.3.1. Inkjet Consumables... 134
7.4. Laser Printers ... 134
7.4.1. Color Laser Printers ... 134
7.4.2. Laser Consumables ... 135
7.5. Other Printer Types ... 135
7.6. Printer Languages and Technologies ... 136
7.7. Networked Versus Local Printers... 136
7.8. Red Hat Linux-Specific Information ... 137
7.9. Additional Resources ... 138
7.9.1. Installed Documentation ... 138
7.9.2. Useful Websites ... 139
7.9.3. Related Books ... 139
8. Planning for Disaster ... 141
8.1. Types of Disasters ... 141
8.1.1. Hardware Failures ... 141
8.1.2. Software Failures ... 146
8.1.3. Environmental Failures ... 149
8.1.4. Human Errors... 154
8.2. Backups... 158
8.2.1. Different Data: Different Backup Needs... 159
8.2.2. Backup Software: Buy Versus Build... 160
8.2.3. Types of Backups ... 161
8.2.4. Backup Media ... 162
8.2.5. Storage of Backups ... 164
8.2.6. Restoration Issues ... 164
8.3. Disaster Recovery ... 165
8.3.1. Creating, Testing, and Implementing a Disaster Recovery Plan... 166
8.3.2. Backup Sites: Cold, Warm, and Hot ... 167
8.3.3. Hardware and Software Availability... 167
8.3.4. Availability of Backups... 168
8.3.5. Network Connectivity to the Backup Site... 168
8.3.6. Backup Site Staffing ... 168
8.3.7. Moving Back Toward Normalcy... 168
8.4. Red Hat Linux-Specific Information ... 169
Welcome to theRed Hat Linux System Administration Primer.
TheRed Hat Linux System Administration Primercontains introductory information for new Red Hat Linux system administrators. It willnotteach you how to perform a particular task under Red Hat Linux; rather, it will provide you with the background knowledge that more experienced system administrators have learned over time.
This guide assumes you have a limited amount of experience as a Linux user, but no Linux system administration experience. If you are completely new to Linux in general (and Red Hat Linux in particular), you should start by reading theRed Hat Linux Getting Started Guide.
More experienced system administrators should skim theRed Hat Linux System Administration Primerfor overall concepts, and then concentrate on using theRed Hat Linux Customization Guide for assistance in performing specific tasks in a Red Hat Linux environment. Administrators requiring more in-depth, factual information should refer to theRed Hat Linux Reference Guide.
HTML and PDF versions of the Official Red Hat Linux manuals are available on the Red Hat Linux Documentation CD and online at http://www.redhat.com/docs/.
Note
Although this manual reflects the most current information possible, you should read theRed Hat Linux Release Notesfor information that may not have been available prior to our documentation being finalized. They can be found on the Red Hat Linux CD #1 and online at:
http://www.redhat.com/docs/manuals/linux
1. Changes to This Manual
This version of theRed Hat Linux System Administration Primerincludes the following changes: All chapters have been restructured to have three main sections:
• Generic overview material — This section discusses the topic of the chapter without going into details about to a specific operating system, technology, or methodology.
• Red Hat Linux-specific material — This section addresses aspects of the topic related to Linux in general and Red Hat Linux in particular.
• Additional resources for further study — This section includes pointers to other Red Hat Linux manuals, helpful websites, and books containing information applicable to the topic.
By adopting a consistent structure, readers can more easily read theRed Hat Linux System Adminis-tration Primerin whatever way they choose. For example, an experienced system administrator with little Red Hat Linux experience could skim only the sections that specifically focus on Red Hat Linux, while a new system adminstrator could start only with the generic overview sections.
2. Document Conventions
command
Linux commands (and other operating system commands, when used) are represented this way. This style should indicate to you that you can type the word or phrase on the command line and press [Enter] to invoke a command. Sometimes a command contains words that would be displayed in a different style on their own (such as filenames). In these cases, they are considered to be part of the command, so the entire phrase will be displayed as a command. For example: Use thecat testfilecommand to view the contents of a file, namedtestfile, in the current working directory.
filename
Filenames, directory names, paths, and RPM package names are represented this way. This style should indicate that a particular file or directory exists by that name on your Red Hat Linux system. Examples:
The.bashrcfile in your home directory contains bash shell definitions and aliases for your own use.
The/etc/fstabfile contains information about different system devices and filesystems. Install thewebalizerRPM if you want to use a Web server log file analysis program.
application
This style indicates that the program is an end-user application (as opposed to system software). For example:
UseMozillato browse the Web.
[key]
A key on the keyboard is shown in this style. For example:
To use [Tab] completion, type in a character and then press the [Tab] key. Your terminal will display the list of files in the directory that start with that letter.
[key]-[combination]
A combination of keystrokes is represented in this way. For example:
The [Ctrl]-[Alt]-[Backspace] key combination will exit your graphical session and return you to the graphical login screen or the console.
text found on a GUI interface
A title, word, or phrase found on a GUI interface screen or window will be shown in this style. When you see text shown in this style, it is being used to identify a particular GUI screen or an element on a GUI screen (such as text associated with a checkbox or field). Example:
Select theRequire Passwordcheckbox if you would like your screensaver to require a password before stopping.
top level of a menu on a GUI screen or window
When you see a word in this style, it indicates that the word is the top level of a pulldown menu. If you click on the word on the GUI screen, the rest of the menu should appear. For example: UnderFileon a GNOME terminal, you will see theNew Taboption that allows you to open multiple shell prompts in the same window.
Go toMain Menu Button(on the Panel) =>Programming=>Emacsto start theEmacstext editor.
button on a GUI screen or window
This style indicates that the text will be found on a clickable button on a GUI screen. For example: Click on theBackbutton to return to the webpage you last viewed.
computer output
When you see text in this style, it indicates text displayed by the computer on the command line. You will see responses to commands you typed in, error messages, and interactive prompts for your input during scripts or programs shown this way. For example:
Use thelscommand to display the contents of a directory:
$ ls
Desktop about.html logs paulwesterberg.png Mail backupfiles mail reports
The output returned in response to the command (in this case, the contents of the directory) is shown in this style.
prompt
A prompt, which is a computer’s way of signifying that it is ready for you to input something, will be shown in this style. Examples:
$
#
[stephen@maturin stephen]$
leopard login:
user input
Text that the user has to type, either on the command line, or into a text box on a GUI screen, is displayed in this style. In the following example,textis displayed in this style:
To boot your system into the text based installation program, you will need to type in thetext command at theboot:prompt.
Additionally, we use several different strategies to draw your attention to certain pieces of information. In order of how critical the information is to your system, these items will be marked as note, tip, important, caution, or a warning. For example:
Note
Remember that Linux is case sensitive. In other words, a rose is not a ROSE is not a rOsE.
Tip
Important
If you modify the DHCP configuration file, the changes will not take effect until you restart the DHCP daemon.
Caution
Do not perform routine tasks as root — use a regular user account unless you need to use the root account for system administration tasks.
Warning
If you choose not to partition manually, a server installation will remove all existing partitions on all installed hard drives. Do not choose this installation class unless you are sure you have no data you need to save.
3. More to Come
TheRed Hat Linux System Administration Primeris part of Red Hat’s growing commitment to pro-vide useful and timely support to Red Hat Linux users. As new releases of Red Hat Linux are made available, we make every effort to include both new and improved documentation for you.
3.1. Send in Your Feedback
If you spot a typo in theRed Hat Linux System Administration Primer, or if you have thought of a way to make this manual better, we would love to hear from you. Please submit a report in Bugzilla (http://bugzilla.redhat.com/bugzilla) against the component rhl-sap.
Be sure to mention the manual’s identifier:
rhl-sap(EN)-9-Print-RHI (2003-02-20T01:08)
If you mention this manual’s identifier, we will know exactly which version of the guide you have. If you have a suggestion for improving the documentation, try to be as specific as possible. If you have found an error, please include the section number and some of the surrounding text so we can find it easily.
4. Sign Up for Support
If you have an edition of Red Hat Linux 9, please remember to sign up for the benefits you are entitled to as a Red Hat customer.
You will be entitled to any or all of the following benefits, depending upon the Red Hat Linux product you purchased:
• Red Hat Network — Easily update your packages and receive security notices that are customized for your system. Go to http://rhn.redhat.com for more details.
• Under the Brim: The Red Hat E-Newsletter— Every month, get the latest news and product infor-mation directly from Red Hat.
To sign up, go to http://www.redhat.com/apps/activate/. You will find your Product ID on a black, red, and white card in your Red Hat Linux box.
To read more about technical support for Red Hat Linux, refer to theGetting Technical Support Ap-pendix in theRed Hat Linux Installation Guide.
The Philosophy of System Administration
Although the specifics of being a system administrator may change from platform to platform, there are underlying themes that do not. It is these themes that make up the philosophy of system adminis-tration.
Here are those themes:
• Automate everything • Document everything
• Communicate as much as possible • Know your resources
• Know your users • Know your business
• Security cannot be an afterthought • Plan ahead
• Expect the unexpected
Let us look at each of these themes in more detail.
1.1. Automate Everything
Most system administrators are outnumbered — either by their users, their systems, or both. In many cases, automation is the only way to keep up. In general, anything done more than once should be looked at as a possible candidate for automation.
Here are some commonly automated tasks:
• Free disk space checking and reporting • Backups
• System performance data collection
• User account maintenance (creation, deletion, etc.)
• Business-specific functions (pushing new data to a Web server, running monthly/quarterly/yearly reports, etc.)
This list is by no means complete; the functions automated by system administrators are only limited by an administrator’s willingness to write the necessary scripts. In this case, being lazy (and making the computer do more of the mundane work) is actually a good thing.
Automation also gives your users the extra benefit of greater predictability and consistency of service.
Tip
1.2. Document Everything
If given the choice between installing a brand-new server and writing a procedural document on performing system backups, the average system administrator would install the new server every time. While this is not at all unusual, the fact is that youmustdocument what you do. Many system administrators will put off doing the necessary documentation for a variety of reasons:
"I will get around to it later."
Unfortunately, this is usually not true. Even if a system administrator is not kidding themselves, the nature of the job is such that things are usually too chaotic to "do it later." Even worse, the longer it is put off, the more that is forgotten, leading to a much less detailed (and therefore, less useful) document.
"Why write it up? I will remember it."
Unless you are one of those rare individuals with a photographic memory, no, you will not remember it. Or worse, you will remember only half of it, not realizing that you are missing the full story. This leads to wasted time either trying to relearn what you had forgotten or fixing what you had broken due to not knowing the whole story.
"If I keep it in my head, they will not fire me — I will have job security!"
While this may work for a while, invariably it leads to less — not more — job security. Think for a moment about what may happen during an emergency. You may not be available; your documentation may save the day by letting someone else resolve the problem in your absence. And never forget that emergencies tend to be times when upper management pays close attention. In such cases, it is better to have your documentation be part of the solution than it is for your unavailability to be part of the problem.
In addition, if you are part of a small but growing organization, eventually there will be a need for another system administrator. How will this person learn to back you up if everything is in your head? Worst yet, not documenting may make you so indispensable that you might not be able to advance your career. You could end up working for the very person that was hired to assist you. Hopefully you are now sold on the benefits of system documentation. That brings us to the next question: What should you document? Here is a partial list:
Policies
Policies are written to formalize and clarify the relationship you have with your user community. They make it clear to your users how their requests for resources and/or assistance will be han-dled. The nature, style, and method of disseminating policies to your user community will vary from organization to organization.
Procedures
Procedures are any step-by-step sequence of actions that must be taken to accomplish a certain task. Procedures to be documented can include backup procedures, user account management procedures, problem reporting procedures, and so on. Like automation, if a procedure is followed more than once, it is a good idea to document it.
Changes
All of these changes should be documented in some fashion. Otherwise, you could find yourself being completely confused about a change you made several months earlier.
Some organizations use more complex methods for keeping track of changes, but in many cases a simple revision history at the start of the file being changed is all that is necessary. At a minimum, each entry in the revision history should contain:
• The name or initials of the person making the change • The date the change was made
• The reason the change was made This results in concise, yet useful entries:
ECB, 12-June-2002 -- Updated entry for new Accounting printer (to support the replacement printer’s ability to print duplex)
1.3. Communicate as Much as Possible
When it comes to your users, you can never communicate too much. Be aware that small system changes you might think are practically unnoticeable could very well completely confuse the admin-istrative assistant in Human Resources.
The method by which you communicate with your users will vary according to your organization. Some organizations use email; others, an internal website. Still others may rely on Usenet news or IRC. A sheet of paper tacked to a bulletin board in the breakroom may even suffice at some places. In any case, use whatever method(s) that work well at your organization.
In general, it is best to follow this somewhat-paraphrased approach used in writing newspaper stories:
1. Tell your users what you are going to do 2. Tell your users what you are doing 3. Tell your users what you have done Let us look at these three steps in more depth.
1.3.1. Tell Your Users What You Are Going to Do
Make sure you give your users sufficient warning before you do anything. The actual amount of warning will vary according to the type of change (upgrading an operating system demands more lead time than changing the default color of the system login screen), as well as the nature of your user community (more technically adept users may be able to handle changes more readily than users with minimal technical skills).
At a minimum, you should describe:
• The nature of the change • When it will take place • Why it is happening
• Approximately how long it should take
• The impact (if any) that the users can expect due to the change • Contact information should they have any questions or concerns
module to a faster model, and reboot. Once this is done, you will move the database itself to faster, RAID-based storage. Here is one possible announcement for this situation:
System Downtime Scheduled for Friday Night
Starting this Friday at 6pm (midnight for our associates in Berlin), all financial applications will be unavail-able for a period of approximately four hours.
During this time, changes to both the hardware and software on the Finance database server will be per-formed. These changes should greatly reduce the time required to run the Accounts Payable and Accounts Receivable applications, and the weekly Balance Sheet report.
Other than the change in runtime, most people will notice no other change. However, those of you that have written your own SQL queries should be aware that the layout of some indices will change. This is documented on the company intranet website, on the Finance page.
Should you have any questions, comments, or concerns, please contact System Administration at extension 4321.
A few points are worth noting:
• Effectively communicate the start and duration of any downtime that might be involved in the change.
• Make sure you give the time of the change in such a way that it is useful toallusers, no matter where they may be located.
• Use terms that your users will understand. The people impacted by this work do not care that the new CPU module has twice as much cache, or that the database will live on a RAID 5 logical volume.
1.3.2. Tell Your Users What You Are Doing
This step is primarily a last-minute warning of the impending change; as such, it should be a brief repeat of the first message, though with the impending nature of the change made more apparent ("The system upgrade will take place TONIGHT."). This is also a good place to publicly answer any questions you may have received as a result of the first message.
Continuing our hypothetical example, here is one possible last-minute warning:
System Downtime Scheduled for Tonight
Reminder: The system downtime announced this past Monday will take place as scheduled tonight at 6pm (midnight for the Berlin office). You can find the original announcement on the company intranet website, on the System Administration page.
Several people have asked whether they should stop working early tonight to make sure their work is backed up prior to the downtime. This will not be necessary, as the work being done tonight will not impact any work done on your personal workstations.
Remember, those of you that have written your own SQL queries should be aware that the layout of some indices will change. This is documented on the company intranet website, on the Finance page.
1.3.3. Tell Your Users What You Have Done
After you have finished making the changes, youmusttell your users what you have done. Again, this should be a summary of the previous messages (invariably someone will not have read them). However, there is one important addition that you must make. It is vital that you give your users the current status. Did the upgrade not go as smoothly as planned? Was the new storage server only able to serve the systems in Engineering, and not in Finance? These types of issues must be addressed here. Of course, if the current status differs from what you communicated previously, you should make this point clear, and describe what will be done (if anything) to arrive at the final solution.
In our hypothetical situation, the downtime had some problems. The new CPU module did not work; a call to the system’s manufacturer revealed that a special version of the module is required for in-the-field upgrades. On the plus side, the migration of the database to the RAID volume went well (even though it took a bit longer than planned due to the problems with the CPU module.
Here is one possible announcement:
System Downtime Complete
The system downtime scheduled for Friday night (please see the System Administration page on the com-pany intranet website) has been completed. Unfortunately, hardware issues prevented one of the tasks from being completed. Due to this, the remaining tasks took longer than the originally-scheduled four hours. Instead, all systems were back in production by midnight (6am Saturday for the Berlin office).
Because of the remaining hardware issues, performance of the AP, AR, and the Balance Sheet report will be slightly improved, but not to the extent originally planned. A second downtime will be announced and scheduled as soon as the issues that prevented completion of the task have been resolved.
Please note that the downtime did change some database indices; people that have written their own SQL queries should consult the Finance page on the company intranet website. Please contact System Adminis-tration at extension 4321 with any questions.
With this kind of information, your users will have sufficient background knowledge to continue their work, and to understand how the changes will impact them.
1.4. Know Your Resources
System administration is mostly a matter of balancing available resources against the people and programs that use those resources. Therefore, your career as a system administrator will be a short and stress-filled one unless you fully understand the resources you have at your disposal.
Some of the resources are ones that seem pretty obvious:
• System resources, such as available processing power, memory, and disk space • Network bandwidth
• Available money from the IT budget But some may not be so obvious:
• The services of operations personnel, other admins, or even an administrative assistant
• Time (often of critical importance when the time involves things such as the amount of time during which system backups may take place)
The important thing to note is that it is highly valuable to take a complete inventory of those resources that are available to you, and tokeep it current— a lack of "situational awareness" when it comes to available resources can often be worse thannoawareness at all.
1.5. Know Your Users
Although some people bristle at the term "users" (perhaps due to some system administrators’ use of the term in a derogatory manner), it is used here with no such connotation implied. Users are those people that use the systems and resources for which you are responsible — no more, and no less. As such, they are central to your ability to successfully administer your systems; without understanding your users, how can you understand the system resources they will require?
For example, consider a bank teller. A bank teller will use a strictly-defined set of applications, and requires little in the way of system resources. A software engineer, on the other hand, may use many different applications, and will always welcome more system resources (for faster build times). Two entirely different users with two entirely different needs.
Make sure you learn as much about your users as you can.
1.6. Know Your Business
Whether you work for a large, multinational corporation or a small community college, you must still understand the nature of the business environment in which you work. This can be boiled down to one question:
What is the purpose of the systems you administer?
The key point here is to understand your systems’ purpose in a more global sense:
• Applications that must be run within certain time frames, such as at the end of a month, quarter, or year
• The times during which system maintenance may be done
• New technologies that could be used to resolve long-standing business problems
By taking into account your organization’s business, you will find that your day-to-day decisions will be better for your users. And for you.
1.7. Security Cannot be an Afterthought
No matter what you might think about the environment in which your systems are running, you cannot take security for granted. Even standalone systems not connected to the Internet may be at risk (al-though obviously the risks will be different from a system that has connections to the outside world). Therefore, it is extremely important to consider the security implications of everything that you do. The following lists illustrates the different kinds of issues that you should consider:
• The nature of possible threats to each of the systems under your care • The location, type, and value of the data on those systems
• The type and frequency of authorized access to the systems
What would happen ifthatperson were to attempt to subvert our security?
Note
This doesnotmean that you should treat your coworkers as if they are criminals. It just means that you should look at the type of work that each person performs, and determine what types of security breaches a person in that position could perpetrate, if they were so inclined.
1.7.1. The Risks of Social Engineering
While most system administrators’ first reactions when they think about security is to concentrate on the technological aspects, it is important to maintain perspective. Quite often, security breaches do not have their origins in technology, but in human nature.
People interested in breaching security often use human nature to entirely bypass technological access controls. This is known associal engineering. Here is an example:
The second shift operator receives an outside phone call. The caller claims to be your organization’s CFO (the CFO’s name and background information was obtained from your organization’s website, on the "Management Team" page).
The caller claims to be calling from some place halfway around the world (maybe this part of the story is a complete fabrication, or perhaps your organization’s website has a recent press release that makes mention of the CFO attending a tradeshow).
The caller tells a tale of woe; his laptop was stolen at the airport, and he is with an important cus-tomer and needs access to the corporate intranet to check on the cuscus-tomer’s account status. Would the operator be so kind as to give him the necessary access information?
Do you know what would your operator do? Unless your operator has guidance (in the form of policies and procedures), you very likely do not know for sure.
Like traffic lights, the goal of policies and procedures is to provide unambiguous guidance as to what is and is not appropriate behavior. However, just as with traffic lights, policies and procedures only work if everyone follows them. And there is the crux of the problem — it is unlikely that everyone will adhere to your policies and procedures. In fact, depending on the nature of your organization, it is possible that you do not even have sufficient authority to define policies, much less enforce them. What then?
Unfortunately, there are no easy answers. User education can help; do everything you can to help make your user community aware of security and social engineering. You can also make yourself available as a sounding board for users’ questions about things that do not seem quite right.
1.8. Plan Ahead
A system administrator that took all the previous advice to heart and did their best to follow it would be a fantastic system administrator — for a day. Eventually, the environment will change, and one day our fantastic administrator would be caught flat-footed. The reason? Our fantastic administrator failed to plan ahead.
Certainly no one can predict the future with 100% accuracy. However, with a bit of awareness it is easy to read the signs of many changes:
• Talk of an impending acquisition means that you may end up being responsible for new (and pos-sibly incompatible) systems in one or more remote locations
Being able to read these signs (and to respond effectively to them) will make life easier for you and your users.
1.9. Expect the Unexpected
While the phrase "expect the unexpected" is trite, it reflects an underlying truth that all system admin-istrators must understand:
Therewillbe times when you are caught off-guard.
After becoming comfortable with this uncomfortable fact of life, what can a concerned system admin-istrator do? The answer lies in flexibility; by performing your job in such a way as to give you (and your users) the most options possible. Take, for example, the issue of disk space. Given that never having sufficient disk space seems to be as much a physical law as the law of gravity, it is reasonable to assume that at some point you will be confronted with a desperate need for additional disk space right now.
What would a system administrator who expects the unexpected do in this case? Perhaps it is possible to keep a few disk drives sitting on the shelf as spares in case of hardware problems1
. A spare of this type could be quickly deployed2
on a temporary basis to address the short-term need for disk space, giving time to more permanently resolve the issue (by following the standard procedure for procuring additional disk drives, for example).
By trying to anticipate problems before they occur, you will be in a position to respond more quickly and effectively than if you let yourself be surprised.
1.10. In Conclusion. . .
While everything discussed in this chapter may seem like a lot of additional work that takes away from the "real" work of administering systems, actually the opposite is true; only by keeping this philosophy in mind will you give your users the service they deserve, and reach your full potential as a system administrator.
1.11. Red Hat Linux-Specific Information
This section describes information related to the philosophy of system administration that is specific to Red Hat Linux.
1.11.1. Automation
Automation of frequently-performed tasks under Red Hat Linux requires knowledge of several dif-ferent types of technologies. First are the commands that control the timing of command or script execution. Thecronandatcommands are most commonly used in these roles.
Incorporating an easy-to-understand yet powerfully flexible time specification system, croncan schedule the execution of commands or scripts for recurring intervals ranging in length from minutes
1. And of course a system administrator that expects the unexpected would naturally use RAID (or related
technologies) to lessen the impact of a disk drive that fails during production.
to months. Thecrontabcommand is used to manipulate the files that control thecrondaemon that actually schedules eachcronjob for execution.
Theatcommand (and the closely-related commandbatch) are more appropriate for scheduling the execution of one-time scripts or commands. These commands implement a rudimentary batch subsystem consisting of multiple queues with varying scheduling priorities (known asnicenesslevels, due to the name of the command —nice— used to change priorities of running programs). Both
atandbatchare perfect for tasks that must start at a given time, but are not time-critical in terms of finishing.
Next are the various scripting languages. These are the "programming languages" that the average system administrator uses to automate manual operations. There are many scripting languages (and each system administrator tends to have a personal favorite), but the following are currently the most common:
• Thebashcommand shell • Theperlscripting language
Over and above the obvious differences between these languages, the biggest difference is in the way in which these languages interact with other utility programs on a Red Hat Linux system. Shell scripts tend to make more extensive use of the many small utility programs (for example, to perform character string manipulation), whileperlscripts perform more of these types of operations using features built into the language itself.
This means that, in order to truly master shell scripting, you will need to be familiar with the many utility programs (such asgrepandsed) that are part of Red Hat Linux. Learningperl, on the other hand, is a more "self-contained" process. However, manyperllanguage constructs are based on the syntax of various traditional UNIX utility programs, and as such will be familiar to those Red Hat Linux system administrators with shell scripting experience.
1.11.2. Documentation and Communication
In the areas of documentation and communication, there is little that is specific to Red Hat Linux. Since documentation and communication can consist of anything from adding comments to a text-based configuration file to updating a webpage or sending an email, a system administrator using Red Hat Linux will need access to text editors, HTML editors, and mail clients.
Here is a small sample of the many text editors available under Red Hat Linux:
• Thegedittext editor • TheEmacstext editor • TheVimtext editor
Thegedittext editor is a strictly graphical application (in other words, it requires an active X Window System environment), whilevimandEmacsare primarily text-based in nature.
The subject of the best text editor has sparked debate for nearly as long as computers have existed, and will continue to do so. Therefore, the best approach is to try each editor for yourself, and use what works best for you.
For HTML editors, system administrators can use the Composer function of theMozillaWeb browser, orQuanta, a standalone HTML editor. Of course, some system administrators prefer to hand-code their HTML, making a regular text editor a perfectly acceptable tool as well.
1.11.3. Security
As stated earlier in this chapter, security cannot be an afterthought, and security under Red Hat Linux is more than skin-deep. Authentication and access controls are deeply-integrated into the operating system, and are based on designs gleaned from long experience in the UNIX community.
For authentication, Red Hat Linux uses PAM — Pluggable Authentication Modules. PAM makes it possible to fine-tune user authentication via the configuration of shared libraries that all PAM-aware applications use, all without requiring any changes to the applications themself.
Access control under Red Hat Linux uses traditional UNIX-style permissions (read, write, execute) against user, group, and "everyone else" classifications. Like UNIX, Red Hat Linux also makes use of setuidandsetgidbits to temporarily confer expanded access rights to processes running a particular program, based on the ownership of the program file. Of course, this makes it critical that any program to be run with setuid or setgid privileges must be carefully audited to ensure that no exploitable vulnerabilities exist.
Another aspect of security is being able to keep track of system activity. Red Hat Linux makes exten-sive use of logging, both at a kernel and an application level. Logging is controlled by the system log-ging daemonsyslogd, which can log system information locally (normally to files in the/var/log
directory) or to a remote system (which can be a dedicated log server for multiple computers). Intrusion detection sytems (IDS) are powerful tools for any Red Hat Linux system administrator. An IDS makes it possible for system administrators to determine whether unauthorized changes were made to one or more systems. Red Hat Linux includes a dedicated IDS (Tripwire) but the overall design of the operating system itself includes IDS-like functionality.
Because Red Hat Linux is installed using the RPM Package Manager (RPM), it is a straightforward process to verify whether any changes have been made to any of the packages comprising the op-erating system itself. In addition, RPM makes use of cryptographically-based digital signatures that are capable of ensuring the authenticity of any signed package. All packages produced by Red Hat are signed and make use of this feature. However, because RPM’s primary mission is as a package management tool, its abilities as an IDS are somewhat limited. Even so, it can be a good first step toward monitoring a Red Hat Linux system for unauthorized modifications.
Tripwireis a tool that was designed specifically as an IDS; as such, it is more powerful and flexible than using RPM as an IDS.Tripwireconstructs a database ofbaselines, which are snapshots of the system configuration at specific points in time. By tracking changes to the baseline,Tripwireis able to show system configuration changes as a function of time — a handy way of reconstructing the chronology of an intrusion.
But solid intrusion detection is of no value if the IDS itself is vulnerable to tampering.Tripwireavoids this problem by encrypting its configuration files, making unauthorized modifications impossible.
1.12. Additional Resources
This section includes various resources that can be used to learn more about the philosophy of system administration and the Red Hat Linux-specific subject matter discussed in this chapter.
1.12.1. Installed Documentation
Note
Red Hat Linux uses themancommand to display online help text. The text to be displayed is known as aman page, and is displayed using the following command:
man man-page✁
(Replace✂ man-page✄ with the name of the desired man page.)
Often you will see a man page followed by a number or letter within parentheses; this number or letter denotes thesectionunder which the man page is filed. The sections include:
• Section 1 — User commands • Section 2 — System calls • Section 3 — Subroutines
• Section 4 — Devices
• Section 5 — File formats • Section 6 — Games • Section 7 — Miscellaneous
• Section 8 — System administration • Section l — Local
• Section n — New
It should be noted that many of the man pages have gotten their section classifications in years past, sometimes making the sections more of a historical curiosity than a factual classification system. However, there is one instance when the section number is important: when more than one man page exists with the same name. One example ischroot(1)andchroot(2). The first man page documents thechrootuser command, while the second documents thechrootsystem call. If you enter the commandman chroot, you will see the man page for thechrootuser command3
. In order to view the man page for thechrootsystem call, you must include the section number:
man 2 chroot
Once you are displaying a man page, you are actually using a text display program known as apager. To display subsequent screens, press the [Space] key; to quit, press [Q]. The [H] key will display help for the pager.
• crontab(1)andcrontab(5)man pages — Command and file format documentation for using
cron.
• at(1)man page — Schedule commands and scripts for execution at a later time with this utility. • bash(1)man page — Learn more about the default shell (and shell script writing) with this
docu-mentation.
• perl(1)man page — View pointers to the many man pages that make up perl’s online documen-tation.
3. There is a set order whichmanuses to search the sections; by default it is configured to look first for user commands, then system administration-related information, and then at the rest of the sections in
• gedit(1)man page andHelpmenu entry — Learn how to edit text files with this graphical text editor.
• emacs(1)man page — Information (including instructions for running an online tutorial) on how to use this text editor.
• vim(1)man page — Learn how to use this text-based editor.
• mozilla(1)man page andHelp Contentsmenu entry — Learn how to edit HTML files, read mail, and browse the Web.
• Quanta Handbookmenu entry — Learn how to edit HTML files with this graphical HTML editor. • evolution(1)man page andHelpmenu entry — Learn how to manage your email with this
graphical email client.
• pine(1)man page and?menu entry — Learn how to manage your email with this text-based email client.
• mutt(1)man page and files in/usr/share/doc/mutt-☎ version✆ — Learn how to manage
your email with this text-based email client.
• pam(8)man page and files in/usr/share/doc/pam-☎ version✆ — Learn how authentication
takes place under Red Hat Linux.
• tripwire(8)man page — Learn how to configure and run this intrusion detection software.
1.12.2. Useful Websites
• http://www.kernel.org/pub/linux/libs/pam/ — The Linux-PAM project homepage.
• http://www.usenix.org/ — The USENIX homepage. A professional organization dedicated to bring-ing together computer professionals of all types and fosterbring-ing improved communication and inno-vation.
• http://www.sage.org/ — The System Administrators Guild homepage. A USENIX special technical group that is a good resource for all system administrators responsible for Linux (or Linux-like) operating systems.
• http://www.tripwire.org/ — TheTripwirehomepage.
1.12.3. Related Books
Most books on system administration do little to cover the philosophy behind the job. However, the following books do have sections that give a bit more depth to the issues that were discussed here:
• TheRed Hat Linux Reference Guide; Red Hat, Inc. — Provides an overview of locations of key system files, user and group settings, PAM configuration, andTripwireusage.
• TheRed Hat Linux Security Guide; Red Hat, Inc. — Contains a comprehensive discussion of many security-related issues for Red Hat Linux system administrators.
• TheRed Hat Linux Customization Guide; Red Hat, Inc. — Includes chapters on managing users and groups, automating tasks, and managing log files.
• TheRed Hat Linux Getting Started GuideRed Hat, Inc. — Discusses Web browsing, email, and basic shell command usage.
• Linux Administration Handbookby Evi Nemeth, Garth Snyder, and Trent R. Hein; Prentice Hall — Provides a good section on the policies and politics side of system administration, including several "what-if" discussions concerning ethics.
• Linux System Administration: A User’s Guideby Marcel Gagne; Addison Wesley Professional — Contains a good chapter on automating various tasks.
Resource Monitoring
As stated earlier, a great deal of system administration revolves around resources and their efficient use. By balancing various resources against the people and programs that use those resources, you will waste less money and make your users as happy as possible. However, this leaves two questions: What are resources?
And:
How is it possible to know what resources are being used (and to what extent)?
The purpose of this chapter is to enable you to answer these questions by helping you to learn more about resources, and how they can be monitored.
2.1. Basic Concepts
Before you can monitor resources, you first have to know what resources there are to monitor. All systems have the following resources available:
• CPU power • Bandwidth • Memory • Storage
These resources are covered in more depth in the following chapters. However, for the time being all you need to keep in mind is that these resources have a direct impact on system performance, and therefore, on your users’ productivity and happiness.
At its simplest, resource monitoring is nothing more than obtaining information concerning the uti-lization of one or more system resources.
However, it is rarely this simple. First, one must take into account the resources to be monitored. Then it is necessary to look at each system to be monitored, paying particular attention to each system’s situation.
The systems you monitor will fall into one of two categories:
• The system is currently experiencing performance problems at least part of the time and you would like to improve its performance.
• The system is currently running well and you would like it to stay that way.
The first category means that you should monitor resources from a system performance perspective, while the second category means that you should monitor system resources from a capacity planning perspective.
2.2. System Performance Monitoring
As stated above, system performance monitoring is normally done in response to a performance prob-lem. Either the system is running too slowly, or programs (and sometimes even the entire system) fail to run at all. In either case, performance monitoring is normally done as the first and last steps of a three-step process:
1. Monitoring to identify the nature and scope of the resource shortages that are causing the per-formance problems
2. The data produced from monitoring is analyzed and a course of action (normally performance tuning and/or the procurement of additional hardware) is taken to resolve the problem 3. Monitoring to ensure that the performance problem has been resolved
Because of this, performance monitoring tends to be relatively short-lived in duration, and more de-tailed in scope.
Note
System performance monitoring is often an iterative process, with these steps being repeated several times to arrive at the best possible system performance. The primary reason for this is that system resources and their utilization tend to be highly interrelated, meaning that often the elimination of one resource bottleneck uncovers another one.
2.3. Monitoring System Capacity
Monitoring system capacity is done as part of an ongoing capacity planning program. Capacity plan-ning uses long-term resource monitoring to determine rates of change in the utilization of system resources. Once these rates of change are known, it becomes possible to conduct more accurate long-term planning regarding the procurement of additional resources.
Monitoring done for capacity planning purposes is different from performance monitoring in two ways:
• The monitoring is done on a more-or-less continuous basis • The monitoring is usually not as detailed
The reason for these differences stems from the goals of a capacity planning program. Capacity plan-ning requires a "big picture" view; short-term or anomalous resource usage is of little concern. Instead, data is collected over a period of time, making it possible to categorize resource utilization in terms of changes in workload. In more narrowly-defined environments, (where only one application is run, for example) it is possible to model the application’s impact on system resources. This can be done with sufficient accuracy to make it possible to determine, for example, the impact of five more customer service representatives running the customer service application during the busiest time of the day.
2.4. What to Monitor?
As stated earlier, the resources present in every system are CPU power, bandwidth, memory, and storage. At first glance, it would seem to be that monitoring would consist of just looking at these four different things.
• How much free space is available?
• How many I/O operations on average does it perform each second? • How long on average does it take each I/O operation to be completed? • How many of those I/O operations are reads? How many are writes? • What is the average amount of data that is read/written with each I/O?
There are more ways of looking at disk drive performance; these points have only scratched the surface. The main thing to keep in mind is that there are many different types of data for each resource. The following sections look at the types of utilization information that would be helpful for each of the major resource types.
2.4.1. Monitoring CPU Power
In its most basic form, monitoring CPU power can be no more difficult than seeing if CPU utilization ever reaches 100%. If CPU utilization stays below 100%, no matter what the system is doing, there is additional processing power available for more work.
However, it is a rare system that does not reach 100% CPU utilization at least some of the time. That is when it becomes important to look at more detailed CPU utilization data. By doing so, it becomes possible to start determining where the majority of your processing power is being consumed. Here are some of the more popular CPU utilization statistics:
User Versus System
The percentage of time spent performing user-level processing versus system-level processing can point out whether a system’s load is primarily due to running applications, or due to op-erating system overhead. High user-level percentages tend to be good (assuming users are not experiencing unsatisfactory performance), while high system-level percentages tend to point to-ward problems that will require further investigation.
Context Switches
A context switch happens when the CPU stops running one process and starts running another. Because each context switch requires the operating system to take control of the CPU, excessive context switches and high levels of system-level CPU consumption tend to go hand-in-hand.
Interrupts
As the name implies, interrupts are situations where the processing being performed by the CPU is abruptly changed. Interrupts generally occur due to hardware activity (such as an I/O device completing an I/O operation) or due to software (such as software interrupts that control applica-tion processing). Because interrupts must be serviced at a system level, high interrupt rates lead to higher system-level CPU consumption.
Runnable Processes
A process may be in different states. For example, it may be: • Waiting for an I/O operation to complete
• Waiting for the memory management subsystem to handle a page fault In these cases, the process has no need for the CPU.
one1
of the runnable processes must wait for their turn at the CPU. By monitoring the number of runnable processes, it is possible to determine how CPU-bound your system is.
Other performance data that impacts CPU utilization tends to revolve around different services that the operating system provides to processes. They may include statistics on memory management, I/O processing, and so on. These statistics also reveal that, when system performance is monitored, there are no boundaries between the different statistics. In other words, CPU utilization statistics may end up pointing to a problem in the I/O subsystem, or memory utilization statistics may reveal an application design flaw.
Therefore, when monitoring system performance, it is not possible to look at any one statistic in com-plete isolation; only by viewing the overall picture will it be possible to extract meaningful information from any performance statistics you gather.
2.4.2. Monitoring Bandwidth
Monitoring bandwidth is more elusive than the other resources described here. The reason for this is due to the fact that performance statistics tend to be device-based, while most of the places where bandwidth is important tend to be the buses that connect devices. In those instances where more than one device shares a common bus, you might see reasonable statistics for each device, but the aggregate load those devices place on the bus would be much greater.
Another challenge to monitoring bandwidth is that there can be circumstances where statistics for the devices themselves may not be available. This is particularly true for system expansion buses and datapaths2
. However, even though 100% accurate bandwidth-related statistics may not always be available, there is often enough information to make some level of analysis possible, particularly when related statistics are taken into account.
Some of the more common bandwidth-related statistics are:
Bytes received/sent
Network interface statistics provide an indication of the bandwidth utilization of one of the more visible buses — the network.
Interface counts and rates
These network-related statistics can give indications of excessive collisions, transmit and receive errors, and more. Through the use of these statistics (particularly if the statistics are available for more than one system on your network), it is possible to perform a modicum of network troubleshooting even before the more common network diagnostic tools are used.
Transfers per Second
Normally collected for block I/O devices, such as disk and high-performance tape drives, this statistic is a good way of determining whether a particular device’s bandwidth limit is being reached. Due to their electromechanical nature, disk and tape drives can only perform so many I/O operations every second; their performance rapidly degrades as this limit is reached.
2.4.3. Monitoring Memory
If there is one area where a wealth of performance statistics can be found, it is in the area of moni-toring memory utilization. Due to the inherent complexity of today’s demand-paged virtual memory
1. Assuming a single-processor computer system.
2. More information on buses, datapaths and bandwidth is available in Chapter 3Bandwidth and Processing
operating systems, memory utilization statistics are many and varied. It is here that the majority of a system administrator’s work with resource management takes place.
The following statistics represent a cursory overview of commonly-found memory management statis-tics:
Page Ins/Page Outs
These statistics make it possible to gauge the flow of pages from system memory to attached mass storage devices (usually disk drives). High rates for both of these statistics can mean that the system is short of physical memory and is thrashing.
Active/Inactive Pages
These statistics show how heavily memory resident pages are used. A lack of inactive pages can point toward a shortage of physical memory.
Free, Shared, Buffered, and Cached Pages
These statistics provide additional detail over the more simplistic active/inactive page statistics. By using these statistics, it is possible to determine the overall mix of memory utilization.
Swap Ins/Swap Outs
These statistics show the system’s overall swapping behavior. Excessive rates here can point to physical memory shortages.
Successfully monitoring memory utilization requires a good understanding of how demand-paged virtual memory operating systems work. While such a subject alone could take up an entire book, the basic concepts are discussed in Chapter 4Physical and Virtual Memory. This chapter, along with time spent monitoring a system, gives you the the necessary building blocks to learn more about this subject.
2.4.4. Monitoring Storage
Monitoring storage normally takes place at two different levels:
• Monitoring for sufficient disk space
• Monitoring for storage-related performance problems
The reason for this is that it is possible to have dire problems in one area, and no problems whatsoever in the other. For example, it is possible to cause a disk drive to run out of disk space without once causing any kind of performance-related problems. Likewise, it is possible to have a disk drive that has 99% free space, yet is being pushed past its limits in terms of performance.
However, it is more likely that the average system will experience varying degrees of resource short-ages in both areas. Because of this, it is also likely that — to some extent — problems in one area will impact the other. Most often this type of interaction takes the form of poorer and poorer I/O perfor-mance as a disk drive nears 0% free space although, in cases of extreme I/O loads, it might be possible to slow I/O throughput to such a level that applications will no longer run properly.
In any case, the following statistics are useful for monitoring storage:
Free Space
File System-Related Statistics
These statistics (such as number of files/directories, average file size, etc.) provide additional detail over a single free space percentage. As such, these statistics make it possible for system administrators to configure the system to give the best performance, as the I/O load imposed by a file system full of many small files is not the same as that imposed by a file system filled with one massive file.
Transfers per Second
This statistic is a good way of determining whether a particular device’s bandwidth limitations are being reached.
Reads/Writes per Second
A slightly more detailed breakdown of the transfers per second statistic, these allow the system administrator to more fully understand the nature of the I/O loads a storage device is experi-encing. This can be critical, as some storage technologies have widely different performance characteristics for read versus write operations.
2.5. Red Hat Linux-Specific Information
Red Hat Linux comes with a variety of resource monitoring tools. While there are more than those listed here, these tools are representative in terms of functionality. The tools are:
• free
• top(andGNOME System Monitor, a more graphically oriented version oftop) • vmstat
• The Sysstat suite of resource monitoring tools Let us look at each one in more detail.
2.5.1.
freeThefreecommand displays system memory utilization. Here is an example of its output:
total used free shared buffers cached
Mem: 255508 240268 15240 0 7592 86188
-/+ buffers/cache: 146488 109020 Swap: 530136 26268 503868
TheMem:row displays physical memory utilization, while theSwap:row displays the utilization of the system swap space, and the-/+ buffers/cache:row displays the amount of physical memory currently devoted to system buffers.
Tip
A better solution than usingfree -swould be to runfreeusing thewatchcommand. For example, to display memory utilization every two seconds (the default display interval), use this command:
watch free
Thewatchcommand issues thefreecommand every two seconds, after first clearing the screen. This makes it much easier to see how memory utilization changes over time, as it is not necessary to scan continually scrolling output. You can control the delay between updates by using the-noption, and can cause any changes between updates to be highlighted by using the-doption, as in the following command:
watch -n 1 -d free
For more information, refer to thewatchman page.
Thewatchcommand runs until interrupted with [Ctrl]-[C]. Thewatchcommand is something to keep in mind; it can come in handy in many situations.
2.5.2.
topWhilefreedisplays only memory-related information, thetopcommand does a little bit of every-thing. CPU utilization, process statistics, memory utilization —topdoes it all. In addition, unlike thefreecommand,top’s default behavior is to run continuously; there is no need to use thewatch
command. Here is a sample display:
11:13am up 1 day, 31 min, 5 users, load average: 0.00, 0.05, 0.07 89 processes: 85 sleeping, 3 running, 1 zombie, 0 stopped
CPU states: 0.5% user, 0.7% system, 0.0% nice, 98.6% idle
Mem: 255508K av, 241204K used, 14304K free, 0K shrd, 16604K buff Swap: 530136K av, 56964K used, 473172K free 64724K cached
PID USER PRI NI SIZE RSS SHARE STAT %CPU %MEM TIME COMMAND 8532 ed 16 0 1156 1156 912 R 0.5 0.4 0:11 top
1520 ed 15 0 4084 3524 2752 S 0.3 1.3 0:00 gnome-terminal 1481 ed 15 0 3716 3280 2736 R 0.1 1.2 0:01 gnome-terminal 1560 ed 15 0 11216 10M 4256 S 0.1 4.2 0:18 emacs
1 root 15 0 472 432 416 S 0.0 0.1 0:04 init 2 root 15 0 0 0 0 SW 0.0 0.0 0:00 keventd 3 root 15 0 0 0 0 SW 0.0 0.0 0:00 kapmd
4 root 34 19 0 0 0 SWN 0.0 0.0 0:00 ksoftirqd_CPU0 5 root 15 0 0 0 0 SW 0.0 0.0 0:00 kswapd 6 root 25 0 0 0 0 SW 0.0 0.0 0:00 bdflush 7 root 15 0 0 0 0 SW 0.0 0.0 0:00 kupdated 8 root 25 0 0 0 0 SW 0.0 0.0 0:00 mdrecoveryd 12 root 15 0 0 0 0 SW 0.0 0.0 0:00 kjournald 91 root 16 0 0 0 0 SW 0.0 0.0 0:00 khubd 185 root 15 0 0 0 0 SW 0.0 0.0 0:00 kjournald 186 root 15 0 0 0 0 SW 0.0 0.0 0:00 kjournald 576 root 15 0 712 632 612 S 0.0 0.2 0:00 dhcpcd
Warning
Althoughtoplooks like a simple display-only program, this is not the case.topuses single character commands to perform various operations; if you are logged in as root, it is possible to change the priority and even kill any process on your system. Therefore, until you have reviewedtop’s help screen (type [?] to display it), it is safest to only type [q] (which exitstop).
2.5.2.1. The GNOME System Monitor — A Graphicaltop
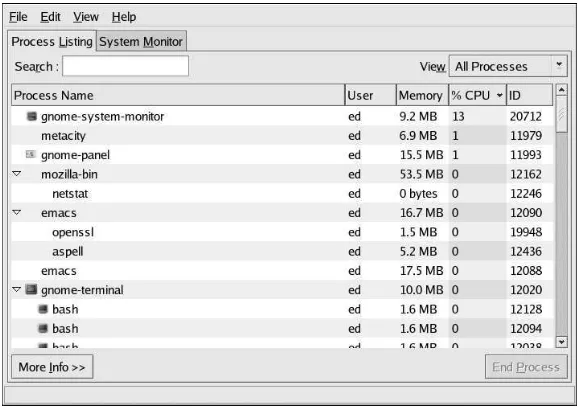
If you are more comfortable with graphical user interfaces, theGNOME System Monitormay be more to your liking. Liketop, theGNOME System Monitordisplays information related to overall system status, process counts, memory and swap utilization, and process-level statistics.
However, theGNOME System Monitorgoes a step further by also including graphical representa-tions of CPU, memory, and swap utilization, along with a tabular disk space utilization listing. Here is an example of theGNOME System Monitor’sProcess Listingdisplay:
Figure 2-1. The GNOME System Monitor Process Listing Display
Additional information can be displayed for a specific process by first clicking on the desired process and then clicking on theMore Infobutton.
To view the CPU, memory, and disk usage statistics, click on theSystem Monitortab.