Lampiran 3
FORMAT S TROOP TES T
FORMULIR PENCATATAN WAKTU
Anggota peneliti : Status Data :
Pukul :
Hari/tanggal :
Kelas :
No. Nama S iswa JK/Umur
Waktu penyebutan
warna
Waktu penyebutan
kata
Waktu total
Lampiran 4
Master Data Karakteristik Responden di SDN. 067240
No Nama Umur Jenis Kelamin Kelas
1 Regina 11 2 1
2 Ezra 11 2 1
3 Nova 11 2 1
4 Cindy 12 2 1
5 Puan 11 2 1
6 M onica 11 2 1
7 Andrean 11 1 1
8 Laila isra 11 2 1
9 Laila nur 10 2 1
10 Ahmad 11 1 1
11 M .Aldi 11 1 1
12 M .Nur 11 1 1
13 Giwang 11 1 1
14 Daffa 11 1 1
15 Putri 12 2 1
16 Deby 10 2 1
17 Rifky 10 1 1
18 Laila rahma 11 2 1
19 Putri amelia 10 2 1
20 M .Devri 10 1 1
21 Rizki 11 1 1
22 Abdul rahman 11 1 1
23 Sartika 12 2 1
24 Agustami 11 1 1
25 Dwiky 12 1 1
26 Nurhaliza 11 2 1
27 Hafizh 11 1 1
28 M .Rangga 11 1 1
29 Raka 11 1 2
30 Nurul 12 2 2
31 Putri sakila 12 2 2
32 Hafidatul 12 2 2
33 Siti 10 2 2
34 Adnan 13 1 2
36 Rahmat 12 1 2
37 Fahrurrozi 11 1 2
38 Lailatul 12 2 2
39 Yurisma 12 2 2
40 Rizky alamsyah 11 1 2
41 Putri safira 10 2 2
42 Haris 11 1 2
43 Rian 11 1 2
44 M .Rayhan 11 1 2
45 Dio 12 1 2
46 Ryan 11 1 2
47 Bayu 11 1 2
48 Najma 11 2 2
49 Desi 12 2 2
50 Putra 12 1 2
51 Surendi 11 1 2
52 Alwi 10 1 2
53 Tania 11 2 2
54 Irda 11 2 2
55 Eka 10 2 2
56 Indah 11 2 2
57 Fitri 11 2 2
Lampiran 5
Master Data Hasil Pengukuran Kebisingan didalam Kelas
No Pre and Post Kelas VIa Kelas VIb
1 Pre1 56,00 59,33
2 Pre2 53,93 59,13
3 Pre3 58,67 56,00
4 Pre4 53,06 55,86
5 Pre5 69,46 57,13
6 Rata2pre 58,22 57,49
7 Totpre 291,12 287,45
8 Post1 81,67 89,86
9 Post2 86,20 86,33
10 Post3 87,46 86,20
11 Post4 87,26 87,06
12 Post5 86,73 87,13
13 Rata2post 85,86 87,31
Lampiran 6
Master Data Hasil Konsentrasi Dengan Interference Score Responden S aat Sebelum Dan Sesudah Kereta Api Melintas
No Nama
Interference Score
Sebelum KA Melintas
Interfrence Score
Sesudah KA Melintas Hasil Kategori Hasil Kategori
1 Regina 46 2 61 2
2 Ezra 15 2 21 2
3 Nova 1 1 11 1
4 Cindy 5 1 23 2
5 Puan 14 2 24 2
6 M onica 15 2 22 2
7 Andrean 7 1 20 2
8 Laila isra 9 1 17 2
9 Laila nur 14 2 20 2
10 Ahmad 13 1 23 2
11 M .Aldi 9 1 12 1
12 M .Nur 6 1 10 1
13 Giwang 9 1 11 1
14 Daffa 10 1 12 1
15 Putri 7 1 18 2
16 Deby 11 1 19 2
17 Rifky 14 2 16 2
18 Laila rahma 12 1 22 2
19 Putri amelia 9 1 7 1
20 M .Devri 16 2 10 1
21 Rizki 11 1 13 1
22 Abdul rahman 13 1 17 2
23 Sartika 13 1 34 2
24 Agustami 14 2 16 2
25 Dwiky 29 2 33 2
26 Nurhaliza 27 2 12 1
27 Hafizh 13 1 17 2
28 M .Rangga 10 1 13 1
29 Raka 12 1 14 2
30 Nurul 13 1 11 1
31 Putri sakila 6 1 4 1
32 Hafidatul 12 1 21 2
33 Siti 12 1 20 2
34 Adnan 21 2 38 2
35 Raihan 14 2 20 2
38 Lailatul 8 1 27 2
39 Yurisma 11 1 27 2
40 Rizky alamsyah 17 2 20 2
41 Putri safira 12 1 11 1
42 Haris 16 2 28 2
43 Rian 23 2 7 1
44 M .Rayhan 12 1 7 1
45 Dio 9 1 10 1
46 Ryan 13 1 10 1
47 Bayu 19 2 5 1
48 Najma 3 1 7 1
49 Desi 26 2 25 2
50 Putra 26 2 21 2
51 Surendi 11 1 11 1
52 Alwi 30 2 24 2
53 Tania 14 2 9 1
54 Irda 5 1 7 1
55 Eka 14 2 18 2
56 Indah 15 2 20 2
57 Fitri 11 1 10 1
Lampiran 7
Hasil Uji Statistik
1. Hasil Distribusi Frekuensi Karakteristik Responden
Usia S iswa
Frequency Percent Valid Percent Cumulative Percent
Valid
10 9 15,5 15,5 15,5
11 34 58,6 58,6 74,1
12 13 22,4 22,4 96,6
13 2 3,4 3,4 100,0
Total 58 100,0 100,0
Jenis Kelamin Siswa
Frequency Percent Valid Percent Cumulative Percent
Valid
laki-laki 29 50,0 50,0 50,0
perempuan 29 50,0 50,0 100,0
Total 58 100,0 100,0
Kelas Siswa
Frequency Percent Valid Percent Cumulative Percent
Valid
VIa 28 48,3 48,3 48,3
VIb 30 51,7 51,7 100,0
2. Uji Normalitas Data (Tingkat Kebisingan)
One-S ample Kolmogorov-S mirnov Test
rata2pre rata2post
N 2 2
Normal Parametersa,b M ean 57,8550 86,5850
Std. Deviation ,51619 1,02530
M ost Extreme Differences
Absolute ,260 ,260
Positive ,260 ,260
Negative -,260 -,260
Kolmogorov-Smirnov Z ,368 ,368
Asymp. Sig. (2-tailed) ,999 ,999
a. Test distribution is Normal. b. Calculated from data.
3. Hasil Uji Paired t-test (Sebelum dan S aat Kereta Api Melintas)
T-Test
Paired S amples Statistics
M ean N Std.
Deviation
Std. Error M ean Pair 1
rata2pre 57,8550 2 ,51619 ,36500
rata2post 86,5850 2 1,02530 ,72500
Paired S amples Correlations
N Correlation Sig. Pair 1 rata2pre &
Paired S amples Test
Paired Differences t df Sig.
(2-tailed) M ean Std.
Deviation
Std. Error M ean
95% Confidence Interval of the
Difference Lower Upper Pair 1 rata2pre -
rata2post -28,73000 1,54149 1,09000 -42,57976 -14,88024 -26,358 1 ,024
4. Hasil Tes Normalitas Data Konsentrasi Responden
Explore (Konsentrasi Pretest)
Descriptives
Statistic Std. Error
konstentrasi pre test
M ean 13,59 ,984
95% Confidence Interval for M ean
Lower
Bound 11,62
Upper
Bound 15,56
5% Trimmed M ean 12,99
M edian 12,50
Variance 56,106
Std. Deviation 7,490
M inimum 1
Case Processing S ummary
Cases
Valid M issing Total
N Percent N Percent N Percent
konstentrasi pre
M aximum 46
Range 45
Interquartile Range 6
Skewness 1,825 ,314
Kurtosis 5,480 ,618
Tests of Normality
Kolmogorov-Smirnova Shapiro-Wilk Statistic df Sig. Statistic df Sig. konstentrasi pre
test ,202 58 ,000 ,853 58 ,000
a. Lilliefors Significance Correction
Explore (Konsentrasi Posttest)
Case Processing S ummary
Cases
Valid M issing Total
N Percent N Percent N Percent
konsentrasi post
test 58 100,0% 0 0,0% 58 100,0%
Descriptives
Statistic Std. Error
konsentrasi post test
M ean 17,40 1,254
95% Confidence Interval for M ean
Lower
Bound 14,89
Upper
Bound 19,91
5% Trimmed M ean 16,59
M edian 17,00
Variance 91,226
M inimum 4
M aximum 61
Range 57
Interquartile Range 11
Skewness 1,843 ,314
Kurtosis 6,533 ,618
Tests of Normality
Kolmogorov-Smirnova Shapiro-Wilk Statistic df Sig. Statistic df Sig. konsentrasi post
test ,112 58 ,069 ,865 58 ,000
a. Lilliefors Significance Correction
Frequency Table (Konsentrasi)
pretest
Frequency Percent Valid Percent Cumulative Percent Valid
0-13 35 60,3 60,3 60,3
>=14 23 39,7 39,7 100,0
Total 58 100,0 100,0
posttest
Frequency Percent Valid Percent Cumulative Percent Valid
0-13 24 41,4 41,4 41,4
>=14 34 58,6 58,6 100,0
5. Hasil Uji Wilcoxon (Perbedaan konsentrasi sebelum dan sesudah)
Wilcoxon S igned Ranks Test
Ranks
N M ean
Rank
Sum of Ranks
konsentrasi post test - konstentrasi pre test
Negative
Ranks 15
a
24,47 367,00 Positive Ranks 42b 30,62 1286,00
Ties 1c
Total 58
a. konsentrasi post test < konstentrasi pre test b. konsentrasi post test > konstentrasi pre test c. konsentrasi post test = konstentrasi pre test
Test S tatisticsa
konsentrasi post test - konstentrasi pre test
Z -3,655b
Asymp. Sig. (2-tailed) ,000
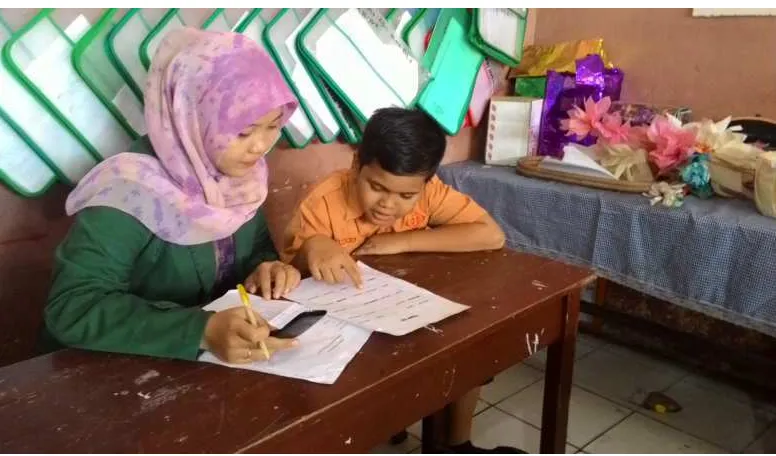
Lampiran 8
Dokumentasi Penelitian
Gambar 1. Peneliti melakukan pengukuran kebisingan didalam kelas
Gambar 3. Peneliti bersama dengan para siswa S DN. 067240