Open Geospatial Consortium
Approval Date: 2012-06-22 Publication date: 2012-07-12
Reference number of this document: OGC 09-044r3 Category
: OGC
®White Paper
Co-Editors
:
Thierry Badard
Matthew Kadillak
George Percivall
Steven Ramage
Carl Reed
Michael Sanderson
Raj Singh
Jayant Sharma
Luc Vaillancourt
OGC White Paper
Geospatial Business Intelligence (GeoBI)
Copyright © 2012 Open Geospatial Consortium
To obtain additional rights of use, visit http://www.opengeospatial.org/legal/.
Warning
This document is not an OGC Standard. This document is an OGC White Paper and is therefore not an official position of the OGC membership. This paper is distributed for review and
comment. This document is subject to change without notice and may not be referred to as an OGC Standard. Further, an OGC White Paper should not be referenced as required or mandatory technology in procurements
.
Document type:
OGC
®White Paper
Document subtype:
White Paper
Document stage:
Approved for Public Release
Attention is drawn to the possibility that some of the elements of this document may be the
subject of patent rights. The Open Geospatial Consortium shall not be held responsible for
identifying any or all such patent rights.
Table of Contents
GeoBI White Paper and OGC contact points ... 4
Forward ... 4
Introduction—Why BI needs standards to incorporate location data ... 5
An introduction to Business Intelligence ... 6
Business users of geospatial information ... 6
How GeoBI is developing in the OGC... 7
GeoBi Opportunities ... 8
Location in business information ... 8
Location in ETL ... 9
Information models ... 10
Actions ... 11
Location in OLAP/OLTP ... 11
Information Models ... 12
OLAP / OLTP Starting Point ... 12
Actions ... 13
Location in Reporting ... 14
Reporting Start Point: Exchangeable Information Models ... 14
Actions ... 15
Next steps for GeoBI in OGC ... 16
Your participation ... 16
Appendix 1 –A BI market primer from a GIS perspective ... 17
Appendix 2 GLOSSARY OF BI TERMS ... 19
G
EO
BI
W
HITE
P
APER AND
OGC
CONTACT POINTS
Any questions regarding this document should be directed to the editor or any the following contributors:
CONTACT COMPANY E-Mail ADDRESS
Raj Singh, Co-Editor OGC rsingh <at> opengeospatial.org
George Percivall, Co-Editor OGC gpercivall <at> opengeospatial.org
Carl Reed OGC creed <at> opengeospatial.org
Mark Reichardt OGC mreichardt <at> opengeospatial.org
F
ORWARD
This white paper provides an assessment of the how OGC standards can be applied and extended to increase the use of geospatial information in the multi-faceted area of Business Intelligence (BI).
Attention is drawn to the possibility that some of the elements of this document may be the subject of patent rights. The Open Geospatial Consortium shall not be held responsible for identifying any or all such patent rights.
Recipients of this document are requested to submit, with their comments, notification of any relevant patent claims or other intellectual property rights of which they may be aware that might be infringed by any implementation of the standard set forth in this document, and to provide supporting
I
NTRODUCTION
—
W
HY
BI
NEEDS STANDARDS TO INCORPORATE LOCATION DATA
BI is an umbrella term for a major component of IT infrastructure. It encompasses Data
Warehouses, Business Analytics, Dashboards and Scorecards. This IT infrastructure is associated with C-level decision-making in an organization. These decision-making tools have typically included location as a dumb attribute (coded sales zones as opposed to sales zones as geographic boundaries). At this point in the BI lifecycle, customers are looking to derive additional business benefit / return on investment from intelligent location data; data discovery and unstructured data.
The BI market bears many resemblances to the GIS market. Early proprietary growth and some standards work on query has given way to market consolidation (see Appendix 1 for a summary as seen through the geospatial lense). Gartner (2011a)1 says that the BI market is now at risk of
creating fragmented silos of data, definitions and tools. This description would resonate with many OGC members. IDS and Directions Magazine originally2 and more recently Gartner (2011a)3 has
sensed now is the appropriate time for location to introduced to the BI space and specifically cited OGC as a key actor in this activity. Accordingly the OGC Board of Directors has identified Geospatial Business Intelligence (GeoBI) as a major focus area for OGC standards related activities. Increasing the uptake of OGC standards in the location intelligence marketplace and re-invigorating the standards initiatives within the business intelligence market can be a basis for improved decision making and opportunities for the broader use of products that are implemented using OGC standards.
This White Paper describes the value, methods and technology for applying geospatial
interoperability standards to business intelligence technology through the addition of location as an intelligent dimension. It concludes with recommendations for next steps.
1 Gartner Magic Quadrant for Business Intelligence Platforms (Rita L. Sallam, James Richardson, John Hagerty, Bill
Hostmann) January 2011.
2 Embodied in the Location Intelligence Conferences
3 Gartner Analyst, Andreas Bitterer speaking at the BI Summit, London 2011 stated that only a small number BI
An introduction to Business Intelligence
This introduction is based on a geospatial viewpoint. It is part of OGC outreach and the OGC welcomes correction from the BI community.
Business intelligence (BI) aims to support better business decision-making. It mainly refers to computer-based techniques for identifying, extracting and analyzing business data, such as sales revenue by products and/or departments or by associated costs and incomes. These data are in functional applications typically at too fine a level of granularity for C-level executives. They are therefore abstracted using ETL tools into a data warehouse. This involves IT departments leading business modeling activities to provide supporting ontologies.
BI technologies provide historical, current and predictive views of business operations. Common functions of business intelligence technologies are reporting, dashboarding, scoreboarding, online analytical processing (OLAP), data mining, process mining, business performance management analytics and predictive analytics. OLAP is a category of decision support tools often used to
provide access, in an efficient and intuitive manner, to a data warehouse or datamart. The de facto
OLAP user interface is Excel (if nothing else is available then financial teams can create their own spreadsheet models). OLAP is a multi-dimensional concept where time is a key dimension.
Location is an additional dimension. The user interface that includes a location dimension needs to give the users (C-level executives) the ability to manipulate boundaries easily to re-query data based on outliers.
B) s objective is to apply skills, knowledge, technologies, applications, quality, risks, security issues
and practices to help a business acquire a better understanding of market behavior and commercial context. To achieve these objectives, BI applications undertake the collection, integration, analysis, interpretation and presentation of business information. By extension, "business intelligence" may refer to the collected information itself or the explicit knowledge developed from the information.4
The purpose of business intelligence—a term that dates at least to 1958—is to support better business decision making. Thus, BI is also described as a decision support system (DSS).
Standards work has been conducted in the BI space. In 2001 the now defunct XMLA Advisory Council produced an XML SOAP specification for data access across the web. This included mdXML as the query language based on underlying ability to query multi-dimensional databases. This work was taken up by the open source community and this has resulted in Mondrian.
BI in geographically dispersed businesses invariably involves supply chain management as efficiencies are sought. If intelligent location is to play a role in BI then models of business processes and related ontologies that are used by supply chain professionals need to be considered5. A glossary of terms is included in Appendix 2.
Business users of geospatial information
Traditional geospatial technology has focused on spatial data management and processing. GIS and image processing software products provide powerful techniques for dealing with geospatial data while retaining a geospatial-centric focus. With the advent of the web, the use of geospatial data
becomes an enabler for many mass-market applications. Web mapping and location based services (LBS) are examples of this recent trend.
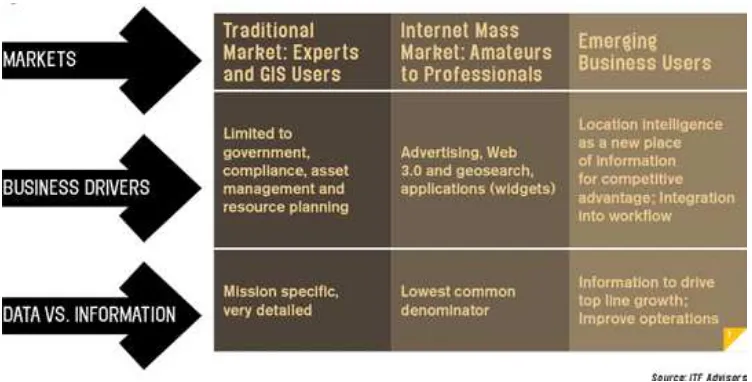
In the traditional GIS market, users of the geospatial software are professionally trained and tasked to work with the geospatial-centric products that require special expertise. In contrast,
consumer—or mass-market —users are not trained on geospatial data and processing and are typically performing simple tasks. Between those extremes are professionals that implicitly use, or could use geospatial information for business tasks (See Figure 1).
Figure 1 - Beyond Traditional GIS/Imagery and Mass Markets6
How GeoBI is developing in the OGC
The work focus of the OGC has followed a similar pattern. In 1994, the original OGC activity focus was on traditional GIS data interoperability and then shortly after that, the emphasis was
increasingly on imagery. In 1998, the OGC members recognized the trend toward the Web as the dominant medium for interoperability. OGC published its first documents on OGC Web Services7 in
that and the following year, and began development of a broader family of interface standards for geospatial web services.
Although business market requirements have not been an explicit emphasis for the work of the OGC, the standards established by OGC have been applied to business applications. The OGC Simple Features Access (SFA) Encoding Standard provides interoperability for geospatial features using SQL—the query language of databases that serve the business market. The OGC s Web Map Service (WMS), Web Feature Service (WFS) and Web Coverage Service (WCS) interface standards provide access to geospatial information based upon service-oriented architecture—a main method for internet-based business.
In 2005, OGC began work on the Web Processing Service (WPS) Interface Standard—an interface that allows any computational process to be exposed as a Web service—thereby adding a focus on
6Figure published in Imaging Notes, Fall 2008 - http://www.imagingnotes.com/go/
7http://portal.opengeospatial.org/files/?artifact_id=723,
http://portal.opengeospatial.org/files/?artifact_id=559&version=1,
online analysis and geoprocessing to OGC s traditional data access and query standards. Also in 2005, the OGC Mass Market working group was established to address the market swing to web-based and LBS consumer applications. However, OGC standards for business users are not as far along. While WPS provides a framework for online analysis, it is silent regarding the specific
computational processes any particular domain, such as business intelligence, should implement. A
key objective of this white paper is to characterize this missing middle and to define a path to
apply the OGC s technology to serve this critical market. We must begin with an understanding of
the existing Business Intelligence market.
The best chance for enterprises to widely adopt geospatial or location intelligence applications is through BI, which is already widely used. 8
The remainder of this white paper will emphasize how GeoBI can build upon the existing OGC standards and activities that provide access to geospatial data for business uses. In part, the use of existing standards for GeoBI can be understood through a review of OGC marketing and
communications materials. However, more can be done to place the existing OGC standards in a BI framework, and additional standards are needed. Further discussion of OGC standards can be found in Appendix 3.
G
EO
B
I
O
PPORTUNITIES
Location in business information
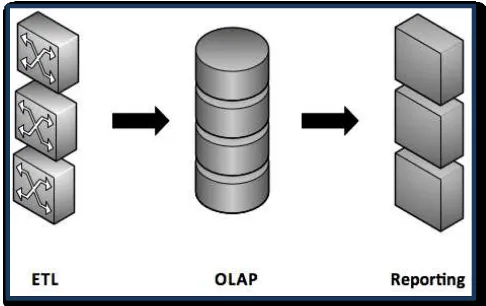
From a geospatial perspective we see three components to the BI landscape, shown in Figure 7.
At the ETL stage, location in business information can occur in many forms ranging from a word with implicit geographic meaning (Paris) to explicit coordinates defining a location in a
mathematical fashion (latitude-longitude coordinates).
At the OLAP/OLTP stage, when data is ready to be analyzed, these human-centric terms must be translated into geometry to support efficient data processing such as aggregation, statistical analysis, and computational modeling.
Finally, at the reporting and visualization stage, a different model of location information may be appropriate to take into account the focus shift from data processing to display.
The following sections of this paper present work that has been done by the OGC on geospatial standards for information analysis interoperability from the perspective of the above three components of the BI space: ETL, OLAP/OLTP, and Applications/Reporting. While this report details a number of standards that can be immediately applied to the BI marketplace and details further standards in Appendix 3, it should not be seen as an exhaustive listing. There is still much work to be done to fully achieve the potential benefits to consumers and producers of BI systems. To this end each section contains a list of potential follow on actions.
Figure 2: Main Components of a BI System: ETL, OLAP/OLTP, and Reporting9
L
OCATION IN
ETL
At the ETL level, location in business information can occur in many forms ranging from a word with implicit geographic meaning (Paris) to explicit coordinates defining a location in a mathematical fashion (latitude-longitude coordinates). Geospatial standards build
on these concepts of location. The most detailed standards provide definitions of geometry, describing physical objects such as buildings, town boundaries, sales territories, voting districts, rainfall patterns, hurricane paths, etc. While physical geometry is a requirement for spatial analysis, businesses rarely maintain location as a geometric object in transactional databases. Rather they store the more abstract, human friendly description of location—an address, a zip code, or a town name.
So, the processing of location in data stored into the data warehouse at the ETL stage is difficult to accomplish in a uniform manner. Most countries maintain some level of de facto standards for various types of location such as addresses, town names, zip codes, census tracts, etc., but although many international standardization activities are underway, a clear consensus has yet to emerge. Therefore, integrating location data at the ETL stage will continue to be a relatively costly, bespoke process until these standardization activities occur. Companies who spend heavily on ETL would be well served by investment in standardizing the processing of addresses internationally.
Another important topic for standardization is units of measure. One must know, for example, whether a statistic is households per acre or households per square meter, or whether another statistic is income per capita or income per household. Especially in a time when more and more data sets will be accessed through third party web services, being explicit and clear to users about how numbers were derived is crucial.
9 Source: JMAP Spatial OLAP – On-Line Analytical Processing for Spatial Databases – Innovative technology to support
OGC standards dealing with web services that allow interoperable access to metadata, data or processes are therefore of great interest for GeoBI applications and should be supported by spatial ETL tools. Such tools provide access to an ever growing number of sources of possibly strategic information for companies or public bodies.
Information models
Geospatial information has one purpose: to communicate knowledge about things that have "where-ness." The knowledge imparted by the map answers two kinds of questions: "where" and "what." Maps can tell us where things are, both in relation to other nearby things and in relation to abstract coordinate systems. Maps also can tell us what things are, either through symbology (e.g., by use of color or line pattern whose meaning is explained in a legend) or through text or tabular annotations or multi-media links. The same applies to attributes that modify or extend our knowledge of things.
There are many different ways to create digital representations of geospatial information. This richness of alternatives is more a curse than a blessing since it has created the confusing and apparently chaotic variety of Geographic Information System (GIS) data structures and formats confronting users. Part of the value a GeoBI vendor brings to a customer is the vendor's ability to make sense out of this chaos. We see this in the considerable attention paid to ETL in the value chain of both geospatial and BI software. However, the market should employ information
standards as much as possible, so that resources currently devoted to making sense out of disparate data can be redirected to analysis and reporting.
This section recommends some starting points for standardizing the representation of geographic information within the BI community Other potential avenues are included in Appendix 3.
ETL Starting Point: Geography: OGC Simple Feature Access Encoding Standard
http://www.opengeospatial.org/standards/sfa
The quantum of geographic information is the feature. A feature object (in software) corresponds to a real world or abstract entity. Attributes of (that is, attributes either contained in or associated to) this feature object describe measurable or describable phenomena about this entity. Unlike a data structure description, feature object instances derive their semantics and valid use or analysis from
the corresponding real world entities meaning. Using the concept of reference systems, attribute
primitives such as geographically registered geometry are tied to the real world. Once located, feature objects are then decorated in a controlled manner with attributes. The OGC Simple Feature Access Standard specifies a common storage model of geographical data (point, line, polygon, multi-point, multi-line, etc.) using well-known text (or binary).
Addressing
While there is not a single international standard for addressing, there are standards for encoding addresses. Two examples
are the OASIS
Customer Information Quality (CIQ) xAL10 (extensibleaddressing standard), which is used in the OGC KML standard, and the Internet VCard RFC11.
Currently, ISO TC 211 is working on an international address content model standard that is based on the numerous, often related, national standards for addresses. It may be appropriate for the BI community to use GeoNames in RDF form.
Administrative Divisions
In general, standardization on administrative divisions occurs on the national level. This is adequate for most business intelligence applications, as analysis usually does not occur across country boundaries. In the US, for example, the national standards of zip codes, towns, counties and states work fine. And in other countries, similar divisions exist. However, in a place like Europe, multi-country analyses may be required. The European INSPIRE project has funded some academic work towards solving this issue.12
At the global level, the UN is the international gatekeeper for administrative units and is the arbiter For disputes between nations on common administrative boundaries, if a truly global analysis is required, the UN can be a source of information.13
Actions
Implement support for native spatial data storage in BI databases
Adopt geospatial data access standards in ETL systems
Develop ways to easily expose ETL processes as WPS services
Develop strategies for using table joining and synchronization to integrate geospatial data
Develop international standards for representing addresses and points of interest
Develop international standards for administrative divisions
Develop tighter relationships/support of the spatial component with standards stemming
from the (geo)statistical domain (NetCDF, SDMX, …
L
OCATION IN
OLAP/OLTP
OLAP, or online analytic processing, is the computational engine of business intelligence. All data pre-processing is designed to improve
OLAP, and reporting is only as good as the OLAP s computation. With
today s computational power, analysis doesn t always require an OLAP
engine to occur just-in-time, and so we increasingly see systems
categorized as online transaction processing (OLTP). This trend in no way diminishes the importance of the analysis procedure, or its architectural role vis-à-vis standards.
Accordingly, GeoBI’s worth is largely determined by the types of spatial analytics enabled by spatial data. What location adds to BI is the ability to segment data based on spatial patterns, and find patterns of spatial clustering or diffusion. This adds powerful insights into information patterns that cannot be obtained in any other fashion.
Information Models
All interesting GeoBI analytics and visualizations are predicated upon the ability to process spatial data, and that requires the storage and maintenance of geospatial data in its native, computer-centric form of points, lines and polygons. This must occur at some point in the OLAP pipeline before location can be part of any analysis.
A point is simply an x,y coordinate. This is most commonly a latitude and longitude as seen in GPS coordinates and in popular mapping apps like Google Maps and Bing. A line strings together a set of x,y coordinates to describe a feature such as a road, flight path, or storm track. A polygon is a closed line, so that a finite space is defined, which can be useful to describe sales territories, demographic boundaries, or flood zones.
Standards for storing data as points, lines and polygons are quite mature, as well as means of SQL query and representation of standardized descriptions of
geography through well-known text . SQL Structure
Query Language) is an ISO standard for access to DBMS. SQL defines many data types including a spatial data type.14See OGC s work on Simple Feature Access15 for
greater detail on these simple descriptions of location.
OLAP / OLTP Starting Point
OGC Web Processing Service
http://www.opengeospatial.org/standards/wps
The Web Processing Service (WPS) defines a standardized interface that facilitates the publishing of geospatial processes and the discovery of and binding to those processes by clients. Processes include any algorithm, calculation or model that operates on spatially referenced data. Publishing means making available machine-readable binding information as well as human- readable metadata that allows service discovery and use.
The WPS provides mechanisms to identify the spatially referenced data required by the calculation, initiate the calculation, and manage the output from the calculation so that the client can access it.
Recently, OGC members have embarked upon work to define a limited set of analytic algorithms
that will comprise a statistical analysis profile of WPS. This is relevant to GeoB) because it will
signal to the marketplace what analytic functions are most useful in web deployment. This profile of WPS addresses the following core areas of geospatial data analysis:
Geometric Basics
Aggregation
Proximity
Statistical Measures
Measures of Distribution
Measures of Similarity
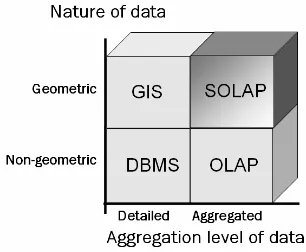
One convenient term coined for the combination of traditional OLAP and geospatial computation is Spatial OLAP, or SOLAP (see Figure 3). A SOLAP tool can be defined as a visual platform built especially to support rapid and easy spatio-temporal analysis and exploration of data following a multidimensional approach comprised of aggregation levels available in cartographic displays as
well as in tabular and diagram displays. 16 While the above statistical analysis profile of WPS should
serve as a foundation, it may be too broad for GeoBI. A SOLAP profile of WPS should be a high priority for GeoBI standards setting.
Figure 3—SOLAP17
Actions
At the OLAP level, when data is ready to be analyzed, human-centric terms like addresses must be translated into physical geometry to support efficient geospatial data processing such as
aggregation, statistical analysis, and computational modeling.
In order to enable not only the standard access to spatial data for SOLAP-based analytics but also the interoperable dissemination of analysis based on such systems, several actions are required.
Implement support for native and standard spatial data storage in databases used by OLAP systems.
Support standard modeling of the geospatial component inside OLAP systems, in a similar way to the one used for SQL. This includes the standardization of the Spatial MDX (or Geo-MDX) extensions.
Develop WFS-like services for SOLAP data cubes in order to allow the dissemination of sub-data cubes that could be used in other systems, e.g. mobile devices.18
16http://sirs.scg.ulaval.ca/Yvanbedard/article_nonprotege/400.pdf
17 Source: JMAP Spatial OLAP – On-Line Analytical Processing for Spatial Databases – Innovative technology to support
Develop WMS-like services for SOLAP data cubes, in order to easily and efficiently disseminate representations of geo-analytical data ready to be included in reports.
Develop a XML/GML based encoding for the exchange of SOLAP data cubes.
Adapt or develop standards, perhaps as ISO 19115/19139 profiles, for the modeling and encoding of SOLAP data cube metadata.
Develop a CSW profile for querying and delivery of metadata dealing with SOLAP data cube
Develop statistical processing standards to promote development of better reporting tools
L
OCATION IN
R
EPORTING
Traditional BI presents its results to decision makers in reports, or dashboards. Dashboards focus on user interfaces that portray analysis graphically in summary form ready to support decision-making. They often also allow users to interact with data obtained
from the OLAP tier of the data warehouse, pulling out different facets of information in charts, graphs, and text reports.
GeoBI adds maps to this mix. There is a direct correlation to dashboards with geospatial capabilities that were developed largely for military uses. Much of their functionality has been adapted for the business world. In the military, these user interfaces often go by the term decision support
services providing situational awareness .
The geospatial domain has a rich tradition of analysis through visualization involving maps. And there is a rich standards baseline for dynamic map generation using information and analysis services. OGC has established a number of standards in this area, from describing how to describe the cartographic styling of a map, to listing the data sets shown on a map and how to symbolize raw data as a thematic map that tells a story offering insight into the data.
Reporting Start Point: Exchangeable Information Models
OGC KML Encoding Standard
http://www.opengeospatial.org/standards/kml/
KML is an XML-based encoding schema for expressing geographic annotation and visualization on existing or future web-based online maps and Earth browsers (that includes not only the
presentation of graphical data on the globe, but also the control of the user s navigation in the sense
of where to go and where to look).
18 Some preliminary specifications of such encoding and services can be found in:
Etienne Dubé, Thierry Badard, Yvan Bédard: XML encoding and Web Services for Spatial OLAP data cube exchange: an SOA approach. CIT 17(4): 347-358 (2009)
OGC Styled Layer Descriptor and Symbology Encoding (SLD) Standard
http://www.opengeospatial.org/standards/symbol
http://www.opengeospatial.org/standards/sld
OGC has defined an architecture for dynamic styling of geographic data so that attractive, persuasive, professional quality maps can be displayed in a services environment. Symbols for geographic features such as points, lines and polygons should be defined using the XML dialect defined in the Symbology Encoding specification. These may be stored in a symbology library. The
Styled Layer Descriptor specification tells software developers how to take these symbols and apply them to data to create explanatory thematic maps.
Actions
Promote support for WMS, WMTS and more map-based visualization in BI
Adapt SLD for complex thematic mapping based on OLTP and OLAP data structures
N
EXT STEPS FOR
G
EO
BI
IN
OGC
This GeoBI White Paper is an initial step toward increasing interoperable access to geospatial information in support of business decisions through the use of open standards. This white paper outlines the use cases and initial architecture that can inform a standards development process for GeoBI.
OGC invites other organizations to participate in this development. GeoBI will depend upon a set of compatible standards so multiple standards developing organizations will be involved. Effective standards development must involve the industry that develops software products that implement the standards. Consumers of GeoBI—the persons making critical decisions based upon GeoBI— must be involved in the definition of the standards in order for the overall enterprise to be effective.
OGC invites additional participation in the consensus process and also invites technical queries related to new implementations of the emerging standards.
Y
OUR PARTICIPATION
Membership in OGC offers many benefits to both your organization and the larger geospatial community. We invite you to learn more. Contact: [email protected].
Visit the OGC website at http://www.opengeospatial.org.
Appendix 1
–
A BI market primer from a GIS perspective
A 2009 Gartner Group paper predicted these developments in business intelligence/data warehousing market. ["Gartner Reveals Five Business Intelligence Predictions for 2009 and Beyond", http://www.gartner.com/it/page.jsp?id=856714]:
• By 2013, due to a lack of information, processes, and tools more than 35 percent of the top 5,000 global companies will regularly fail to make insightful decisions about significant changes in their business and markets.
• By 2012, business units will control at least 40 percent of the total budget for business intelligence.[citation needed]
• By 2010, 20 percent of organizations will have an industry-specific analytic application delivered via software as a service as a standard component of their business intelligence portfolio.
• In 2009, collaborative decision-making will emerge as a new product category that combines social software with business intelligence platform capabilities.
• By 2012, one-third of analytic applications applied to business processes will be delivered through coarse-grained application mashups.
Business Intelligence Market Size
The Business Intelligence software industry is growing at a fast pace. Here are numbers for this important segment of the IT industry, including BI Platform, Analytic Applications and Performance Management, but not including ETL ("extract, transform and load," or data integration):
• Up 22% to 8.8 billion in 2008: http://www.gartner.com/it/page.jsp?id=1017812
• Up 4.2% to 9.3 billion in 2009: http://www.gartner.com/it/page.jsp?id=1357514
• Up 13.4% to 10.5 billion in 2010: http://www.gartner.com/it/page.jsp?id=1642714
According to Gartner, the market for B) platforms will remain one of the fastest growing software
markets. Organizations continue to turn to BI as a vital tool for smarter, more agile and efficient business. The BI platform market's compound annual growth rate (CAGR) through 2014 is expected
to be 7.0%.
Some of the best known commercial products include Microsoft SQL Server Analysis Services, Cognos Powerplay, MicroStrategy, Business Objects and Oracle OLAP, just to name a few. Several acquisitions in the Business Intelligence domain have occurred in the last few years
(http://www.bi-verdict.com/fileadmin/FreeAnalyses/consolidations.htm). Some of the major acquisitions took place in 2007:
• Oracle acquired Hyperion for $3.3B. Hyperion adds complementary products to Oracle's business intelligence offerings including a leading open enterprise planning system, financial consolidation products, and a powerful multi-source OLAP server.
• SAP acquired Business Objects for $6.8B. SAP BusinessObjects offers a broad portfolio of tools and applications designed to optimize business performance by connecting people,
information, and businesses across business networks.
Each of the above-mentioned BI product vendors has developed approaches for tightly integrating geospatial information with their BI products. For example, Business Objects embeds geospatial data via ESRI and PBBI products. SAP offers a GIS Business Connector to ESRI and PBBI products. Oracle has built-in spatial capability. Hyperion is integrated with ESRI products.
The BI industry, as in any other segment of the IT industry, now includes new players with open source offerings like JasperSoft and Pentaho, or software-as-a-service offerings from Tableau and QlikView.
Appendix 2 GLOSSARY OF BI TERMS
Before exploring the role of standards in geospatial in Business Intelligence, here is a brief summary of the common Business Intelligence components and end-user applications.
ETL
Extract, transform, and loading processes involve: extracting data from outside sources;
transforming it to fit operational needs (which can include quality levels); and loading it into the end target (database or data warehouse). BI systems are optimized for speed, and therefore maintain data in unique, idiosyncratic and often proprietary formats. The raw data that feeds these systems are usually in a variety of structured and unstructured formats. And so therefore a key function of the BI system is to extract data from out in the wild and translate it into a usable format. If there is a useful data set that the system cannot handle, then the system is less powerful than it could otherwise be.
OLAP/OLTP
BI users generally have such great data volumes that analysis and decision support can only occur after the data size has been reduced or otherwise manipulated to increase the performance of queries and visualization. Various techniques for aggregation, data thinning, and intermediate statistics often lie at the heart of the analysis, or online analytic processing (OLAP) stage. OLAP
often uses a multidimensional cube view of aggregate data to provide quick access to strategic
information for further analysis.
Increasingly, this data preparation stage can be skipped due to high computational and data transfer performance, or simply when BI methodologies are applied to smaller data sets. In this case, analysis is called online transaction processing (OLTP).
BI on OLTP
Definition of OLTP: Online transaction processing refers to a class of systems that facilitate and manage transaction-oriented applications, typically for data entry and retrieval transaction processing ("transaction" in the context of computer or database transactions).
http://en.wikipedia.org/wiki/OLTP.
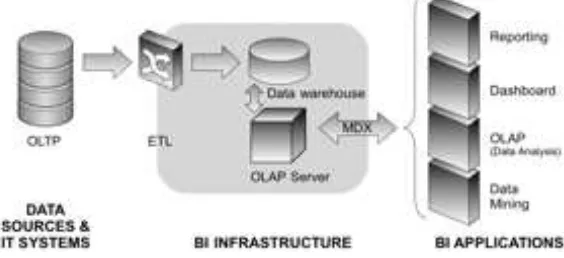
BI Applications like Reporting, Dashboards and Data Mining can directly connect to and interact with databases or data warehouses that are stored in a RDBMS via a query language like SQL. They can also directly render information stored in different file formats. The data can remain in an operational/transactional system and/or, with the help of an ETL tool (see section 2.3 "Location in ETL" for definition) or ETL processes directly in the RRDBMS, the data can be extracted, maybe restructured and then stored in a central dedicated RDBMS data warehouse. This type of back-end infrastructure can be classified as OLTP.
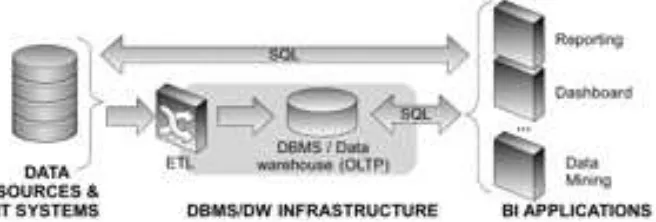
BI on OLAP
All the BI uniqueness and power can be available through applications like Reporting and Dashboard but also advanced data analysis (slide and dice with an OLAP-client end-user
application) if the back-end infrastructure is OLAP ready. The raw data coming from different data sources & IT systems, probably of OLTP type, has to go through some transformations in order to fit the desired OLAP data model using an ETL tool. The transformed data is organized according dedicated data structures, named dimensional data structures (e.g. star or snowflake schemas) in a data warehouse that an OLAP server can access properly. The end-user BI applications then
communicate to the OLAP server (list http://en.wikipedia.org/wiki/Comparison_of_OLAP_Servers) with MDX queries (the query language used in many OLAP server implementations) to support the multidimensional potential of the data.
Figure 3: BI applications from a full BI infrastructure (OLAP/MDX)
Definition of OLAP: In computing, online analytical processing is an approach to swiftly answer multi-dimensional analytical queries (expressed in MDX). OLAP is part of the broader category of business intelligence, which also encompasses relational reporting and data mining. The term OLAP was created as a slight modification of the traditional database term OLTP (Online Transaction Processing). http://en.wikipedia.org/wiki/OLAP.
Definition of OLAP (data) cube: An OLAP cube is a data structure that allows for fast analysis of data. So, the data cube is a notion that resides and exists in the OLAP server only. Talking about the data cube in a data warehouse is an abuse of the term. The OLAP server maps the dimensional concepts (dimensions, hierarchies, members, etc.) with structures that are stored in the data warehouse (dimension tables, fact tables, etc.).
OLAP can also be defined as the capability of manipulating and analyzing data from multiple perspectives. The arrangement of data into cubes overcomes some limitations of relational databases. http://en.wikipedia.org/wiki/OLAP_cube.
Definition of MDX: Multidimensional Expressions (MDX) is a query language for OLAP databases, much like SQL is a query language for relational databases. It is also a calculation language, with syntax similar to spreadsheet formulas.
http://en.wikipedia.org/wiki/MultiDimensional_eXpressions.
BI Applications and Reporting
Results from OLAP queries are often stored in a database optimized for reporting. Of course the key value BI provides is better decision making, which requires connecting analysis to a host of
reporting tools that produce reports, charts, graphs, and in GeoBI, maps. These decision support tools usually also have a component of interactivity, allowing the decision maker control over the outputs.
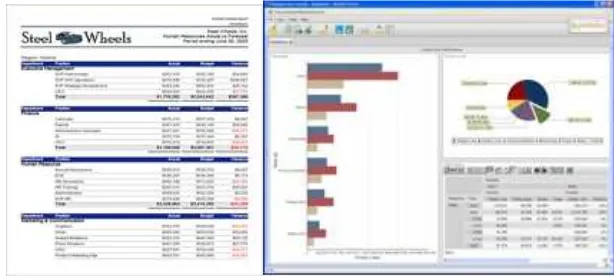
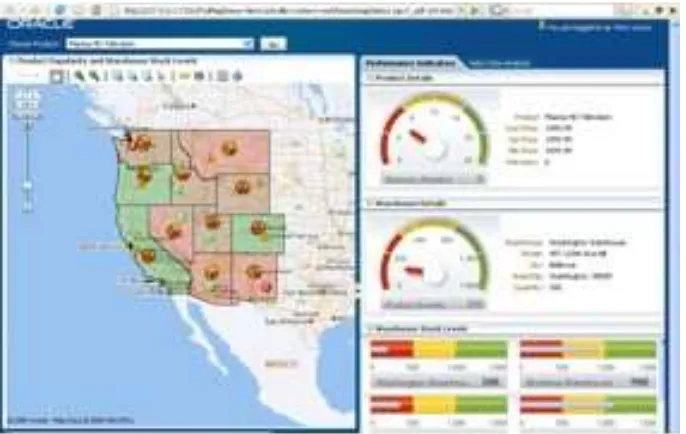
There are different types of end-users benefiting from BI Systems. Depending on their needs, level of expertise and technical skills, BI applications range from the simple reports shown in Figure 4 (on-demand production of reports in different formats—PDF, Excel, etc.—from a dynamic data source); to more interactive dashboards (dynamic web-based applications displaying key operational/analytical data & performance indicator) in Figure 5; to powerful slice and dice data exploration/discovery and analysis (connected to an OLAP source) and predictive analytics & data mining shown in Figure 6.
Figure 4: Examples of BI reports (source: http://www.pentaho.com/)
Figure 5: Examples of web-based dashboards (source: http://www.pentaho.com/)
Figure 6: Example of a Geo-Dashboard made with Oracle (source: http://oracle-maps.blogspot.com/2011/02/oracle-maps-mit-adf-data-visualisation.html)
Left overs
The need for interoperability to connect geospatial information with business intelligence is explained by Johnston McLamb, a business intelligence firm:
Until recently, Geospatial Business Intelligence implementations required substantial financial and time investments. Geospatial information had to be maintained by a highly specialized geographical information system department and was segregated from the company's core information. Worse yet, this data was often owned by a vendor and was only available through
that vendor s proprietary application program interfaces (APIs).
By moving spatial data from proprietary vendor databases to your own databases, we re able to
store your geospatial information according to open GIS standards. This co-located geospatial data is then available for real-time analysis with your existing enterprise data. This data can then seamlessly be integrated and used across the enterprise by reporting tools, applications, web services, and map viewers.
Appendix 3: Other Potential OGC standards
ETL
GeoRSS
http://georss.org
GeoRSS is a community consensus standard and describes a number of ways to encode location in RSS feeds. GeoRSS-Simple supports basic geometries (point, line, box, polygon) and covers the typical use cases when encoding locations. GeoRSS-GML is a formal GML Application Profile and supports a greater range of features, notably coordinate reference systems other than WGS-84. Both formats are designed for use with Atom 1.0, RSS 2.0 and RSS 1.0. Services
OGC Simple Features for SQL Interface Standard
http://www.opengeospatial.org/standards/sfs
In addition to the Simple Features data modeling specification described above, this OGC standard also defines a standard Structured Query Language (SQL) schema that supports storage, retrieval, query and update of feature collections via the SQL Call-Level Interface. In an SQL-implementation, a collection of features of a single type are stored as a "feature table" usually with some geometric valued attributes (columns). Each feature is primarily represented as a row in this feature table, and described by that and other tables logically linked to this base feature table using standard SQL techniques. The non-spatial attributes of features are mapped onto columns whose types are drawn from the set of SQL data types, potentially including SQL3 user defined types (UDT). The spatial attributes of features are mapped onto columns whose types are based on the geometric data types for SQL defined in this standard and its references. Feature-table schemas are described for two sorts of SQL-implementations: implementations based a more classical SQL relational model using only the SQL predefined data types and SQL with additional types for geometry. In any case, the geometric representations have a set of SQL accessible routines to support geometric behavior and query.
OGC Web Feature Service
http://www.opengeospatial.org/standards/wfs
The Web Feature Service Interface Standard defines a simple interface to retrieve and update geospatial data encoded in an XML dialect called the OGC Geography Markup Language (GML) from multiple Web Feature Services. The WFS standard defines interfaces for data access and
manipulation operations on geographic features, using HTTP. A Transactional WFS allows creation, deletion and updating of features in addition to querying and retrieval of features.
OGC Filter Encoding
http://www.opengeospatial.org/standards/filter
The OGC Filter Encoding Standard (FES) defines an XML dialect for describing spatial database queries. A filter expression logically combines constraints on the properties of a feature in order to identify a particular subset of features to be operated upon. For example, a subset of features might be identified to render them in a particular color or convert them into a user-specified format. Constraints can be specified on values of spatial, temporal and scalar properties. An example of a
filter is, find all the properties in Olmstead County owned by Peter Vretanos. This standard is used
by a number of OGC Web Services, including the Web Feature Service, the Catalogue Service, and the Styled Layer Descriptor Standard.
OGC Gazetteer Service Application Profile of the Web Feature Service
http://portal.opengeospatial.org/files/?artifact_id=15529
The OGC Gazetteer Service allows a client to search and retrieve elements of a geo-referenced vocabulary of well-known place-names. Instances within a collection of gazetteer features may be— as the terms in a thesaurus—related to each other and constitute a hierarchical vocabulary of geographic places.
OGC Sensor Observation Service
http://www.opengeospatial.org/standards/sos
The OGC Sensor Observation Service Interface Standard (SOS) provides an API for managing
sensors (e.g., water monitoring) or dynamic sensors (e.g., satellite imaging), measurements made from sensor systems contribute most of the geospatial data by volume used in geospatial systems today. This is one of the OGC Sensor Web Enablement (SWE)
[http://www.opengeospatial.org/ogc/markets-technologies/swe] suite of standards.
Sensor data is not currently a common component of business intelligence data sources, but should become more prevalent as more sensors such as webcams, inventory control systems, traffic counting devices, etc. are deployed and made accessible through web services.
OGC Table Joining Service Interface Standard
http://www.opengeospatial.org/standards/tjs
This OGC standard defines a simple way to describe and exchange tabular data that contains information about geographic objects. Almost all corporate databases contain some kind of geographic identifier, regardless of whether or not the database is housed in a computing environment that supports a Geographic Information System (GIS). Geographic identifiers can include postal codes, municipality names, telephone area codes, or more special purpose identifiers such as school districts. Geospatial linking technology allows this corporate data to be found and used for mapping or spatial analysis.
The Table Joining Service offers a way to expose this corporate data to other computers, so that it can be found and accessed, and if offers a way to merge that data with the spatial data that describes the framework, in order to enable mapping or geospatial analysis.
Geosynchronization—Current OGC standards activity
http://portal.opengeospatial.org/files/?artifact_id=39476
Agile data infrastructures that organizations deploy offer increasingly efficient networks capable of responding to dynamic requirements for using geospatial data. In this context, data provider organizations are being called upon more often than before to deliver current, timely and verified geospatial data over the World Wide Web. In order to satisfy these requirements, data providers must collaborate with outside entities to collect new data and/or update their existing data holdings. This may, for example, mean synchronizing their data with closest-to-source providers.
This may also mean crowd-sourcing their data production or supporting disparate sources of in
-house, enterprise information sources.
Regardless of the nature of the collaboration, there is a need for a service to mediate the interaction between data providers and outside entities acting as data collectors. The service must support data entry with validation, notification of changes to interested parties and allow replication of the data provider's features.
A Geosynchronization service sits between the provider's data store(s) and data collectors. It allows data collectors to submit new data or make modifications to existing data without directly affecting the data in the provider's data store(s) until validation or transformation has been applied, thus ensuring that the quality and fitness for use of the data.
Reporting Services
OGC Web Map Context Encoding Standard
This specification states how a specific grouping maps can be described in a portable, platform-independent format for storage in a repository or for transmission between clients. This description is known as a "Web Map Context Document," or simply a "Context."
A Context Document includes information about the server(s) providing layer(s) in the overall map, the bounding box and map projection shared by all the maps, sufficient operational metadata for Client software to reproduce the map, and ancillary metadata used to annotate or describe the maps and their provenance for the benefit of human viewers.
Services
OGC Feature Portrayal Service Interface Standard
http://portal.opengeospatial.org/files/?artifact_id=22364
Symbology Encoding, mentioned above, describes the encoding for symbols for map features. Applying these symbols to spatial data coming from geographic information services is defined in the specification for a feature portrayal service.
OGC Geographic Objects Interface Standard
http://www.opengeospatial.org/standards/go
TheGeographic Objects Interface Standard provides an open set of common, lightweight, language-independent abstractions for describing, managing, rendering, and manipulating geometric and geographic objects within an application programming environment. It provides both an abstract object standard (in UML) and a programming-specific profile (in Java). The language-specific bindings serve as an open Application Program Interface (API).
OGC Web Map Service and OGC Web Map Tile Service interface standards
http://www.opengeospatial.org/standards/wms
http://www.opengeospatial.org/standards/wmts
The Web Map Service Interface Standard (WMS) provides a simple HTTP interface for requesting geo-registered map images from one or more distributed geospatial databases. A WMS request defines the geographic layer(s) and area of interest to be processed. The response to the request is one or more geo-registered map images (returned as JPEG, PNG, etc.) that can be displayed in a browser application. The interface also supports the ability to specify whether the returned images should be transparent so that layers from multiple servers can be combined or not.