ASSESSMENT OF WATER QUALITY AND
AQUACULTURE IN KLONG NA KA
RANONG PROVINCE, THAILAND
P
REPARED BYKATIE WOLFF
J
ULY2007
THAILAND POST-TSUNAMI SUSTAINABLE COASTAL
LIVELIHOODS PROGRAM
APROGRAM OF THE LEADER WITH ASSOCIATES COOPERATIVE AGREEMENT ON
SUSTAINABLE COASTAL COMMUNITIES AND ECOSYSTEMS (SUCCESS)
IMPLEMENTED BY THE COASTAL RESOURCES CENTER,UNIVERSITY OF RHODE ISLAND IN
PARTNERSHIP WITH THE ASIAN INSTITUTE OF TECHNOLOGY AND THE UNIVERSITY OF
HAWAII
Funded by:
Project Report Outline
I. Introduction……….…...3
II Objectives………....4
III Study Area………..….4
IV Methods and Results……….……...5
A. Site Assessment and Watershed Characterization………..….5
B. GIS Results………..…7
C. Production Results………..….8
D. Research Protocol and Sampling Protocol.……….…...10
V Discussion and Policy Recommendations……….………10
VI Challenges and Lessons Learned……….……..14
VII Sources Cited……….17
VIII Maps………..……....18
I. Introduction
With 7,066 kilometers of coastline, Thailand relies heavily upon marine resources and fisheries as a source of nutritional and economic sustenance. Between 1960 and 1985, the annual capture of marine fish, mollusks, and crustaceans skyrocketed from 146,000 tons to 2.1 million tons, securing Thailand’s position as the third largest marine fishing nation in Asia. By the mid 1970s however, it became clear that despite static production levels, fisheries in the Gulf of Thailand and the Andaman Sea were overexploited. Overfishing in Thailand has caused marine habitat degradation and the depletion of fish stocks. Although the Thai government is working to strengthen fishery policy and develop legal controls, difficulties in regulation and enforcement have limited the
efficacy of these efforts. As urban development and human population growth continue, inland fisheries are increasingly threatened by pollution from industrial waste, pesticides, and sediment.
Aquaculture provides an alternative to reliance on fisheries in Thailand, where per capita fish consumption exceeds 29 kg per person – nearly twice the global average. Concurrent with fish stock declines from overfishing, the Thai aquaculture industry has been rapidly expanding, with production levels increasing from 78,428 metric tons in 1987 to 257,371 metric tons in 1997. However aquaculture is not without its own detrimental effects – improper management can result in negative impacts to local sediments, water quality, and native species. Therefore significant potential exists for improvement in environmental management within the Thai aquaculture industry. When applied to ecosystem-based aquaculture technologies, standard best management
practices minimize waste and environmental degradation from aquaculture while reducing fishing pressure on overexploited fisheries. In order to develop best management practices and promote low impact aquaculture, it is first necessary to develop a baseline understanding of aquaculture’s impacts and the carrying capacity (the amount of biomass a water body can support) of local ecosystems.
aquaculture’s impacts on the surrounding ecosystem and provide a framework for developing sustainable aquaculture practices.
II. Objectives
The research presented in this report was supported by the Thailand Post-Tsunami Sustainable Coastal Livelihoods Program, a cooperative project sponsored by the University of Hawaii, AIT, the Coastal Resources Center (CRC) of the University of Rhode Island, and USAID. The goals of this research are to encourage improvement of monitoring practices and enable an estimation of carrying capacity for the inlet.
Ultimately this research will build local capacity for monitoring the environmental impacts of aquaculture, and pave the way for sustainable aquaculture practices in Klong Na Ka. The objectives of this report are consistent with those stated in the 2-year work plan for the Post-Tsunami Sustainable Coastal Livelihoods Program. Specifically, this research addresses the following program objectives:
• Reestablish a diversity of sustainable livelihoods that emphasize reducing pressures on overexploited fishery resources, promote low impact aquaculture practices, and make full use of the benefits of responsible tourism.
• Build capacity of Thai agencies at the village, tombon, and provincial levels to better integrate existing policies and procedures affecting planning and decision-making in the coastal zone.
• Promote learning and the efficient exchange of techniques and experience in the application of ICM principles and good practices both in Thailand and the region as a whole.
The specific objectives of this project are as follows:
1. Conduct a site and watershed assessment of Klong Na Ka
2. Build capacity with local watershed managers
3. Develop sustainable management recommendations
III. Study Area
Map 1: Klong Na Ka inlet
IV. Methods and Results
A. Site Assessment and Watershed Characterization
o January 25, 2007: Long tail boat survey with Dr. Amrit Bart, Dr. Kevin Hopkins, and local watershed managers from the Ranong Aquaculture Field Office
o February 1, 2007: Source identification survey by kayak, tracing a transect from shrimp farm #3 outfall to Klong Na Ka inlet through the mangroves (See Map 2)
o February 2, 2007: Long tail boat survey with Whittia and staff from Ranong Coastal Aquaculture Station. During this survey we deployed and field tested the new YSI meter at 10 sampling stations in Klong Na Ka (capacity building with local watershed managers)
Administrative Details
In addition to these initial site surveys, I worked with Rattima and other field staff to administer the allocation of resource, living (housing), and research expenses for the project. These administrative details helped provide the critical support without which my project would not have been possible. Additionally, we identified a research assistant – a local fisherman named Bao to help with data collection and translation.
Background Research
Before continuing with the site assessment, I uploaded and installed the necessary software (ArcMap 9.0) and familiarized myself with the available GPS equipment. I analyzed existing GIS data from the surrounding area to delineate an appropriate study area for the project. Additionally I obtained and translated into English local water quality data (2004-2006) provided by Whittia at the Ranong Coastal Aquaculture Field Office. To supplement this data, I examined GIS and water quality data collected from the nearby Phatphrapat study area.
Research Plan and Methodology
I divided the aquaculture component of my study into three categories: Shrimp Farms, Mussel/Oyster Rafts, and Finfish Cages. For each of these systems I developed a
protocol for collecting geolocation and production data by means of a survey. Examples of these surveys are provided in the Appendices section of this document (Appendix 1). I adopted two approaches for acquiring data from shrimp farms and aquaculture rafts, which I describe below:
Shrimp Farms
day. While Bao spoke with the appropriate manager and filled out responses to the survey questions, I obtained permission to walk the perimeter of each pond in order to acquire accurate GPS data. Following the site visit I would then upload the GPS data to a GIS map using ArcMap 9.0. Additionally with the help of field office staff, I translated Bao’s field notes from Thai to English and transferred production data to an Excel spreadsheet.
Fish Rafts
The procedure for surveying finfish rafts in Klong Na Ka was identical to that for shrimp farms aside from the obvious difference in transportation (longtail vs. motorbike). As we approached each raft, Bao introduced our project to the raft owner, asked permission to survey, and collected production data while I obtained GPS coordinates of the raft perimeter. Again the GPS data were uploaded to GIS maps and the survey results translated to English and transferred to Excel spreadsheets.
Mussel/Oyster Rafts
Because bivalve rafts do not require the continual maintenance (e.g. feeding) that fish rafts do, their owners do not need to stay on the rafts. Rather, they allow them to float passively in the water, filter feeding as bivalves so adeptly do. Therefore, our protocol for collecting bivalve data simply required counting the number of strings (multiplying number of strings lengthwise x number of strings widthwise) and recording GPS coordinates at opposite corners of each raft. While this method of data collection was simpler than for shrimp farms and fish rafts, it was in the end every bit as time consuming due to the large number of bivalve rafts in proportion to fish rafts and shrimp farms.
B. GIS Results
Although I had access to maps and satellite images of Klong Na Ka, it was necessary to ground truth the study area and georeference the locations of shrimp farms and
aquaculture rafts in Klong Na Ka. Updated maps will provide watershed managers with the tools they need to effectively monitor water quality in Klong Na Ka. All maps made for the purposes of this report are projected using the spatial reference
WGS_1984_UTM_Zone 47. Map 2 shows a sample track of positional GPS data collected along a transect extending from an outfall at Shrimp Farm #3, through the mangroves into Klong Na Ka. The tight cluster of data points along the northeast bank of the inlet indicates the presence of aquaculture rafts. The red data points were collected from a longtail boat and indicate sampling points for water quality data collection with a YSI probe borrowed from the Ranong Aquaculture Field Office.
Aquaculture in Klong Na Ka extends along a transect approximately 7.02 km in length. The seaward half of this transect (2.10 km in length) is comprised only of bivalve rafts, whereas the segment closer inland (2.65 km in length) consists primarily of bivalve rafts, with approximately 10 fish cages interspersed. Aquaculture ends approximately 9.45 km from the mouth of Klong Na Ka, where the estuary meets the Andaman Sea. Map 4 represents the segment of aquaculture that is restricted to bivalve rafts in Klong Na Ka. Map 5 displays the distribution of fish rafts and bivalve rafts along the segment of Klong Na Ka I have designated as “mixed aquaculture” use. We noted the presence of an additional 5 finfish rafts; however as we were unable to obtain permission to survey these rafts, I have excluded them from these maps. Due to the high rate of harvest for the bivalve rafts, I surveyed all rafts, even those not containing bivalves. The only rafts I excluded from the study were those that were visibly damaged, adrift on the shoreline, or otherwise abandoned.
C. Production Results
Shrimp Farms
For those farms I was granted access to survey (Farms #1, 2, 6, and 7), I collected data to determine the number of ponds, the size of each pond, the number of shrimp stocked, number of days shrimp were stocked, number of catches, and shrimp yield in terms of shrimp/kg, total tonnage, and THB/kg. The results of this analysis are presented in Appendix 2.
Finfish Cages
The finfish species used for aquaculture in Klong Na Ka consist of grouper, snapper, and sea bass. Fish are typically divided by species, and separated out by size as they grow. When fish reach the appropriate size, they are taken to market where they are sold for consumption or to other growers. We were granted permission to survey 5 of the 10 finfish cages in Klong Na Ka. Below I have summarized the findings for each raft:
Fish Raft 1
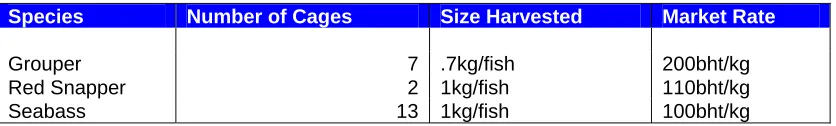
Raft 1 -- the largest of the five at approximately 667m2, contained Grouper, Red Snapper, and Sea Bass at a density of 100-150 fish per cage. Results of data collection for this raft are displayed in the table below.
Table 1: Production results for Fish Raft 2.
Species Number of Cages Size Harvested Market Rate
Grouper 7 .7kg/fish 200bht/kg
Red Snapper 2 1kg/fish 110bht/kg
Fish Raft 2
This was one of the larger fish rafts, with an area of approximately 240 m2. The farmer of this raft said that he begins with 250 Grouper and Red Snapper, and 150 Sea Bass. As the fish grow he then separates them and divides them among different cages by size.
Fish Raft 3
This was the smallest of the rafts surveyed at 104.8 m2. Production data for Raft 2 is presented in the table below.
Species Number of Cages Fish Per Cage Size Harvested
Red Grouper 8 150 0.4-.05kg
Red Snapper 4 200 0.5 kg
Table 2: Prodcuction results for Fish Raft 3.
Fish Raft 4
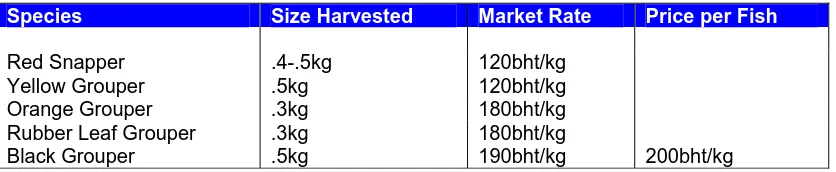
This large raft (approximately 430 m2) exhibited the greatest amount of species diversity of all the fish rafts surveyed. The fish farmer explained that he kept more than 800 grouper and snapper on his raft. The production data are provided in greater detail in the following table.
Species Size Harvested Market Rate Price per Fish
Red Snapper .4-.5kg 120bht/kg
Yellow Grouper .5kg 120bht/kg Orange Grouper .3kg 180bht/kg Rubber Leaf Grouper .3kg 180bht/kg
Black Grouper .5kg 190bht/kg 200bht/kg Table 3: Production results for Fish Raft 4
Fish Raft 5
The owner of this raft was not present, but a relative granted us permission to acquire GPS data points (therefore this raft appears on the Map 5). The only production data we were able to obtain were the species distribution (listed below).
Species
Bivalve Rafts
At the time of this study, Klong Na Ka contained 138 bivalve rafts (136 green mussel and 2 oyster). These rafts range in size from 176m2 to 600 m2, with an average area of approximately 387.3 m2. If we assume an average of 4 mussel strings per m2, we may then assume an average of 3,486 mussel strings per raft. Each mussel string holds anywhere from 25-100 mussels (depending on size, growth rate, etc…). Based on these assumptions and calculations, one may assume an average of 77,457 mussels per raft. With 138 bivalve rafts in Klong Na Ka there may be as many as 10,698,086 bivalves in the system at one time (excluding natural populations). In reality, many of the rafts we surveyed had been recently harvested, and therefore it is unlikely that every
georeferenced raft is stocked with adult bivalves at the same time. Additionally, harvests rotate such that different rafts carry different sizes and ages of oysters at different times. These considerations may affect the numbers provided in these estimates.
D. Research and Sampling Protocol
Initial surveys of Klong Na Ka revealed a clustered distribution of mussel rafts and fish cages. After consultation with Dr. Kevin Fitsimmons (University of Arizona), I
developed a water quality sampling protocol based on these aquaculture clusters. The schematic diagram represented in Appendix 3 provides a sense of cage and raft
distribution in the inlet (Please note: This is only a schematic diagram; therefore exact numbers of rafts and cages are not presented in this figure, which is intended to provide a general sense of aquaculture distribution).
Based on this distribution of alternating fish cage and mussel raft clusters, I then established a sampling protocol. In developing the sampling protocol, I aimed to accomplish the following goals:
1. Capture water quality conditions both within and outside of each cluster type
2. Promote timely and efficient collection of water quality data (half a day maximum)
In order to accomplish these objectives, I established a system whereby overlapping sample points could represent stations along transects extending through each cluster and seaward along Klong Na Ka. I developed a coding scheme for these sample points, with “M” indicating mussel raft, “F” indicating fish cage, “S” indicating a point independent of the cluster, and “C” indicating points within a cluster. I then added numbers following each coded sample point in order to distinguish different points and clusters. Appendix 4 illustrates a schematic example of this coding scheme.
Three primary land uses characterize the Klong Na Ka watershed: natural and restored mangroves, shrimp farms, and aquaculture comprised of finfish cages and bivalve rafts. My objectives were to conduct a watershed assessment and work with local managers to build capacity for developing a water quality monitoring plan to promote environmental sustainability. As Klong Na Ka is relatively undeveloped and therefore largely
unaffected by urban development and traditional agriculture, the study area presents a unique opportunity for examining the influence of different types of aquaculture – both upon one another and upon a natural estuarine system.
Shrimp Farms
Shrimp farms can cause water pollution by discharging large volumes of poorly oxygenated wastewater containing nutrients, sediments, and fecal material into local hydrologic systems. Additionally these farms may release other chemicals (such as antibiotics) and exotic species into local ecosystems. Of all these threats, I hypothesized that nutrients and low dissolved oxygen are most crucial to water quality in Klong Na Ka. Estimates show that only 17% by dry weight of total feeds applied to a pond is harvested as shrimp; 15% is not consumed, 20% becomes fecal material and another 48% goes to energy utilization, metabolites and molted shells (Macintosh and Phillips, 1992). The production of nearly 58,000 tons of shrimp from a strip of land in southeastern Thailand in 1992 resulted in the addition of around 4.1 tons of nitrogen, 0.4 tons of phosphorus and 11 tons of biological oxygen demand daily to nearby coastal waters (Briggs, 1993). Undeniably shrimp farms have the potential to cause water quality degradation in Klong Na Ka. However, it is important to note the difference in scale. The “strip of land” studied by Briggs (1993) covered an area measuring 40 km by 2 km. Klong Na Ka represents a much smaller watershed. The largest pond measured in this study was only 43 Rai in length with the total tonnage of harvested shrimp estimated at only 92.4. The best solution for promoting sustainable management of these local shrimp farms begins with monitoring.
In-depth discussions during a site visit with aquaculture professor Dr. Kevin Fitzsimmons (University of Arizona) revealed the abnormally frequent use of paddle wheels to
oxygenate ponds in shrimp farms around Klong Na Ka. Dr. Fitzsimmons suggested that as a result of such thorough oxygenation, these farms may in fact be contributing effluent with higher dissolved oxygen concentrations than the natural background level. A future study would benefit from a comparison of dissolved oxygen readings along a transect extending from inside the pond into Klong Na Ka during discharge. Another important consideration is seasonality. This study only covered the dry season, ending just as shrimp farms begin to shut down for the rainy season. How does this seasonal turnover impact water quality in Klong Na Ka? This is another question worth investigating. Water quality monitoring in the inlet both during shrimp production in the dry and hot seasons and during the period of shrimp farm closure for the rainy season might provide some answers.
access to water quality and production data logs. Therefore these systems already appear to be carefully managed. Audits and monitoring would help ensure compliance with the regulations already in place.
Mangroves
It would be impossible to ignore the vast acreage of mangroves surrounding shrimp farms in the watershed. Initially I had planned to calculate mangrove area and species
distribution in the watershed to estimate nutrient uptake rates. However I learned from speaking with shrimp farm managers that the ponds are pumped out at low tide, when water levels fall far below the reach of mangrove root systems. Therefore, as water is pumped rapidly out into Klong Na Ka, mangroves are not able to effectively absorb nutrients in shrimp farm effluent. Additionally as Kevin Fitzsimmons (University of Arizona) suggested, the shear magnitude of mangroves in the watershed may lead to the mangroves actually depositing as many or more nutrients (in the form of solid
biomass/leaf litter) as they uptake. For these reasons I chose to exclude the role of mangroves from this study. I would suggest a more in depth examination of mangrove contribution to nutrient cycling for a future study.
Finfish Cages
If managed properly, fish culture in Klong Na Ka can potentially provide financial support and diversification for local fishermen who have traditionally gone out to sea for their livelihoods. The finfish species used for aquaculture in Klong Na Ka consist of grouper, snapper, and sea bass. Grouper typically sell at a smaller size because they consume more feed and are therefore more expensive to maintain. Red Snapper may be sold at larger sizes, typically 0.5 kg. Most fish raft owners were using a combination of pellets and trash fish as feed. As aquaculture expands in Klong Na Ka, it may be
worthwhile to develop a system-wide feeding scheme that minimizes the use of trash fish and takes into consideration the different needs of the fish species grown. Staggering fish cages between surrounding bivalve rafts is one method for controlling nutrient discharge from fish cages. The disproportionate number of fish cages to bivalve rafts (10 fish cages counted as opposed to 138 bivalve rafts) indicates that this system – whether intentional or not – is already in place. An interesting future study might address the effectiveness of this staggered system in Klong Na Ka. Equipment failure prevented the completion of a bathymetric survey of Klong Na Ka for this study. A future study of oxygen exchange between the bottom sediments and finfish cages would provide some valuable insight into the oxygen budget of Klong Na Ka.
Bivalve Rafts And Maintaining A Balance
Ka if water quality is to be preserved. The current system appears to be working. Filter feeding bivalves surround nutrient-producing fish cages and absorb the waste discharged from nearby shrimp farms. For how long though will this balance remain? More studies into the interaction between these three systems at different seasons would contribute greatly to future watershed management efforts.
Recommendations
I present the following suggestions for developing a monitoring scheme and management plan to promote water quality maintenance and sustainability in Klong Na Ka:
1. Develop a monitoring scheme that captures the variability – both human and natural – within Klong Na Ka.
Specifically account for the following types of variability:
o Seasonal
o Tidal
o Diurnal/Nocturnal (chlorophyll-a may fluctuate according to daily cycles and affect dissolved oxygen in the water column)
o Human: These aquaculture rafts represent a dynamic system. This has the advantage of lending adaptability as raft owners may transport rafts
seaward or landward in response to changing environmental variables (e.g. salinity, pH, etc…). However this adaptability also presents a
disadvantage in that it is difficult to track and manage the distribution of rafts over time. A seasonal inventory of raft locations and production would assist in tracking the expansion of aquaculture over time and give managers the tools they need to adjust monitoring and watershed planning efforts accordingly
2. Incorporate GPS and GIS into monitoring.
This enables watershed managers to establish sampling stations and improve sampling efficiency. GIS enables managers to track patterns in raft
distribution and to plot sampling transects and routes. Historical data will provide a record of aquaculture activity in the inlet over time and foster better management decision-making in the future. A solid GIS data log will also promote and support future studies that incorporate various GIS-based models (e.g. nutrient modeling, water quality modeling, PRISM modeling, etc…).
3. Promote the use of Klong Na Ka for additional studies.
Klong Na Ka presents a tremendous opportunity for various types of research. Some suggestions for future studies:
o Bathymetric analysis (oxygen exchange with bottom sediments and finfish cages)
o The effectiveness of staggering clusters of bivalve rafts and finfish cages to improve water quality
o Modeling (Nutrients, water quality, sediment transport, etc…)
o Feasibility analysis for ecotourism
4. Encourage best management practices in aquaculture management
o Investigate alternate materials for raft flotation. The current Styrofoam blocks cannot withstand the sun and heat, and break down. This creates added hassle for raft owners and contaminates the Klong Na Ka ecosystem. Plastic barrels might be a plausible substitute.
o Invest in a feeding regime that is environmentally and
economically sustainable for raft owners. Is a more cost-effective, environmentally friendly option available?
o Collect production data from raft owners to track and monitor aquaculture production in Klong Na Ka. This data might be collected in the form of a survey, town meeting, etc....
Conclusion
Klong Na Ka is a dynamic ecological system characterized by changing seasons, tides, and human aquaculture development. At present the system appears to be in balance, with minimal fish cage culture and moderate bivalve culture. Local watershed managers should establish a system to track and monitor the activities of these three systems and their individual and collective water quality impacts. Tracking trends in aquaculture development will enable managers to make informed decisions as they look to develop economic opportunities for local communities while maintaining and protecting the chemical, physical, and biological integrity of Klong Na Ka for future generations.
This assessment will build local capacity for environmental monitoring and provide the background research necessary for developing sustainable aquaculture practices in Klong Na Kha inlet. The report will be provided to the Thai Fisheries Department, the Ranong Aquaculture Field Office, and representatives of local governments. The scope of this project extends beyond the Klong Na Kha inlet; this report and future research stemming from it may serve as a model for sustainable aquatic management in Southeast Asia and other regions of the world.
As with any international project, I faced a number of challenges in the field. I will discuss the nature of these challenges and present some suggestions for avoiding similar complications in future projects.
Illness
Perhaps the most devastating (and unavoidable) challenge I faced was time lost to illness. Just as I was beginning to develop a system and schedule for collecting field data, I contracted Typhoid Fever – a treatable yet temporarily debilitating illness that kept me from field work for one of my three months at the site. I made up for this lost time in as many ways as possible – complying with my doctor’s request to avoid field work and instead working on other aspects of the project (GIS). I also used this time to conduct an inventory of my equipment and traveled to Bangkok to secure the use of more reliable field sampling equipment.
Resource Limitations
While keeping in mind the financial limitations of my project, I believe it would have been useful to have set up a backup plan to secure the use of sampling equipment in the event the original plan (i.e. sharing equipment with the Ranong Aquaculture Field Office) did not pan out. Before coming to Thailand I listed the equipment and supplies I would need to carry out water quality monitoring and checked to see that these materials would be available t o me in the field. When I arrived however, I found myself an hour’s drive from the Field Station and without any independent means of transport. This left me dependent upon an already swamped field staff for transportation and translation needs they simply didn’t have the time or energy to provide. Consequently I struggled to meet the stated objective of building capacity with local watershed planners and managers (Although I did help prepare a 2-day training workshop on water quality monitoring and the use of GPS/GIS for watershed management).
Permission to Access Shrimp Farms and Aquaculture Rafts
We were unable to obtain access to shrimp farms #4, and #5 – the two largest farms in the Klong Na Ka subwatershed. Additionally, despite repeated site visits, we were only able to talk with and collect data from about half of the fish cage owners in Klong Na Ka. It may have been possible that the other half were out of production or a matter of poor timing. Perhaps in the future field staff could get a head start on securing access to shrimp farms and aquaculture rafts prior to actual data collection.
Language and Cultural Barriers
The cultural barriers I faced were few and far between; mostly involving simple
differences (e.g. Muslims do not work on Fridays) and adjustments to a different climate and lifestyle. In general I found the local community to be welcoming and
accommodating.
It took several weeks to designate an assistant (Bao) to help with local transportation (via motorbike) and some translation. It would have been useful to have designated this position earlier, and perhaps to have secured a safer means of transport for longer trips (e.g. to the Ranong Aquaculture Field Office). Although Bao’s English comprehension is excellent, there were several instances when I needed additional assistance in translating spreadsheets and field notes from Thai. Because I did not have a specific person
available to ask for this assistance, I had to rely upon a seemingly overburdened field staff for translation help, thereby adding tension to what already appeared to be a stressful office environment.
I believe the solution to all these challenges (illness aside) is to encourage better pre-project communication and planning. I might have been able to collect more data and cover more ground had better access to transportation, translation assistance, and reliable equipment been arranged beforehand. Of course I recognize the limitations and
VII. Sources Cited
Briggs, M.R.P. 1993. Status, problems and solutions for a sustainable shrimp culture industry with special reference to Thailand. Unpub. report to the Overseas Development Administration.
Macintosh, D.J. and M.J. Phillips. 1992. Envirommental issues in shrimp farming, pp. 118-145. In de Saram, H. and T. Singh (eds) Shrimp '92: Proceedings of the 3rd Global Conference of the Shrimp Industry, Hong Kong, 14-16 Sept. 1992, Infofish, Kuala Lumpur, Malaysia.
J. Honculada Primavera. Shrimp Farming in the Asia-Pacific: Environmental and Trade Issues and Regional Cooperation. Nautilus Institute Workshop on Trade and
Environment in Asia-Pacific:Prospects for Regional Cooperation. September 23-25, 1994. East-West Center, Honolulu
Reiter, M. A., G. R. Parsons, R. W. Scarborough, C. Fan, and S. M. Thur. 2006. An interdisciplinary conceptual metamodel for the St. Jones River watershed, Delaware: Development, results, and implications. J. Environ. Monit. Restor. 2:38-50.
Reiter, M. A. 2004. A simple fuzzy logic approach to analyze integrated interdisciplinary “four-component” conceptual resource management models. Interdisc. Environ. Rev. 6(2):1-13
VIII. Maps
Phase I Site Assessment Sampling Points
Kayak Data (GPS)
Longtail Data (YSI/GPS)
Bivalve Rafts in Klong Na Ka
Bivalve Rafts in Klong Na Ka
IX. Appendices
0 0.35 0.7 1.4 2.1 2.8
Kilometers 0 0.1 0.2 0.4 0.6 0.8
Kilometers
µ
0 0.35 0.7 1.4 2.1 2.8
Kilometers 0 0.1 0.2 0.4 0.6 0.8
Kilometers
µ
Mixed Aquaculture in Klong Na Ka
Key
Appendix 1: Sample Shrimp Farm Survey
Appendix 2: Shrimp Farm Production Data**
Shrimp
Stocked 800,000 600,000 900,000 N/A N/A 900,000 800,000 800,000 N/A 600,000 600,000 500,000 600,000 N/a
Number
** Note: Shrimp Farm Number 3 was Out of Production, and Access to Shrimp Farm Numbers 4 and 5 was denied.
Fish Cluster 2 Fish Raft 2
Fish Cluster 1 Mussel Cluster 3
Mussel Cluster 1 Mussel Cluster 2
Mussel Raft 5 Mussel Raft 4
Mussel Raft 1 Fish Raft 1 Mussel Raft 2
Mussel Raft 3
Appendix 4: Example sampling scheme for a mussel raft cluster in Klong Na Ka
Sampling Scheme (Mussel Raft)
MS1/MC1 MS2 MS3/MC2 MC4
MC3
Mussel Raft 5
Mussel Raft 1 Mussel Raft 2 Mussel Raft 3 Mussel Raft 4
Sampling Location
Mussel Sample (MS1, MS2…)
Mussel Cluster (MC1, MC2…) KEY: